. 2018 Oct 5;19(10):3043.
doi: 10.3390/ijms19103043.

Secondary Unconjugated Bile Acids Induce Hepatic Stellate Cell Activation

Affiliations

Secondary Unconjugated Bile Acids Induce Hepatic Stellate Cell Activation

Kunihiro Saga et al. Int J Mol Sci. .

Abstract

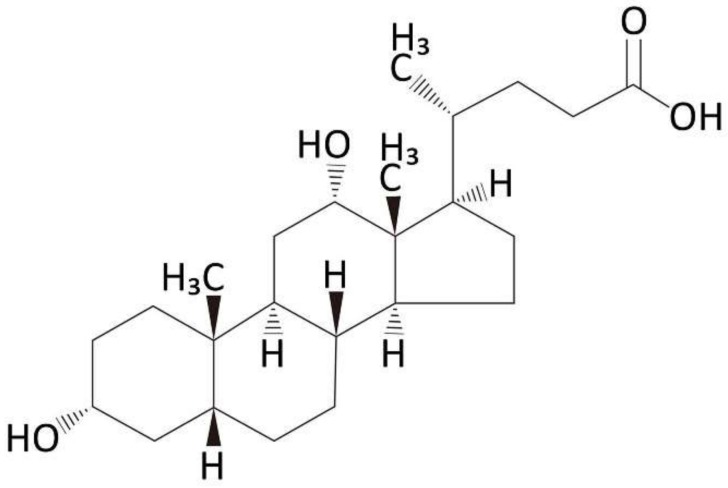
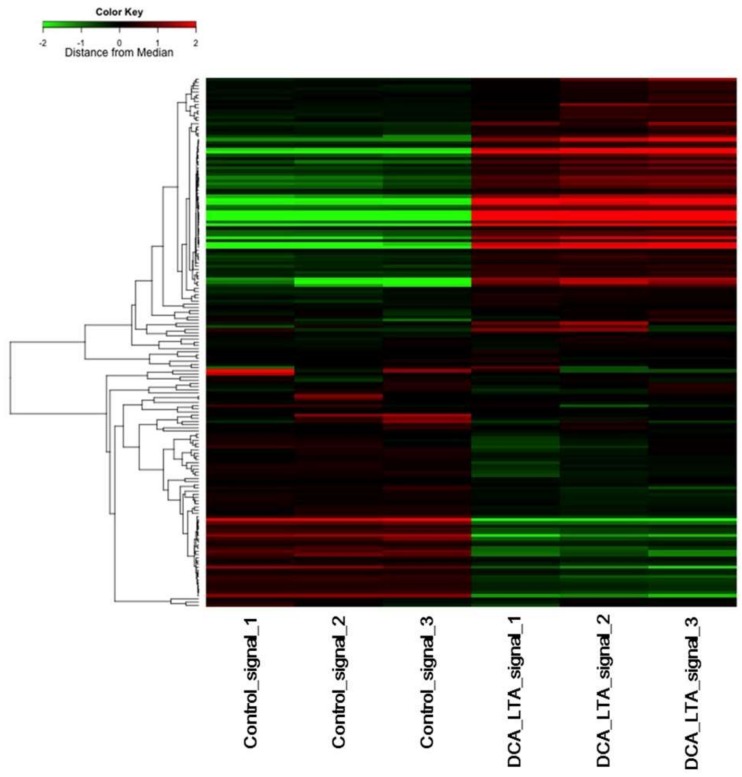
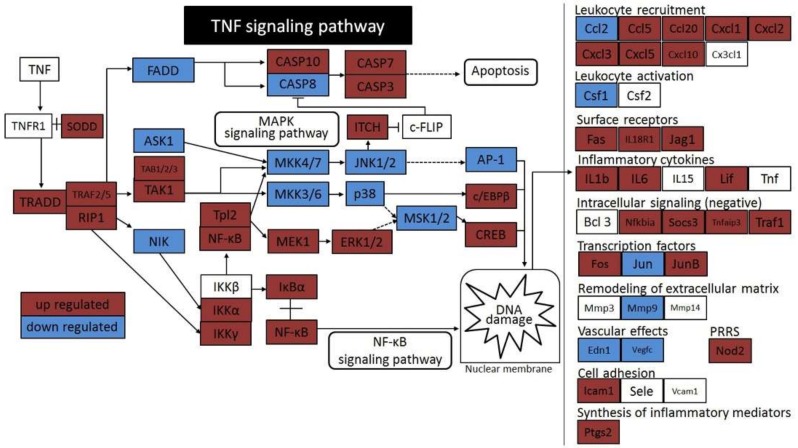
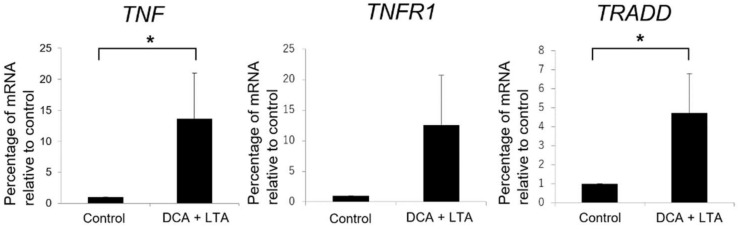
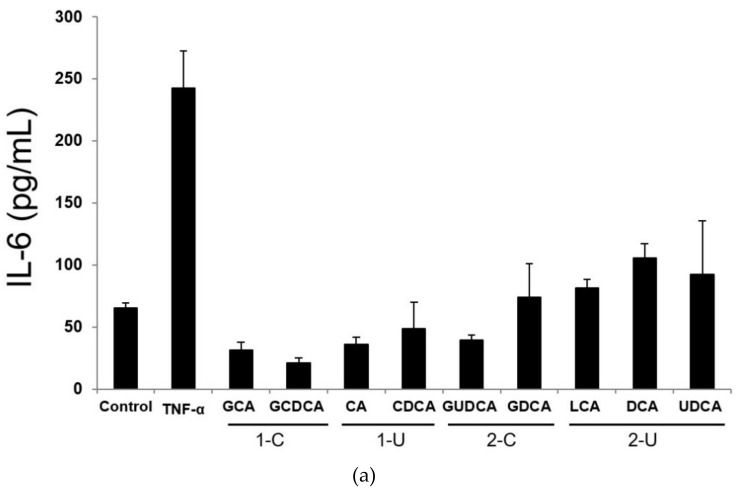
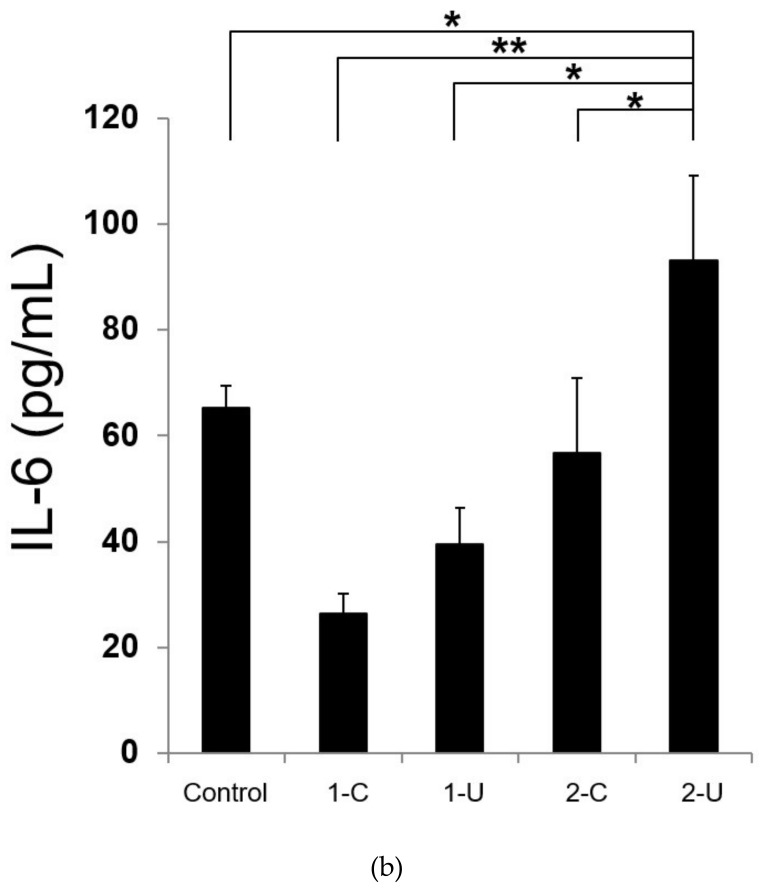
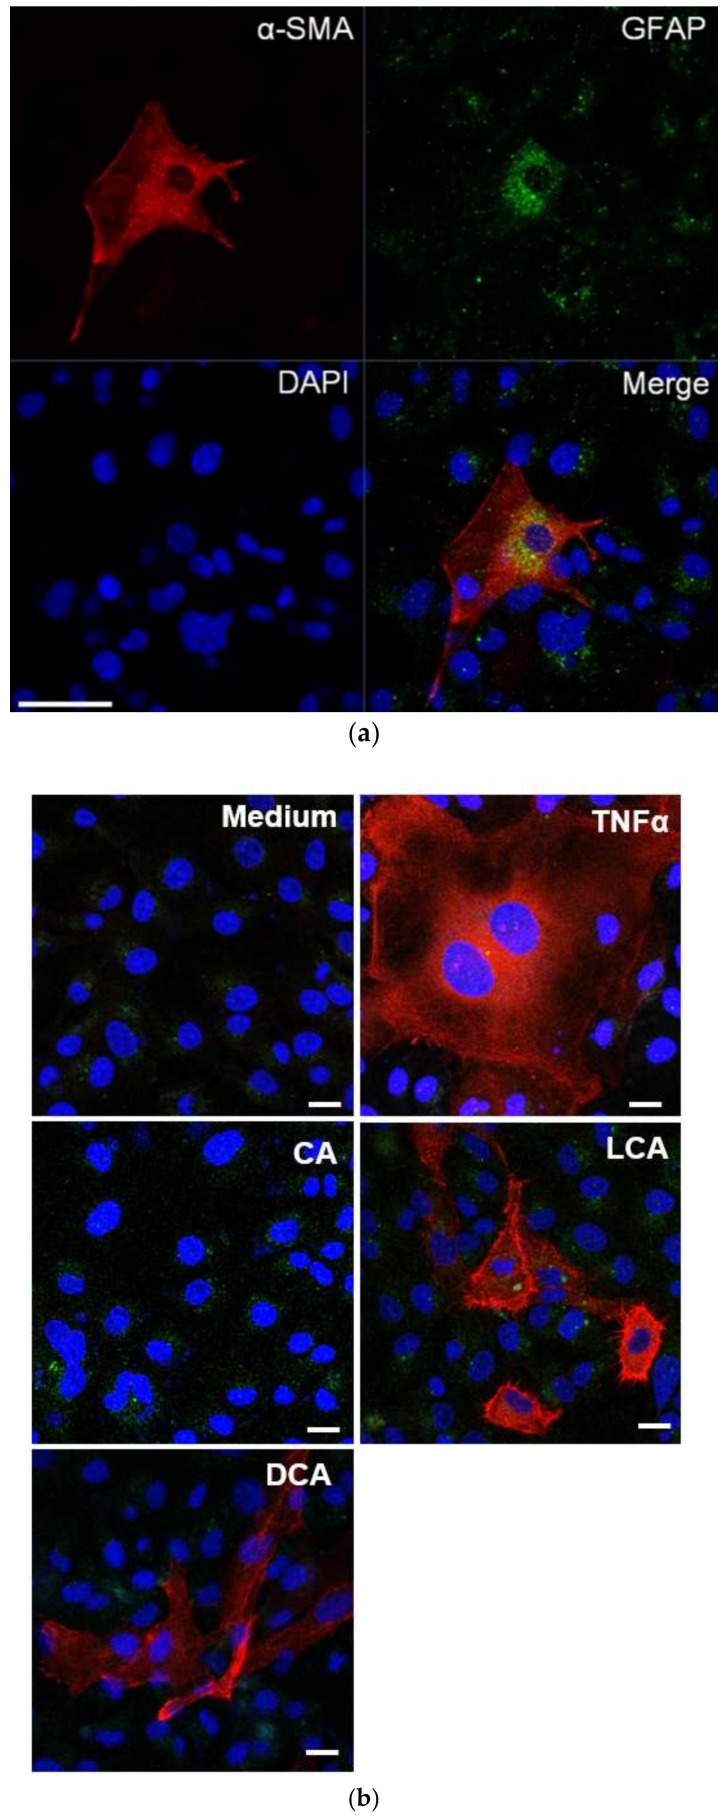
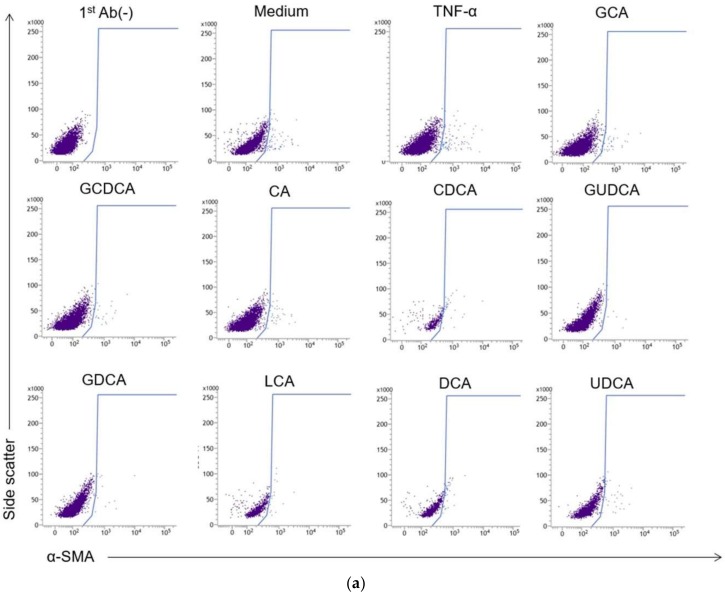
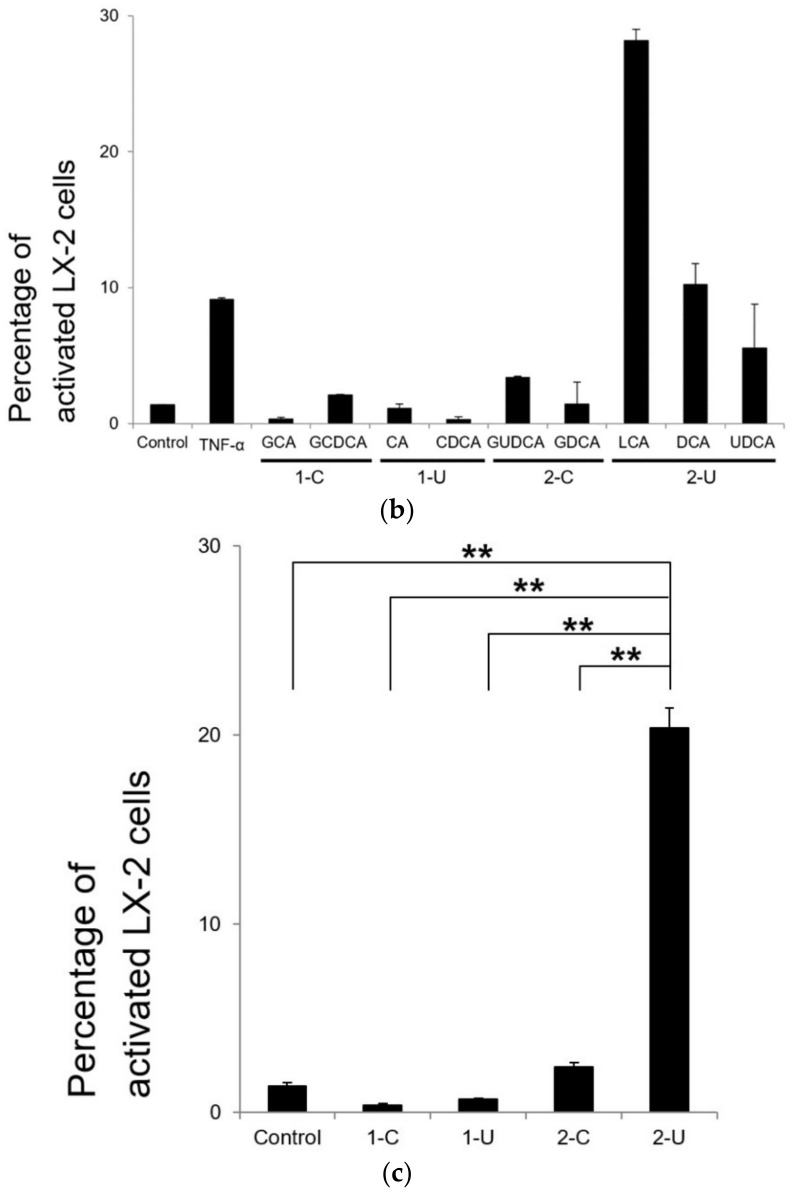
Hepatic stellate cells (HSCs) are key players in liver fibrosis, cellular senescence, and hepatic carcinogenesis. Bile acids (BAs) are involved in the activation of HSCs, but the detailed mechanism of this process remains unclear. We conducted a comprehensive DNA microarray study of the human HSC line LX-2 treated with deoxycholic acid (DCA), a secondary unconjugated BA. Additionally, LX-2 cells were exposed to nine BAs and studied using immunofluorescence staining, enzyme-linked immunosorbent assay, and flow cytometry to examine the mechanisms of HSC activation. We focused on the tumor necrosis factor (TNF) pathway and revealed upregulation of genes related to nuclear factor kappa B (NF-κB) signaling and senescence-associated secretory phenotype factors. α-Smooth muscle actin (α-SMA) was highly expressed in cells treated with secondary unconjugated BAs, including DCA, and a morphological change associated with radial extension of subendothelial protrusion was observed. Interleukin-6 level in culture supernatant was significantly higher in cells treated with secondary unconjugated BAs. Flow cytometry showed that the proportion of cells highly expressing α-SMA was significantly increased in HSCs cultured with secondary unconjugated BAs. We demonstrated that secondary unconjugated BAs induced the activation of human HSCs.

Keywords: DNA microarray; hepatic stellate cell; secondary unconjugated bile acid; tumor necrosis factor signaling pathway.


Conflict of interest statement

The authors declare no conflicts of interest.

Figures

Figure 1
Figure 1
Chemical structure of deoxycholic acid (DCA). The molecular weight of DCA is 392.572 g/mol.
Figure 2
Figure 2
Clustering diagram of gene trees and heatmap of the tumor necrosis factor (TNF) signaling pathway generated using the MeV software. LX-2 cells were cultured in Dulbecco’s modified Eagle’s medium (DMEM) with or without 300 μM deoxycholic acid (DCA) and 25 μg/mL lipoteichoic acid (LTA) for 48 h in triplicate. We used the hierarchical clustering method to sort the genes (the distance metric was “Pearson correlation” and the linkage method was “average linkage clustering”). Rows represent the genes, and columns represent the samples. Colors indicate the distance from the median of each row. Red and green blocks represent genes whose expression levels were higher or lower than in the control, respectively.
Figure 3
Figure 3
Schematic representation of deoxycholic acid (DCA) cytotoxicity mediated by the activation of the TNF signaling pathway. Solid arrows indicate direct interactions and broken arrows indicate indirect effects. Red represents statistically significant upregulation and blue represents statistically significant downregulation (p ≤ 0.05). Abbreviations: AP-1, activator protein-1; ASK1, apoptosis signal regulating kinase 1; Bcl-3, B-cell lymphoma 3; CASP, caspase; Ccl, C–C motif chemokine ligand; CEBPB, CCAAT/enhancer-binding protein beta; c-FLIP, cellular Fas-associated via death domain (FADD)-like interlukin (IL)-1β-converting enzyme-inhibitory protein; Csf, colony stimulating factor; Cx3cl1, C–X3–C motif chemokine ligand 1; Cxcl, C–X–C motif chemokine ligand; Edn1, endothelin 1; ERK, extracellular signal-related kinase; FADD, Fas associated via death domain; Fas, Fas cell surface death receptor; Fos, Fos proto-oncogene; ICAM1, intercellular adhesion molecule 1; IκB, inhibitor of nuclear factor kappa B (NF-κB); IKK, IκB kinase; ITCH, itchy E3 ubiquitin protein ligase; Jag1, Jagged1; JNK, c-Jun N-terminal kinase; Jun, Jun proto-oncogene; Lif, leukemia inhibitory factor; MAPK, mitogen-activated protein kinase; MEK1, MAPK/ERK kinase 1; MKK, mitogen-activated protein kinase kinase; MSK, mitogen- and stress-activated protein kinase; NF-κB, nuclear factor kappa B; NIK, NF-κB-inducing kinase; Nod2, nucleotide-binding oligomerization domain-containing 2; Ptgs2, prostaglandin-endoperoxide synthase 2; RIP1, receptor-interacting protein 1; Sele, selectin E; Socs3, suppressor of cytokine signaling 3; SODD, silencer of death domains; TAB, transforming growth factor beta (TGF-β)-activated kinase binding protein 1; TAK1, TGF-β-activating kinase 1; Tnfaip3, TNF-α-induced protein 3; TNFR1, TNF receptor superfamily member 1; Tpl2, tumor progression locus 2; TRADD, TNFR1-associated via death domain; TRAF, TNF receptor-associated factor; Vcam1, vascular cell adhesion molecule 1; Vegfc, vascular endothelial growth factor C.
Figure 4
Figure 4
Effects of deoxycholic acid (DCA) and lipoteichoic acid (LTA) on tumor necrosis factor (TNF), TNF receptor superfamily member 1 (TNFR1), and TNFR1-associated via death domain (TRADD) messenger RNA (mRNA) expression levels in LX-2 cells. The mRNA expression levels were normalized to those of β-actin and are presented as mean percentages relative to control ± standard deviation. The p-values were as follows: TNF, 0.036; TNFR1, 0.053; and TRADD, 0.048. TNF and TRADD mRNA expression levels were significantly higher in the DCA (300 µM) + LTA (25 μg/mL) group than in the control group treated with medium alone (* p ≤ 0.05).
Figure 5
Figure 5
IL-6 levels in LX-2 cells. (a) IL-6 concentration in the supernatant of LX-2 cells. After treatment with TNF-α or nine bile acids (BAs), LX-2 cells were cultured for 48 h and the culture supernatant was collected. Supernatant levels of IL-6 were determined using an enzyme-linked immunosorbent assay. 1-C, primary conjugated BAs; 1-U, primary unconjugated BAs; 2-C, secondary conjugated BAs; 2-U, secondary unconjugated BAs. (b) IL-6 concentrations in the supernatant of LX-2 for BA classification. Data are expressed as the mean ± SD. Comparisons of different LX-2 cell treatments were carried out using one-way analysis of variance followed by Bonferroni’s correction (* p < 0.05; ** p < 0.01).
Figure 5
Figure 5
IL-6 levels in LX-2 cells. (a) IL-6 concentration in the supernatant of LX-2 cells. After treatment with TNF-α or nine bile acids (BAs), LX-2 cells were cultured for 48 h and the culture supernatant was collected. Supernatant levels of IL-6 were determined using an enzyme-linked immunosorbent assay. 1-C, primary conjugated BAs; 1-U, primary unconjugated BAs; 2-C, secondary conjugated BAs; 2-U, secondary unconjugated BAs. (b) IL-6 concentrations in the supernatant of LX-2 for BA classification. Data are expressed as the mean ± SD. Comparisons of different LX-2 cell treatments were carried out using one-way analysis of variance followed by Bonferroni’s correction (* p < 0.05; ** p < 0.01).
Figure 6
Figure 6
(a) Distribution of α-smooth muscle actin (α-SMA; red) and glial fibrillary acidic protein (GFAP; green) in LX-2 cells exposed to bile acids. LX-2 cells were cultured with 500 μM DCA and were immunostained for α-SMA and GFAP. Nuclei were stained with 4′,6-diamidino-2-phenylindole (DAPI; blue). Image overlays are shown. Scale bars, 50 µm. (b) Morphological changes in LX-2 cells exposed to different bile acids. LX-2 cells were treated with 500 µM cholic acid (CA), LCA, or DCA for 48 h. In LX-2 cells treated with control medium, few morphological changes were observed. In LX-2 cells treated with TNF-α, hypertrophy of the cytoplasm, a morphological change in which the subendothelial protrusion extended radially, was observed. In groups treated with primary conjugated BAs, primary unconjugated bile acids (Bas), and secondary conjugated BAs, almost no change in morphology was observed. In the group treated with secondary unconjugated BAs, cytoplasm enlargement was more prominent. Scale bars, 20 µm. For other BAs, see Supplementary Materials Figure S1.
Figure 7
Figure 7
Activation of LX-2 cells. (a) Representative plots of α-smooth muscle actin (α-SMA) in LX-2 cells cultured with or without 10 ng/mL TNF-α and various BAs at a concentration of 500 µM for 48 h that were analyzed using flow cytometry. Gating was performed using the group without the primary antibody (1stAb(−)) as control. Hepatic stellate cell (HSC) population was analyzed by α-SMA (x-axis) and side scatter (y-axis). (b) Percentages of activated HSCs with high expression of α-SMA cultured with various bile acids were measured using flow cytometry. Data are expressed as the mean ± SD of 5–7 separate experiments. 1-C, primary conjugated BAs; 1-U, primary unconjugated BAs; 2-C, secondary conjugated BAs; 2-U, secondary unconjugated BAs. (c) Percentages of activated HSCs averaged per BA treatment group. Data are expressed as the mean ± SD. Comparisons of different LX-2 cell treatments were carried out using one-way analysis of variance followed by Bonferroni’s correction (** p < 0.01).
Figure 7
Figure 7
Activation of LX-2 cells. (a) Representative plots of α-smooth muscle actin (α-SMA) in LX-2 cells cultured with or without 10 ng/mL TNF-α and various BAs at a concentration of 500 µM for 48 h that were analyzed using flow cytometry. Gating was performed using the group without the primary antibody (1stAb(−)) as control. Hepatic stellate cell (HSC) population was analyzed by α-SMA (x-axis) and side scatter (y-axis). (b) Percentages of activated HSCs with high expression of α-SMA cultured with various bile acids were measured using flow cytometry. Data are expressed as the mean ± SD of 5–7 separate experiments. 1-C, primary conjugated BAs; 1-U, primary unconjugated BAs; 2-C, secondary conjugated BAs; 2-U, secondary unconjugated BAs. (c) Percentages of activated HSCs averaged per BA treatment group. Data are expressed as the mean ± SD. Comparisons of different LX-2 cell treatments were carried out using one-way analysis of variance followed by Bonferroni’s correction (** p < 0.01).

Similar articles

Cited by

References

    1. Gressner O.A., Weiskirchen R., Gressner A.M. Biomarkers of hepatic fibrosis, fibrogenesis and genetic pre-disposition pending between fiction and reality. J. Cell. Mol. Med. 2007;11:1031–1051. doi: 10.1111/j.1582-4934.2007.00092.x. - DOI - PMC - PubMed
    1. Geerts A. History, heterogeneity, developmental biology, and functions of quiescent hepatic stellate cells. Semin. Liver Dis. 2001;21:311–335. doi: 10.1055/s-2001-17550. - DOI - PubMed
    1. Yin C., Evason K.J., Asahina K., Stainier D.Y. Hepatic stellate cells in liver development, regeneration, and cancer. J. Clin. Investig. 2013;123:1902–1910. doi: 10.1172/JCI66369. - DOI - PMC - PubMed
    1. Friedman S.L. Molecular mechanisms of hepatic fibrosis and principles of therapy. J. Gastroenterol. 1997;32:424–430. doi: 10.1007/BF02934504. - DOI - PubMed
    1. Hanaoka J., Shimada M., Utsunomiya T., Morine Y., Imura S., Ikemoto T., Mori H. Significance of sonic hedgehog signaling after massive hepatectomy in a rat. Surg. Today. 2013;43:300–307. doi: 10.1007/s00595-012-0248-z. - DOI - PubMed

MeSH terms

LinkOut - more resources