. 2018 Nov 21;38(47):10202-10219.
doi: 10.1523/JNEUROSCI.1163-18.2018. Epub 2018 Oct 9.

A Multicomponent Neuronal Response Encodes the Larval Decision to Pupariate upon Amino Acid Starvation

Affiliations

A Multicomponent Neuronal Response Encodes the Larval Decision to Pupariate upon Amino Acid Starvation

Siddharth Jayakumar et al. J Neurosci. .

Erratum in

Abstract

Organisms need to coordinate growth with development, particularly in the context of nutrient availability. Thus, multiple ways have evolved to survive extrinsic nutrient deprivation during development. In Drosophila, growth occurs during larval development. Larvae are thus critically dependent on nutritional inputs; but after critical weight, they pupariate even when starved. How nutrient availability is coupled to the internal metabolic state for the decision to pupariate needs better understanding. We had earlier identified glutamatergic interneurons in the ventral ganglion that regulate pupariation on a protein-deficient diet. Here we report that Drosophila third instar larvae (either sex) sense arginine to evaluate their nutrient environment using an amino acid transporter Slimfast. The glutamatergic interneurons integrate external protein availability with internal metabolic state through neuropeptide signals. IP3-mediated calcium release and store-operated calcium entry are essential in these glutamatergic neurons for such integration and alter neuronal function by reducing the expression of multiple ion channels.SIGNIFICANCE STATEMENT Coordinating growth with development, in the context of nutrient availability is a challenge for all organisms in nature. After attainment of "critical weight," insect larvae can pupariate, even in the absence of nutrition. Mechanism(s) that stimulate appropriate cellular responses and allow normal development on a nutritionally deficient diet remain to be understood. Here, we demonstrate that nutritional deprivation, in postcritical weight larvae, is sensed by special sensory neurons through an amino acid transporter that detects loss of environmental arginine. This information is integrated by glutamatergic interneurons with the internal metabolic state through neuropeptide signals. These glutamatergic interneurons require calcium-signaling-regulated expression of a host of neuronal channels to generate complex calcium signals essential for pupariation on a protein-deficient diet.

Keywords: Drosophila; SOCE; glutamatergic neurons; nutrient-sensing.


Figures

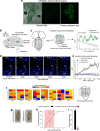
Figure 1.
Figure 1.
Glutamatergic neurons in larval VG respond to acute amino acid deprivation. a, Confocal images from the whole CNS of third instar larval brains where UAS-CaLexA has been driven using VGN6341-GAL4 on a PDD for 12 h. Scale bar, 50 μm. b, Schematic of the preparation used to observe calcium transients in VGN6341-GAL4-marked glutamatergic neurons upon amino acid withdrawal. For details, see Materials and Methods. c, Schematic depicting how cells from T3–A5 are imaged with a sample response of cells classified as responders and nonresponders. d, Images of a sample VG across different times after withdrawal of amino acids. Arrowheads indicate responder cells. e, Line plots of calcium transients observed in glutamatergic neurons marked by VGN6341-GAL4 when EAAs were withdrawn from CNSs of corresponding age. Red dot indicates the point of withdrawal of amino acids. The transients are from cells that responded and crossed an arbitrary threshold of a minimum change (ΔF/F) of 1.5 after withdrawal as described in Materials and Methods. f, Heatmaps showing distribution of percentage responders in segments T3–A5 from control CNS preps in response to withdrawal of EAA. Right, Diagram represents average responders (±SEM) from each hemisegment. g, Representative pictures of puparia when either glutamatergic neurons marked by VGN6341-GAL4 or a control genotype were optogenetically activated on ND. h, i, Rate of pupariation and percentage adults, respectively, on ND, when glutamatergic neurons marked by VGN6341-GAL4 were optogenetically activated for 2 d after 84 ± 2 h AEL. Pupariation at day 1 was significantly different with p = 1.14 × 10−07 and at day 2, p = 5.98 × 10−05, using two-tailed Student's t test. i, Percentage adults was significantly lower with p = 6.68 × 10⁻²⁰, using two-tailed Student's t test. Bars with the same alphabet represent statistically indistinguishable groups. Exact p values are provided in Figure 1-1.
Figure 2.
Figure 2.
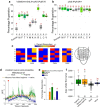
SOCE in larval glutamatergic neurons is important for pupariation under amino acid deprivation. a, Box plots represent percentage pupariation on PDD of the indicated genotypes where intracellular calcium signaling was perturbed in glutamatergic neurons. One-way ANOVA: F(5,30) = 652.2215, p < 0.05; with post hoc Tukey's Multiple Comparison Test (MCT). b, Line plots of calcium transients observed in glutamatergic neurons marked by VGN6341-GAL4 when EAAs were withdrawn from CNS of indicated genotypes. Red dot indicates the point of withdrawal of EAA. The transients are from cells that responded above an arbitrary threshold of ΔF/F ≥ 1.5 after withdrawal, as described in Materials and Methods. The control genotype trace is from the same experiments as shown in Figure 1e. c, d, Percent responders, one-way ANOVA: F(6,31) = 16.1339, p < 0.05; with post hoc Tukey's MCT and (d) area under the curve from the line plots shown in Figure 1e and 2b, one-way ANOVA: F(6,255) = 9.25345, p < 0.05; with post hoc Tukey's MCT. e, Images showing the location of larvae of the indicated genotypes at the indicated time points in either absence or presence of white light. f, Bars represent percentage “freezing behavior” upon exposure to light from the indicated genotypes. Bars and boxes with the same alphabet represent statistically indistinguishable groups. Exact p values are provided in Figure 1-1.
Figure 3.
Figure 3.
Arginine is critical amino acid for pupariation. a, b, Percentage pupariation of the indicated genotypes on PDD upon supplementation with indicated specific amino acids. Numbers indicate batches of 25 larvae each. One-way ANOVA: F(11,60) = 78.45015, p < 0.05; with post hoc Tukey's MCT for a and one-way ANOVA: F(11,58) = 0.73875, p = 0.697; with post hoc Tukey's MCT for b. c, Heat maps showing the distribution of percentage of cells that responded to withdrawal of arginine in segments T3–A5 from five control CNS preparations. Right, Diagram represents the mean and SEM of number of responding cells in each indicated hemisegment as calculated from the five CNS preparations. d, Line plots of calcium transients in responding CNS cells observed upon withdrawal of arginine, a mixture of EAAs lacking arginine, a mixture of non-EAAs or no withdrawal (mock-withdrawal). The mock-withdrawal trace is from all cells as none of them crossed the threshold. e, f, Percent responders and area under the curve quantified from the line plots shown in d. One-way ANOVA: F(3,14) = 16.0049, p < 0.05; with post hoc Tukey's MCT for e and one-way ANOVA: F(3,146) = 14.00764, p < 0.05; with post hoc Tukey's MCT for f. Bars and boxes with the same alphabet represent statistically indistinguishable groups. Exact p values are provided in Figure 1-1.
Figure 4.
Figure 4.
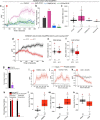
Withdrawal of amino acid in the media can induce glutamatergic neuron-dependent peptide release. a, Line plots of peptide release from mNSCs marked by dimm-LexA. Peptide release was measured by decrease in fluorescence of the atrial natriuretic factor linked to GFP (ANF::GFP) following withdrawal of arginine from CNS with and without optical inhibition of glutamatergic neurons with eNpHR2. Blue dot indicates the point of withdrawal of arginine. Green line indicates the duration of inhibition by eNpHR2. b, c, Box plots represent area under the curves quantified from the peptide release response of mNSCs (b) and non-mNSC peptidergic cells (c). The release was found to be significantly lower during inhibition from the mNSC in b (p = 0.00525, two-tailed Student's t test), whereas the release from the non-mNSC (c) cells was not (p = 0.13651, two-tailed Student's t test). All data are from a minimum of four CNSs of the individual genotypes. d, Percentage pupariation of the indicated genotypes on indicated diets concurrent with a temperature shift from permissive (18°C) to restrictive temperature (29°C), thereby blocking peptide release on PDD. Two-way ANOVA: F(3,21) = 41.09651, p < 0.05; with post hoc Tukey's MCT. e, Line plot showing peptide release from PTTH-GAL4-marked cells assayed by expression of the ANF::GFP construct and measured upon stimulation with 50 μm carbachol. f, Box plots represent release as estimated by area under the curves for either mNSCs or from PTTH cells (p = 0.02858, two-tailed Student's t test). The mNSC data are the same as in Jayakumar et al. (2016; their Fig. 6a). Bars and boxes with the same alphabet represent statistically indistinguishable groups. Exact p values are provided in Figure 1-1.
Figure 5.
Figure 5.
Neuropeptides modulate calcium transients and pupariation during protein deprivation. a, Line plots of calcium transients from larval CNSs observed in VGN6341-GAL4-marked glutamatergic neurons upon withdrawal of EAA in animals with the indicated neuropeptide receptor knockdowns. Red dot indicates the point of withdrawal of EAA. The transients are from cells that responded above an arbitrary threshold of ΔF/F ≥ 1.5 after withdrawal, as described in Materials and Methods. The control genotype trace is from the same experiments as shown in Figure 2b. b, Bars represent percentage of cells that responded to EAA withdrawal above the threshold from the indicated genotypes as shown in a. One-way ANOVA: F(3,19) = 212.26, p < 0.05; with post hoc Tukey's MCT. c, Box plots represent area under the curve from the graph in a. One-way ANOVA: F(3,225) = 9.32574, p < 0.05; with post hoc Tukey's MCT. d, Line plots of calcium transients from larval CNS observed in VGN6341-GAL4-marked glutamatergic neurons upon withdrawal of EAA in animals upon blocking peptide release either at restrictive (31°C) or permissive (22°C) temperatures. Red dot indicates the point of withdrawal of EAA. The transients are from cells that responded above an arbitrary threshold of ΔF/F ≥ 1.5 after withdrawal, as described in Materials and Methods. e, f, Box plots represent area under the curve from the graph in d, for the initial phase (60–300 s) were not significant (p = 0.15686, two-tailed Student's t test) but were significant in the later phase (300–600 s) (p = 4.30 × 10−06, two-tailed Student's t test). g, Bars represent percentage pupariation observed when CCHa2 knockdown was performed in the fat body (p = 3.69 × 10−05, two-tailed Student's t test). h, Bars represent percentage pupariation observed when FMRFa release is either permitted (p = 0.35576, two-tailed Student's t test) or inhibited from the CNS under conditions of nutrient deprivation (p = 3.75 × 10−08, two-tailed Student's t test). i–k, Line plots of calcium transients observed upon addition of 5 μm of the corresponding neuropeptide. Open red circles represent the point of addition of neuropeptide. Percent cells that responded are indicated on top of the graphs. For AstA, all cells were below the threshold. The mock trace was obtained from all cells, and the same trace is shown in the three graphs. All data are from a minimum of five CNSs of the individual genotypes. l–n, Box plots represent area under the curve from graphs in i, j, and k, respectively, with p = 3.41228 × 10−05 (l), p = 0.000527221 (m), and p = 0.000535367 (n) (two-tailed Student's t test). Boxes and bars with the same alphabet represent statistically indistinguishable groups. Exact p values are provided in Figure 1-1.
Figure 6.
Figure 6.
slif in ppk neurons senses arginine as a proxy for nutritional quality. a, Line plots represent calcium transients observed from VGN6341-GAL4-marked glutamatergic neurons upon withdrawal of EAA from CNS with and without application of 2 μm TTX. Responses from all cells upon TTX application have been plotted. The control data are the same as used in Figure 2b. b, c, Line plots of calcium transients from glutamatergic neurons observed upon withdrawal of EAA when inputs from ppk-GAL4-marked sensory neurons were inhibited either concurrent with withdrawal (b) or after withdrawal (c). Red dot indicates the point of withdrawal of EAA. Green line on top of the graph indicates duration of inhibition. The transients are from all cells in b and from the responding cells (∼55%) in c. Responding cells were classified by an arbitrary threshold of ΔF/F ≥1.5 after withdrawal, as described in Materials and Methods. All data are from a minimum of five CNSs of the individual genotypes and each at least 57 cells. d, Line plots of calcium transients from glutamatergic neurons observed upon activating ppk neurons in either second (68 ± 2 h AEL) or third instar larvae (84 ± 2 h AEL). Blue line on top of the graph indicates duration of activation. e, Bars represent fold change in mRNA levels of slif normalized to rp49 in the indicated genotypes (p = 0.021, two-tailed Student's t test). f, Bars represent percentage pupariation in the indicated genotypes, one-way ANOVA: F(2,19) = 390.6136, p < 0.05; with post hoc Tukey's MCT. g, Line plots represent calcium transients observed in ppk neurons upon withdrawal of EAA from semi-intact preparations. Red dot indicates the point of withdrawal of EAA. The transients shown are from all cells. h, Line plots represent calcium transients observed upon withdrawal of arginine from semi-intact preparations in control as well as knockdown of slif using ppk-GAL4. Blue dot indicates the point of withdrawal of arginine. The transients shown are from all cells. i, Representative images from the preference assay at the indicated times in control animals (slif IR/+) and animals with slif knockdown in ppk-GAL4-expressing sensory neurons. j, k, Box plots of the preference index calculated either at the end of 10 min in animals of the indicated genotypes (p = 0.000105775, two-tailed Student's t test; j) or during and after real-time optical inhibition of ppk-GAL4 neurons expressing eNpHR3 (p = 1.6009 × 10−05, two-tailed Student's t test; k), where the numbers indicate the number of batches of 20 larvae that were tested. Bars and boxes with the same alphabet represent statistically indistinguishable groups. Exact p values are provided in Figure 1-1.
Figure 7.
Figure 7.
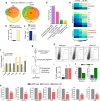
Intracellular calcium signaling through IP3R/SOCE in glutamatergic neurons regulates expression of genes encoding ion channels. a, Venn diagrams representing the number of genes identified as differentially expressed by three independent, indicated methods. IP3R knockdown majorly leads to downregulation of a set of genes. For list of genes, refer to Figure 7-1. b, Bars represent the number of genes upregulated or downregulated upon knockdown of the IP3R in the CNS as measured by RNA-seq. c, Bars represent the expression levels of IP3R in the indicated conditions. q value refers to the corrected p value obtained from CuffDiff. d, Bars represent the fold enrichment in the number of genes of the indicated GO molecular function categories in the set of genes downregulated upon IP3R knockdown, compared with all genes in Drosophila. Numbers on top of the bars indicate FDR corrected p values. This analysis was performed using the Panther GO Slim Molecular Function option. e, Heatmap indicates the fragments per kilobase per million (FPKM) values as a proxy for expression level of the indicated cation channel genes in control (UAS-IP3R IR/+; UAS-dicer2/+) and IP3R knockdown (elavC155-GAL4>UAS-IP3R IR; UAS-dicer2) conditions. Red labels indicate genes whose expression is significantly altered by IP3R knockdown identified by all three methods (CuffDiff, DESeq, and edgeR). Pink labels indicate differential gene expression significant by any two methods. Gray labels indicate differential expression of genes that are not significant. f, Bars represent the fold change in expression levels of the indicated genes normalized to rp49 measured by qRT-PCR from CNSs of second instar larvae to that of third instar (p = 0.019984 for cac, two-tailed Student's t test). g, Diagram representation of the procedure used to sort glutamatergic neurons of interest. h, Representative dot plots of flow cytometric analysis of cell suspensions made from the indicated genotypes. x axis indicates the extent of fluorescence; y axis indicates a measure of granularity based on the side-scatter. Threshold was set using the nonfluorescent WT and pink dots were collected as GFP-positive cells. i, Bars represent the percentage of GFP-positive glutamatergic cells obtained by FACS from the indicated genotypes. One-way ANOVA: F(2,9) = 24.3, p < 0.05; with post hoc Tukey's MCT. Bars with the same alphabet represent statistically indistinguishable groups. j, Comparison of the levels of VGlut in whole CNS versus sorted glutamatergic neurons compared with the housekeeping gene, rp49. VGlut expression is enriched in the sorted glutamatergic neurons. k, Bars represent the fold change in expression levels of the indicated genes normalized to Act5c measured by qRT-PCR from sorted glutamatergic cells of the control (VGN6341-GAL4>UAS-eGFP) and dStim KD (VGN6341-GAL4>UAS-eGFP; UAS-dStim IR; dcr2) genotypes; p = 0.012 (dStim), p = 0.003 (mAChR), p = 0.023 (NaCP60E), p = 0.040 (Hk), p = 0.040 (eag), p = 0.077 (cac), p = 0.008 (Ca-α1D). RNA was isolated from ∼1200 sorted neurons and amplified using the SMART-seq method before performing qRT-PCR. *p < 0.1 (two-tailed t test). **p < 0.05 (two-tailed t test). ***p < 0.01 (two-tailed t test). Exact p values are provided in Figure 1-1.
Figure 8.
Figure 8.
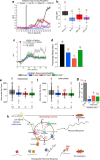
IP3R/SOCE in glutamatergic neurons regulates neuronal excitability. a, Line plots represent calcium transients observed upon depolarization by KCl in VGN6341-GAL4-marked glutamatergic neurons from CNS of the indicated genotypes. Gray box represents the window of addition of KCl. Responses from all cells have been plotted. b, Box plots indicate the peak change in fluorescence from traces in a. One-way ANOVA: F(3,80) = 13.44943, p < 0.05; with post hoc Tukey's MCT. c, Line plots indicate calcium transients observed upon withdrawal of EAAs in control CNS and in CNS with expression of the indicated toxins in VGN6341-GAL4-marked glutamatergic neurons. Red dot indicates the point of withdrawal of EAA. The transients are from cells that responded above an arbitrary threshold of ΔF/F ≥ 1.5 after withdrawal, as described in Materials and Methods. Data are from a minimum of five CNSs of the individual genotypes. Control trace is the same as in Figure 2b. d, Percent responders from the trace in c, one-way ANOVA: F(3,23) = 30.58001, p < 0.05; with post hoc Tukey's MCT. e, f, Area under the curve quantified from the trace in Figure 8c for the initial phase from 60 to 300 s, one-way ANOVA: F(3,243) = 0.28392, p < 0.05; with post hoc Tukey's MCT (e) and the later phase from 300 to 600 s, one-way ANOVA: F(3,243) = 5.04391, p < 0.05; with post hoc Tukey's MCT (f). g, Bar graphs represent percentage pupariation of the indicated genotypes on an amino acid-deficient diet, one-way ANOVA: F(3,12) = 120.0924, p < 0.05; with post hoc Tukey's MCT. Boxes and bars with the same alphabet represent statistically indistinguishable groups. h, Schematic summarizing cholinergic activation (mAChR) and peptidergic modulation (FMRFaR, CCHa2R, and AstAR) of glutamatergic neurons required for pupariation on a PPD. GPCRs stimulate calcium release through the IP3R followed by SOCE in glutamatergic neurons. The intracellular calcium signaling regulates expression of genes encoding several ion channels as well as the mAChR. Activation of intracellular calcium signaling mechanisms and ion channels stimulates a complex calcium response across glutamatergic neurons upon amino acid withdrawal. The neuronal response is necessary for pupariation on the PPD. Exact p values are provided in Figure 1-1.

Similar articles

Cited by

References

    1. Aberle H, Haghighi AP, Fetter RD, McCabe BD, Magalhães TR, Goodman CS (2002) Wishful thinking encodes a BMP type II receptor that regulates synaptic growth in Drosophila. Neuron 33:545–558. 10.1016/S0896-6273(02)00589-5 - DOI - PubMed
    1. Agrawal T, Sadaf S, Hasan G (2013) A genetic RNAi screen for IP3/Ca2+ coupled GPCRs in Drosophila identifies the PdfR as a regulator of insect flight. PLoS Genet 9:e1003849. 10.1371/journal.pgen.1003849 - DOI - PMC - PubMed
    1. Anders S, Huber W (2010) Differential expression analysis for sequence count data. Genome Biol 11:R106. 10.1186/gb-2010-11-10-r106 - DOI - PMC - PubMed
    1. Auvinen M, Paasinen A, Andersson LC, Hölttä E (1992) Ornithine decarboxylase activity is critical for cell transformation. Nature 360:355–358. 10.1038/360355a0 - DOI - PubMed
    1. Baines RA, Uhler JP, Thompson A, Sweeney ST, Bate M (2001) Altered electrical properties in Drosophila neurons developing without synaptic transmission. J Neurosci 21:1523–1531. 10.1523/JNEUROSCI.21-05-01523.2001 - DOI - PMC - PubMed

Publication types