The Streptococcus pyogenes Shr protein captures human hemoglobin using two structurally unique binding domains
- PMID: 30301765
- PMCID: PMC6254355
- DOI: 10.1074/jbc.RA118.005261
The Streptococcus pyogenes Shr protein captures human hemoglobin using two structurally unique binding domains
Abstract
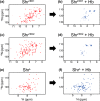
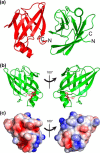
In order to proliferate and mount an infection, many bacterial pathogens need to acquire iron from their host. The most abundant iron source in the body is the oxygen transporter hemoglobin (Hb). Streptococcus pyogenes, a potentially lethal human pathogen, uses the Shr protein to capture Hb on the cell surface. Shr is an important virulence factor, yet the mechanism by which it captures Hb and acquires its heme is not well-understood. Here, we show using NMR and biochemical methods that Shr binds Hb using two related modules that were previously defined as domains of unknown function (DUF1533). These hemoglobin-interacting domains (HIDs), called HID1 and HID2, are autonomously folded and independently bind Hb. The 1.5 Å resolution crystal structure of HID2 revealed that it is a structurally unique Hb-binding domain. Mutagenesis studies revealed a conserved tyrosine in both HIDs that is essential for Hb binding. Our biochemical studies indicate that HID2 binds Hb with higher affinity than HID1 and that the Hb tetramer is engaged by two Shr receptors. NMR studies reveal the presence of a third autonomously folded domain between HID2 and a heme-binding NEAT1 domain, suggesting that this linker domain may position NEAT1 near Hb for heme capture.
Keywords: DUF1533; Shr; Streptococcus pyogenes (S. pyogenes); X-ray crystallography; bacterial pathogen; hemoglobin; isothermal titration calorimetry (ITC); nuclear magnetic resonance (NMR); receptor.
© 2018 Macdonald et al.
Conflict of interest statement
The authors declare that they have no conflicts of interest with the contents of this article
Figures


Similar articles
-
Structural basis for the recognition of human hemoglobin by the heme-acquisition protein Shr from Streptococcus pyogenes.Sci Rep. 2024 Mar 5;14(1):5374. doi: 10.1038/s41598-024-55734-x. Sci Rep. 2024. PMID: 38438508 Free PMC article.
-
The Shr receptor from Streptococcus pyogenes uses a cap and release mechanism to acquire heme-iron from human hemoglobin.Proc Natl Acad Sci U S A. 2023 Jan 31;120(5):e2211939120. doi: 10.1073/pnas.2211939120. Epub 2023 Jan 24. Proc Natl Acad Sci U S A. 2023. PMID: 36693107 Free PMC article.
-
Kinetics of heme transfer by the Shr NEAT domains of Group A Streptococcus.Arch Biochem Biophys. 2013 Oct 15;538(2):71-9. doi: 10.1016/j.abb.2013.08.009. Epub 2013 Aug 28. Arch Biochem Biophys. 2013. PMID: 23993953
-
Proteolysis and its regulation at the surface of Streptococcus pyogenes.Mol Microbiol. 2002 Feb;43(3):537-44. doi: 10.1046/j.1365-2958.2002.02766.x. Mol Microbiol. 2002. PMID: 11929513 Review.
-
Streptococcal Collagen-like Protein 1 Binds Wound Fibronectin: Implications in Pathogen Targeting.Curr Med Chem. 2019;26(11):1933-1945. doi: 10.2174/0929867325666180831165704. Curr Med Chem. 2019. PMID: 30182848 Review.
Cited by
-
Native Human Antibody to Shr Promotes Mice Survival After Intraperitoneal Challenge With Invasive Group A Streptococcus.J Infect Dis. 2021 Apr 23;223(8):1367-1375. doi: 10.1093/infdis/jiaa540. J Infect Dis. 2021. PMID: 32845315 Free PMC article.
-
Pirates of the haemoglobin.Microb Cell. 2022 Feb 18;9(4):84-102. doi: 10.15698/mic2022.04.775. eCollection 2022 Apr 4. Microb Cell. 2022. PMID: 35434122 Free PMC article. Review.
-
Structural basis for the recognition of human hemoglobin by the heme-acquisition protein Shr from Streptococcus pyogenes.Sci Rep. 2024 Mar 5;14(1):5374. doi: 10.1038/s41598-024-55734-x. Sci Rep. 2024. PMID: 38438508 Free PMC article.
-
Structure and role of the linker domain of the iron surface-determinant protein IsdH in heme transportation in Staphylococcus aureus.J Biol Chem. 2022 Jun;298(6):101995. doi: 10.1016/j.jbc.2022.101995. Epub 2022 Apr 29. J Biol Chem. 2022. PMID: 35500652 Free PMC article.
-
The Corynebacterium diphtheriae HbpA Hemoglobin-Binding Protein Contains a Domain That Is Critical for Hemoprotein Binding, Cellular Localization, and Function.J Bacteriol. 2021 Oct 12;203(21):e0019621. doi: 10.1128/JB.00196-21. Epub 2021 Aug 9. J Bacteriol. 2021. PMID: 34370560 Free PMC article.
References
-
- Carapetis J. R., Steer A. C., Mulholland E. K., and Weber M. (2005) The global burden of group A streptococcal diseases. Lancet Infect. Dis. 5, 685–694 - PubMed
-
- Ralph A. P., and Carapetis J. R. (2013) Group A streptococcal diseases and their global burden. Curr. Top. Microbiol. Immunol. 368, 1–27 - PubMed
Publication types
MeSH terms
Substances
Associated data
- Actions
- Actions

