. 2018 Oct 23;115(43):E10069-E10078.
doi: 10.1073/pnas.1811892115. Epub 2018 Oct 9.

mTOR inhibitors lower an intrinsic barrier to virus infection mediated by IFITM3

Affiliations

mTOR inhibitors lower an intrinsic barrier to virus infection mediated by IFITM3

Guoli Shi et al. Proc Natl Acad Sci U S A. .

Abstract

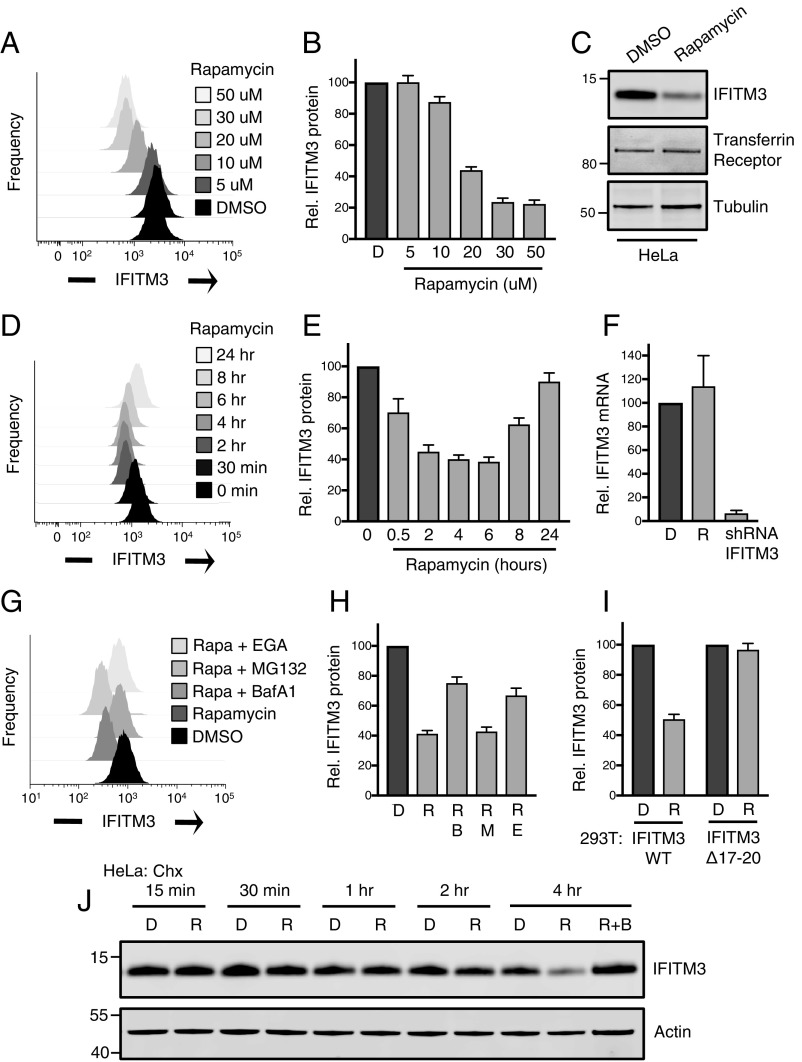
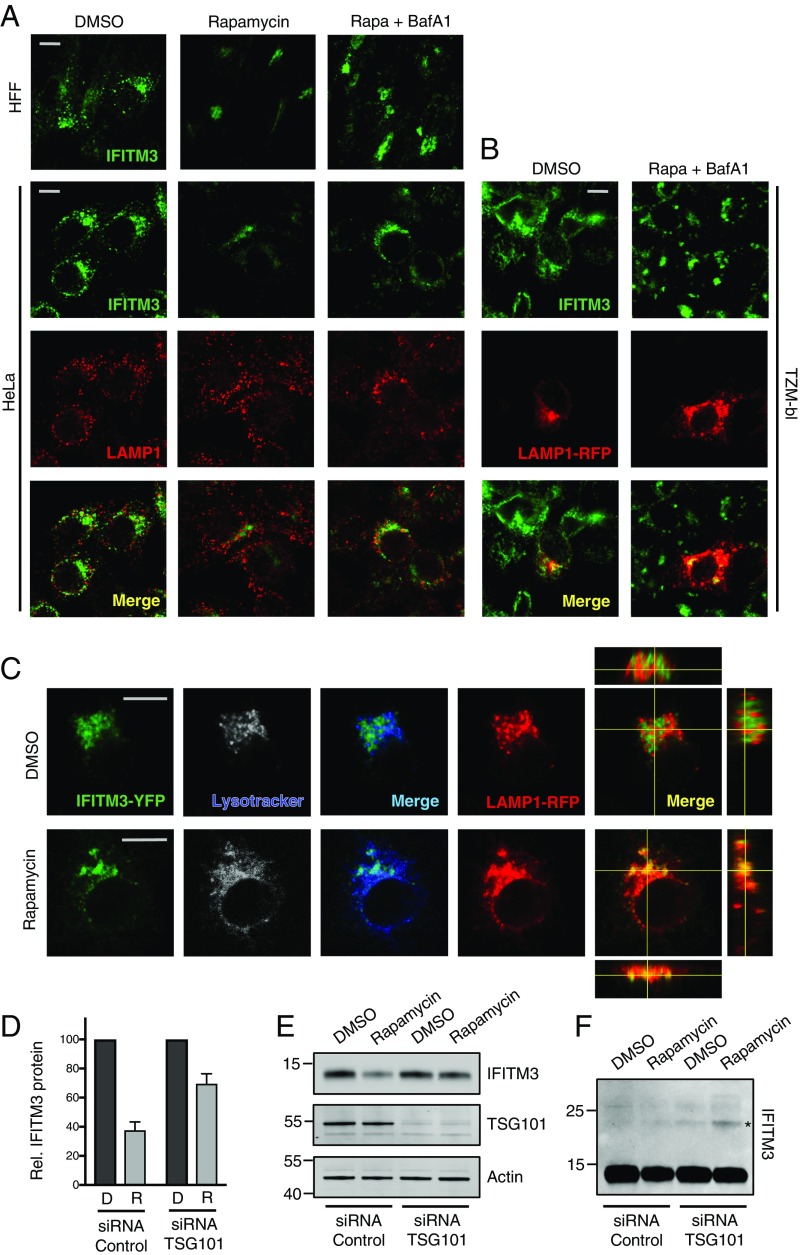
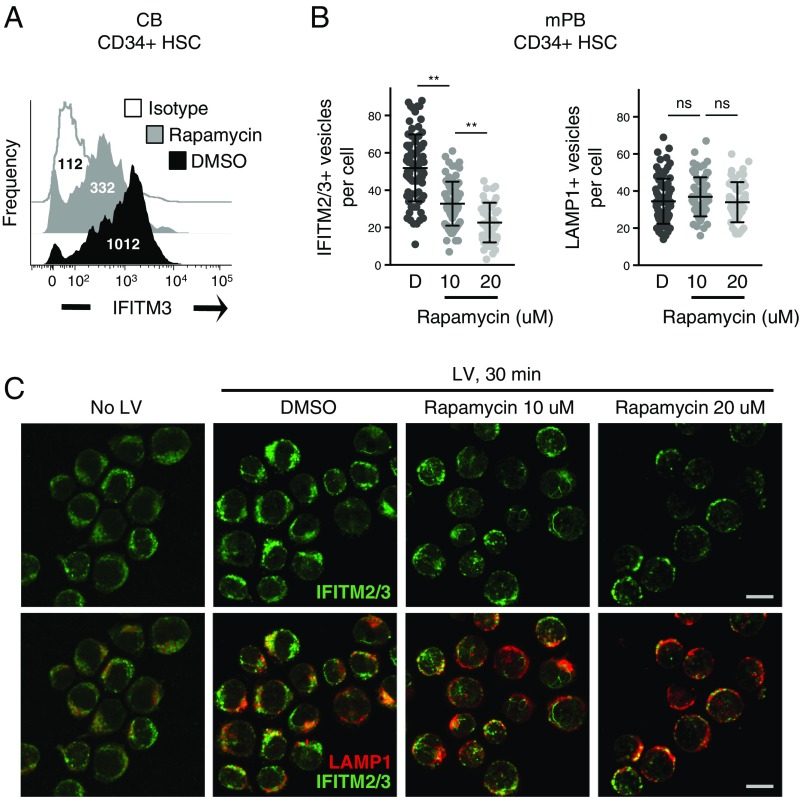
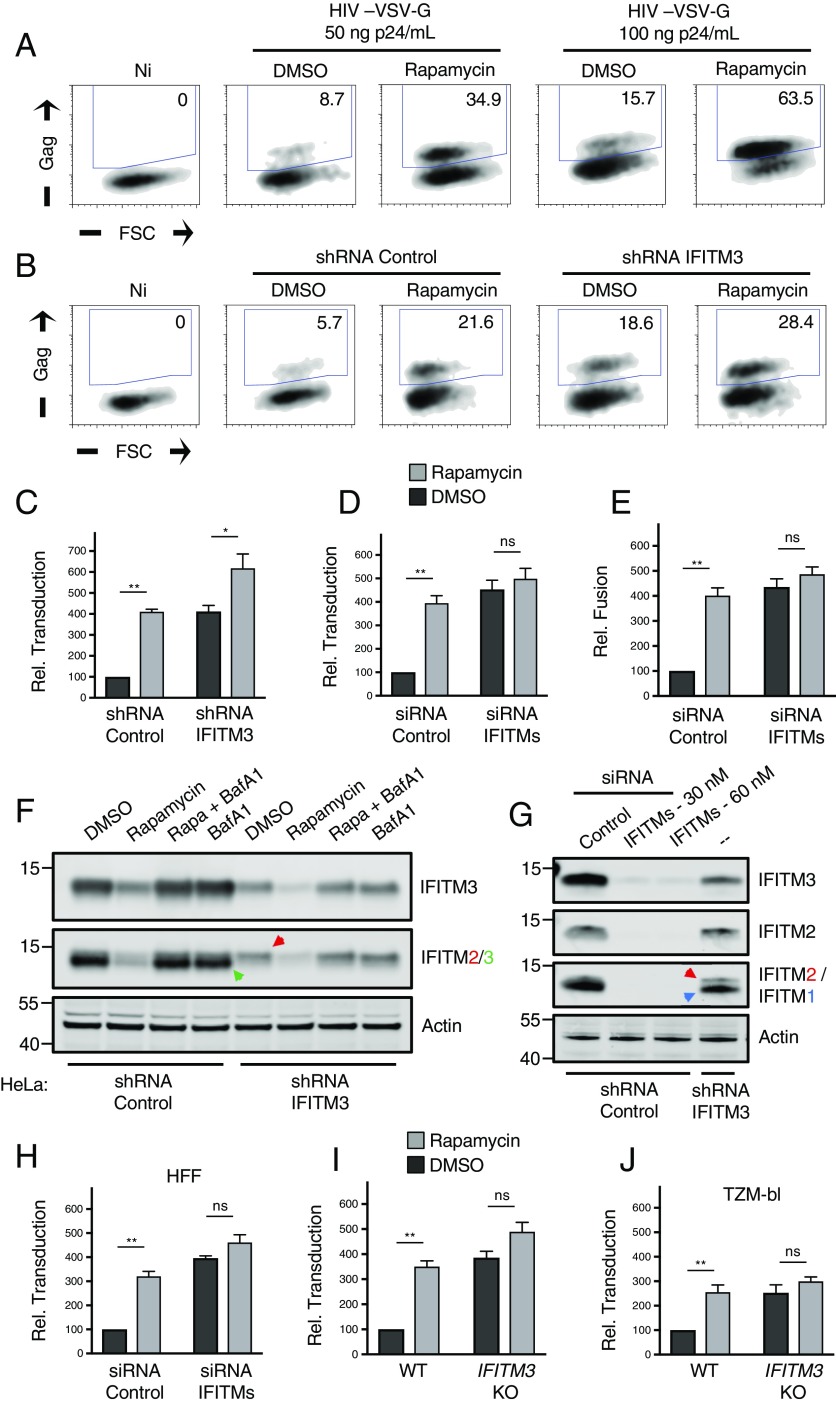
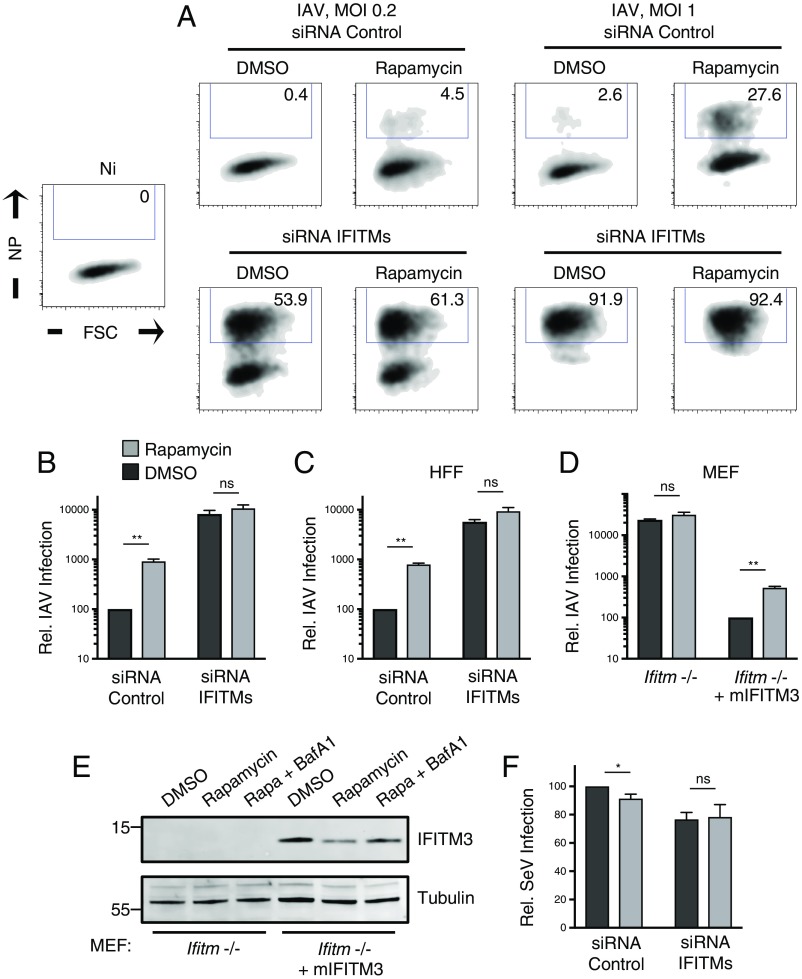
Rapamycin and its derivatives are specific inhibitors of mammalian target of rapamycin (mTOR) kinase and, as a result, are well-established immunosuppressants and antitumorigenic agents. Additionally, this class of drug promotes gene delivery by facilitating lentiviral vector entry into cells, revealing its potential to improve gene therapy efforts. However, the precise mechanism was unknown. Here, we report that mTOR inhibitor treatment results in down-regulation of the IFN-induced transmembrane (IFITM) proteins. IFITM proteins, especially IFITM3, are potent inhibitors of virus-cell fusion and are broadly active against a range of pathogenic viruses. We found that the effect of rapamycin treatment on lentiviral transduction is diminished upon IFITM silencing or knockout in primary and transformed cells, and the extent of transduction enhancement depends on basal expression of IFITM proteins, with a major contribution from IFITM3. The effect of rapamycin treatment on IFITM3 manifests at the level of protein, but not mRNA, and is selective, as many other endosome-associated transmembrane proteins are unaffected. Rapamycin-mediated degradation of IFITM3 requires endosomal trafficking, ubiquitination, endosomal sorting complex required for transport (ESCRT) machinery, and lysosomal acidification. Since IFITM proteins exhibit broad antiviral activity, we show that mTOR inhibition also promotes infection by another IFITM-sensitive virus, Influenza A virus, but not infection by Sendai virus, which is IFITM-resistant. Our results identify the molecular basis by which mTOR inhibitors enhance virus entry into cells and reveal a previously unrecognized immunosuppressive feature of these clinically important drugs. In addition, this study uncovers a functional convergence between the mTOR pathway and IFITM proteins at endolysosomal membranes.

Keywords: IFITM; endosome; fusion; interferon; virus.


Conflict of interest statement

The authors declare no conflict of interest.

Figures

Fig. 1.
Fig. 1.
Endogenous IFITM3 is down-regulated by rapamycin via a lysosomal degradation pathway. (A) HeLa cells were treated with indicated concentrations of DMSO or rapamycin for 4 h followed by fixation/permeabilization, immunostaining with anti-IFITM3, and analysis by flow cytometry. Univariate histograms of IFITM3 staining intensity were overlaid. (B) The mean fluorescence intensities (MFIs) from histograms in A were normalized as percentage relative to DMSO and averaged. (C) SDS/PAGE and Western blot analysis of whole cell lysates produced from HeLa treated with DMSO or 20 μM rapamycin followed by immunoblotting with anti-IFITM3. Tubulin and transferrin receptor were used as loading controls. (D) HeLa cells were treated with 20 μM rapamycin for durations indicated and immunostained with anti-IFITM3. (E) The MFIs from histograms in D were normalized and averaged. (F) HeLa cells were treated with rapamycin (20 μM) for 4 h, and total cDNA was synthesized from extracted RNA. Quantitative PCR was performed using IFITM3-specific primers. RNA from HeLa stably expressing IFITM3-specific shRNA was used as a negative control. (G) HeLa cells were treated with DMSO, rapamycin (20 μM) alone, or a combination of rapamycin and bafilomycin A1 (1 μM), MG132 (10 μM), or 4-bromobenzaldehyde N-(2,6-dimethylphenyl)semicarbazone (10 μM) for 4 h followed by immunostaining with anti-IFITM3. (H) The MFIs from histograms in G were normalized and averaged. (I) The 293T cells were transfected with pQCXIP-FLAG-IFITM3 or -IFITM3 Δ17-20, and stable expression was achieved following puromycin selection. Cells were treated with DMSO or rapamycin (20 μM) for 4 h followed by immunostaining with anti-IFITM3. MFIs were normalized and averaged. (J) SDS/PAGE and Western blot analysis of whole cell lysates produced from HeLa cells treated with 100 μg/mL cycloheximide and DMSO or rapamycin (20 μM) for the durations indicated; combined rapamycin and bafilomycin A1 (1 μM) were included for the 4-h time point. Immunoblotting was performed with anti-IFITM3. Actin was used as a loading control. Numbers and tick marks indicate size (kilodaltons) and position of protein standards in ladder. All error bars indicate SE from three to five experiments. B, bafilomycin A1; Chx, cycloheximide; D, DMSO; E, EGA; M, MG132; R, rapamycin.
Fig. 2.
Fig. 2.
IFITM3 degradation following rapamycin treatment requires ESCRT-dependent trafficking through the endocytic pathway. (A) HFFs and HeLa cells were treated with DMSO or rapamycin (Rapa) (20 μM) or rapamycin plus bafilomycin A1 (BafA1) (1 μM) for 4 h followed by fixation/permeabilization, immunostaining with anti-IFITM3 and anti-LAMP1, and analysis by immunofluorescence confocal microscopy. (B) TZM-bl cells were transfected with LAMP1-RFP for 24 h and treated with DMSO or rapamycin (20 μM) or rapamycin plus bafilomycin A1 (1 μM) for 4 h followed by fixation/permeabilization, immunostaining with anti-IFITM3, and analysis by immunofluorescence confocal microscopy. (C) HeLa cells stably expressing IFITM3-YFP were transfected with LAMP1-RFP for 24 h. Cells were stained with Lysotracker Deep Red (50 nM) for 15 min, and living cells were imaged immediately by immunofluorescence confocal microscopy. Image analysis was performed using ImageJ (Fiji). Merged images are provided for IFITM3-YFP/Lysotracker (green/blue) and for IFITM3-YFP/LAMP1-RFP (green/red), and orthogonal XZ and YZ views are provided for the latter (C). All images are average Z-stacks from three to four consecutive medial sections. (D) HeLa cells were transfected with indicated siRNA for 72 h, treated with DMSO or rapamycin (20 μM) for 4 h, and then fixed/permeabilized, immunostained with anti-IFITM3, and analyzed by flow cytometry. MFIs from histograms were normalized and averaged. Error bars indicate SE from four experiments. (E) SDS/PAGE and Western blot analysis of whole cell lysates from HeLa transfected with indicated siRNA for 72 h and treated with DMSO or rapamycin (20 μM). Immunoblotting was performed with anti-IFITM3 and anti-TSG101. Actin was used as a loading control. The image provided is representative of two experiments. (F) Immunoblot with anti-IFITM3 in E was enhanced to reveal bands of higher molecular mass (marked with asterisk). (Scale bars: 10 μm.)
Fig. 3.
Fig. 3.
Rapamycin treatment of CD34+ HSPCs results in IFITM2/3 down-regulation. (A) CD34+ HSPCs derived from cord blood from nine donors were pooled, fixed/permeabilized, immunostained with anti-IFITM3, and analyzed by flow cytometry. Univariate histograms of IFITM3 expression are shown, with the median fluorescence intensity indicated. (B) CD34+ HSPCs derived from G-CSF–mobilized peripheral blood from adults were thawed, prestimulated in stem cell growth medium for 48 h, treated for 4 h with the indicated doses of rapamycin, and exposed to lentivector for 30 min. Actual concentrations of rapamycin used were 9.8 μM and 18.1 μM. Cells were then fixed/permeabilized, stained with anti-IFITM2/3 and anti-LAMP1, and analyzed by immunofluorescence confocal microscopy. The number of IFITM2/3+ and LAMP1+ vesicles was determined using Imaris software. At least 50 cells were imaged for each condition. (C) Representative images from each treatment condition in B are shown. (Scale bars: 10 μm.) Statistical analysis of vesicle number was conducted with the Kruskal–Wallis test using Dunn’s multiple comparison correction. ns, not significant, P > 0.05; **P < 0.0001. D, DMSO; HSC, hematopoietic stem cells; LV, lentivector.
Fig. 4.
Fig. 4.
IFITM silencing abrogates the rapamycin-mediated enhancement of lentivector transduction. (A) HeLa cells were seeded in 24-well plates (50,000 per well) overnight. Cells were treated with DMSO or rapamycin (20 μM) for 4 h and then with fresh media containing DMSO or rapamycin (20 μM) and the indicated quantity of lentivector (HIV-VSV-G). Approximately 24 h later, cells were fixed/permeabilized, stained with anti-Gag, and analyzed by flow cytometry. Numbers inside gates indicate percent of Gag+ cells. (B) HeLa cells stably expressing shRNA (scrambled control or IFITM3) were treated with DMSO or rapamycin (20 μM) and exposed to HIV-VSV-G (50 ng p24/mL). Transduction was scored 24 h later. (C) Relative transduction scores from B were normalized to DMSO-treated shRNA control cells and averaged. (D) HeLa cells were transfected with siRNA (nontargeting control or a mixture targeting IFITM1, IFITM2, and IFITM3) for 48 h, treated with DMSO or rapamycin (20 μM) for 4 h, and exposed to HIV-VSV-G (50 ng p24/mL). (E) HeLa cells were transfected with siRNA as in D, treated with DMSO or rapamycin (20 μM) for 4 h, and exposed to HIV-VSV-G for 2 h. Cells were resuspended in media containing CCF2-AM for 1 h, washed, and fixed/permeabilized for flow cytometry. (F) Western blot analysis of whole cell lysates derived from HeLa cells stably expressing shRNA treated with DMSO, rapamycin (20 μM) alone, rapamycin and bafilomycin A1 (1 μM), or bafilomycin A1 alone. Immunoblotting was performed with anti-IFITM3 and anti-IFITM2/3 antibodies (IFITM2 and IFITM3 are indicated by red and green arrows, respectively). (G) Western blot analysis of whole cell lysates derived from HeLa cells transfected with siRNA for 48 h. Lysates from HeLa IFITM3 shRNA are provided for comparison. Immunoblotting was performed with anti-IFITM3, anti-IFITM2, and anti-IFITM1 (IFITM2 and IFITM1 are indicated by red and blue arrows, respectively). Actin was used as loading control. (H) Primary HFFs were seeded in 24-well plates (50,000 per well) overnight and treated and infected as in D. (I) HeLa (WT or IFITM3 KO) were seeded in 24-well plates (50,000 per well) and treated and infected as in C. Relative transduction scores were normalized to DMSO-treated WT cells and averaged. (J) TZM-bl (WT or IFITM3 KO) were seeded in 24-well plates (50,000 per well) overnight and treated and infected as in C. Relative transduction scores were normalized and averaged. All error bars indicate SE from three experiments. Statistical analysis was conducted with the Student’s t test. ns, not significant, P > 0.05; *P < 0.05; **P < 0.005. FSC, forward scatter; Ni, noninfected.
Fig. 5.
Fig. 5.
Rapamycin promotes IAV infection in an IFITM3-dependent manner. (A) HeLa were seeded in 24-well plates (50,000 per well) overnight and transfected with siRNA (nontargeting control or a mixture targeting IFITM1, IFITM2, and IFITM3) for 48 h. Cells were treated with DMSO or rapamycin (20 μM) for 4 h and then with fresh media containing DMSO or rapamycin (20 μM) and the indicated quantity of IAV PR8. Approximately 18 h after virus exposure, cells were fixed/permeabilized, stained with anti-NP, and analyzed by flow cytometry. Numbers inside gates indicate percent of NP+ cells. (B) Relative infection scores from A using a multiplicity of infection (MOI) of 0.2 were normalized to DMSO-treated siRNA control cells and averaged. (C) Primary HFFs were seeded in 24-well plates overnight and subsequently transfected, treated, and infected as in A with an MOI of 0.2. (D) MEFs derived from ifitm−/− mice and the same cells transduced with murine IFITM3 (mIFITM3) were seeded in 24-well plates (50,000 per well) overnight. Cells were treated with DMSO or rapamycin (20 μM) for 4 h and then with fresh media containing DMSO or rapamycin (20 μM) and IAV PR8 at an MOI of 0.2. Relative infection scores were normalized and averaged, with infection of DMSO-treated ifitm−/− plus mIFITM3 cells set to 100. (E) Western blot analysis of whole cell lysates derived from ifitm−/− and ifitm−/− plus mIFITM3 MEF treated with DMSO, rapamycin (20 μM), or rapamycin and bafilomycin A1 (1 μM) for 4 h. Immunoblotting was performed with anti-IFITM3. Tubulin served as loading control. (F) HeLa were seeded and transfected as in A and exposed to Sendai virus (Cantell) at an MOI of 0.1. Approximately 18 h after virus exposure, cells were fixed/permeabilized, stained with polyclonal anti-SeV, and analyzed by flow cytometry. Relative infection scores were normalized to DMSO-treated siRNA control and averaged. All error bars indicate SE from three experiments. Statistical analysis was carried out with a Student’s t test. ns, not significant, P > 0.05; *P < 0.05; **P < 0.005. NP, nucleoprotein.

Similar articles

Cited by

References

    1. Alberts B, et al. Molecular Biology of the Cell. 6th Ed Garland Science; New York: 2014.
    1. Huotari J, Helenius A. Endosome maturation. EMBO J. 2011;30:3481–3500. - PMC - PubMed
    1. Luzio JP, Pryor PR, Bright NA. Lysosomes: Fusion and function. Nat Rev Mol Cell Biol. 2007;8:622–632. - PubMed
    1. McCullough J, Colf LA, Sundquist WI. Membrane fission reactions of the mammalian ESCRT pathway. Annu Rev Biochem. 2013;82:663–692. - PMC - PubMed
    1. Zhu L, Jorgensen JR, Li M, Chuang Y-S, Emr SD. ESCRTs function directly on the lysosome membrane to downregulate ubiquitinated lysosomal membrane proteins. eLife. 2017;6:3365. - PMC - PubMed

MeSH terms