. 2019 Jan 1;25(1):125-133.
doi: 10.1158/1078-0432.CCR-18-1984. Epub 2018 Oct 9.

Intertumoral Heterogeneity of CD3+ and CD8+ T-Cell Densities in the Microenvironment of DNA Mismatch-Repair-Deficient Colon Cancers: Implications for Prognosis

Affiliations

Intertumoral Heterogeneity of CD3+ and CD8+ T-Cell Densities in the Microenvironment of DNA Mismatch-Repair-Deficient Colon Cancers: Implications for Prognosis

Harry H Yoon et al. Clin Cancer Res. .

Abstract

Purpose: Colorectal cancers with deficient DNA mismatch repair (dMMR) are presumed to uniformly have dense lymphocytic infiltration that underlies their favorable prognosis and is critical to their responsiveness to immunotherapy, as compared with MMR-proficient (pMMR) tumors. We examined T-cell densities and their potential heterogeneity in a large cohort of dMMR tumors.

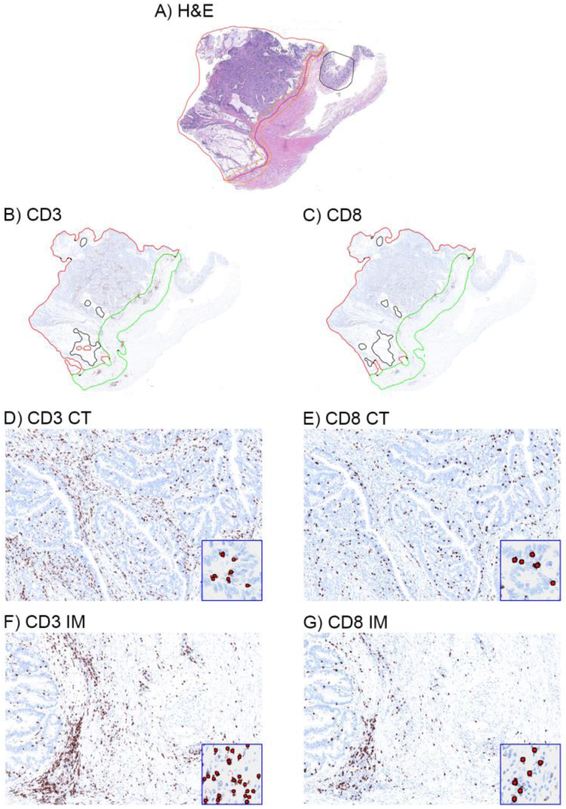
Experimental design: CD3+ and CD8+ T-cell densities were quantified at the invasive margin (IM) and tumor core (CT) in 561 stage III colon cancers (dMMR, n = 278; pMMR, n = 283) from a phase III adjuvant trial (N0147). Their association with overall survival (OS) was determined using multivariable Cox analysis.

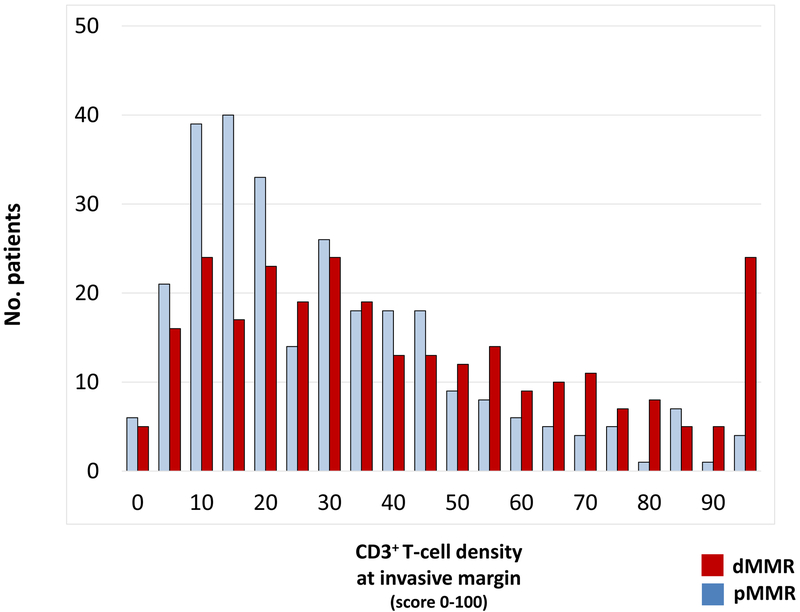
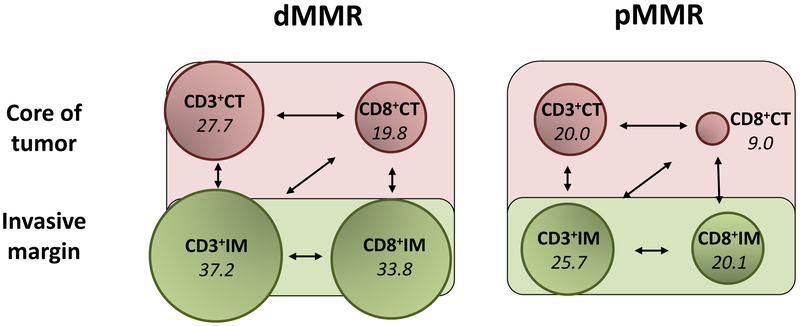
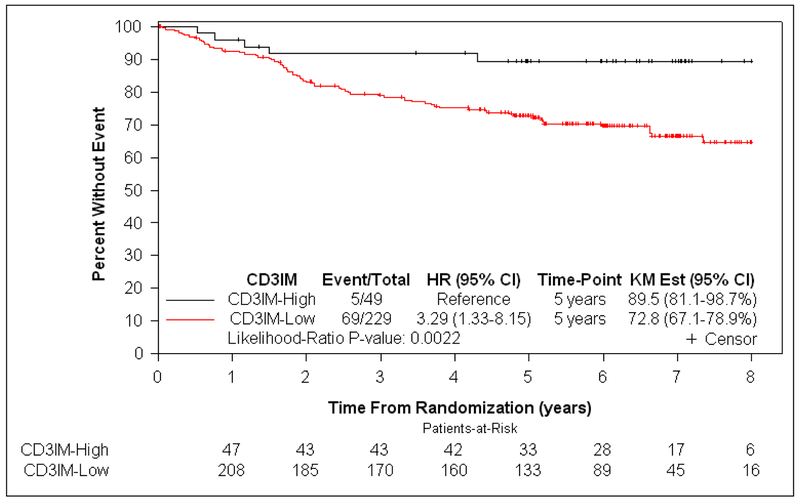
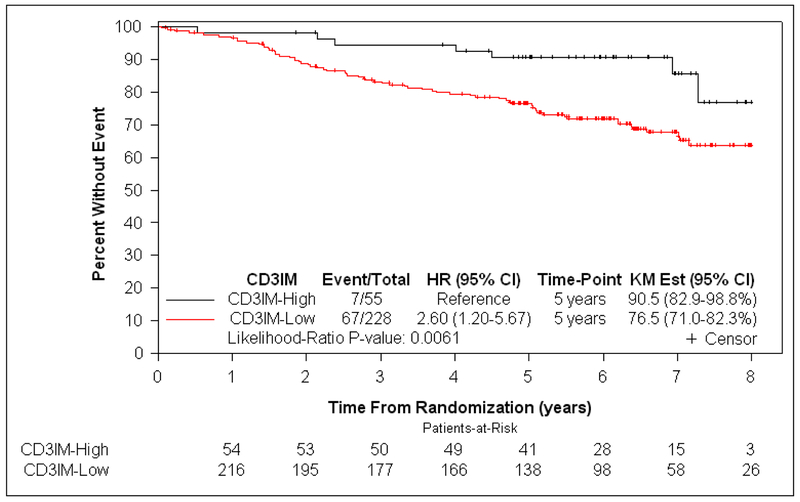
Results: Although CD3+ and CD8+ T-cell densities in the tumor microenvironment were higher in dMMR versus pMMR tumors overall, intertumoral heterogeneity in densities between tumors was significantly higher by 30% to 88% among dMMR versus pMMR cancers (P < 0.0001 for all four T-cell subtypes [CD3+IM, CD3+CT, CD8+IM, CD8+CT]). A substantial proportion of dMMR tumors (26% to 35% depending on the T-cell subtype) exhibited T-cell densities as low as that in the bottom half of pMMR tumors. All four T-cell subtypes were prognostic in dMMR with CD3+IM being the most strongly prognostic. Low (vs. high) CD3+IM was independently associated with poorer OS among dMMR (HR, 4.76; 95% confidence interval, 1.43-15.87; P = 0.0019) and pMMR tumors (P = 0.0103).

Conclusions: Tumor-infiltrating T-cell densities exhibited greater intertumoral heterogeneity among dMMR than pMMR colon cancers, with CD3+IM providing robust stratification of both dMMR and pMMR tumors for prognosis. Potentially, lower T-cell densities among dMMR tumors may contribute to immunotherapy resistance.


Conflict of interest statement

Conflict of Interest Disclosure Statement: Azita Djalilvan, Faith Ough, June Clements, Kandavel Shanmugam, Michael Barnes, Rebecca Bowermaster, Andrea Muranyi and Joerg Bredno are employees of Roche Tissue Diagnostics; Azita Djalilvand, Faith Ough, June Clements, Kandavel Shanmugam, Michael Barnes and Andrea Muranyi own stock in Roche Tissue Diagnostics; Azita Djalilvand, Faith Ough, June Clements, Michael Barnes, Rebecca Bowermaster, Andrea Muranyi and Joerg Bredno receive royalties from Roche Tissue Diagnostics; and Andrea Muranyi receives travel reimbursement from Roche Tissue Diagnostics. Wen-Wei Liu is employed by and receives royalties from Ventana Medical Systems, Inc. Harry Yoon has received research funding from Roche/Genentech and Merck. Frank Sinicrope has served in a consulting or advisory role for Ventana Medical Systems, EMD Serono, and Roche/Genentech, has received travel, accommodations and/or expenses from Ventana Medical Systems.

Figures

Figure 1.
Figure 1.. Representative immunohistochemical images of CD3+ and CD8+ T cells in the tumor microenvironment of colon cancers.
H&E-stained whole-tissue sections were manually annotated to outline the entire tumor region (red line) and demarcate the invasive margin (orange line) (a). Annotations were transferred onto adjacent CD3 and CD8 IHC images (b-c) with an algorithm outlining the invasive margin (IM, green line) and core of the tumor (CT, red line) (see Methods). Whole tissue sections (a-c) and magnified regions (40x, d-g) are shown. Insets show algorithmic cell-by-cell classification of CD3 and CD8 T cells (red dots). T-cell densities were quantified (score 0–100) within the entire tumor compartment.
Figure 2:
Figure 2:. Heterogeneity of lymphocytic infiltrate between patients in mismatch repair deficient (dMMR) and proficient (pMMR) tumors.
(a) The distribution of CD3+ T-cell density (score 0–100) at the invasive margin is shown across the cohort of colon cancers. For each T-cell subtype, density of tumor infiltration was higher in dMMR vs pMMR tumors (each p <.001). (b) Shown are T-cell subtypes at the invasive margin (IM) and core of the tumor (CT). The density of each T-cell subtype (shown in italics) is reflected in the size of the circles. All associations shown by arrows are statistically different (P <.0001, pair-wise comparisons using Wilcoxon Sign Rank tests).
Figure 3:
Figure 3:
Kaplan-Meier curves showing the association of CD3+ T-cell density at the invasive margin with overall survival in stage III colon cancer patients DNA mismatch repair deficiency (a) and proficiency (b).
Figure 3:
Figure 3:
Kaplan-Meier curves showing the association of CD3+ T-cell density at the invasive margin with overall survival in stage III colon cancer patients DNA mismatch repair deficiency (a) and proficiency (b).

References

    1. Locker GY, Hamilton S, Harris J, Jessup JM, Kemeny N, Macdonald JS, et al. ASCO 2006 update of recommendations for the use of tumor markers in gastrointestinal cancer. Journal of clinical oncology : official journal of the American Society of Clinical Oncology. 2006;24:5313–27. - PubMed
    1. Nagtegaal ID, Quirke P, Schmoll HJ. Has the new TNM classification for colorectal cancer improved care? Nature reviews Clinical oncology. 2011;9:119–23. - PubMed
    1. Atlas TCG. Comprehensive molecular characterization of human colon and rectal cancer. Nature. 2012;487:330–7. - PMC - PubMed
    1. Guinney J, Dienstmann R, Wang X, de Reynies A, Schlicker A, Soneson C, et al. The consensus molecular subtypes of colorectal cancer. Nat Med. 2015;21:1350–6. - PMC - PubMed
    1. Sinicrope FA, Mahoney MR, Smyrk TC, Thibodeau SN, Warren RS, Bertagnolli MM, et al. Prognostic Impact of Deficient DNA Mismatch Repair in Patients With Stage III Colon Cancer From a Randomized Trial of FOLFOX-Based Adjuvant Chemotherapy. Journal of clinical oncology : official journal of the American Society of Clinical Oncology. 2013;31:3664–72. - PMC - PubMed

Publication types

MeSH terms