. 2018 Oct 9;9(1):4167.
doi: 10.1038/s41467-018-06684-2.

Microglia innately develop within cerebral organoids

Affiliations

Microglia innately develop within cerebral organoids

Paul R Ormel et al. Nat Commun. .

Abstract

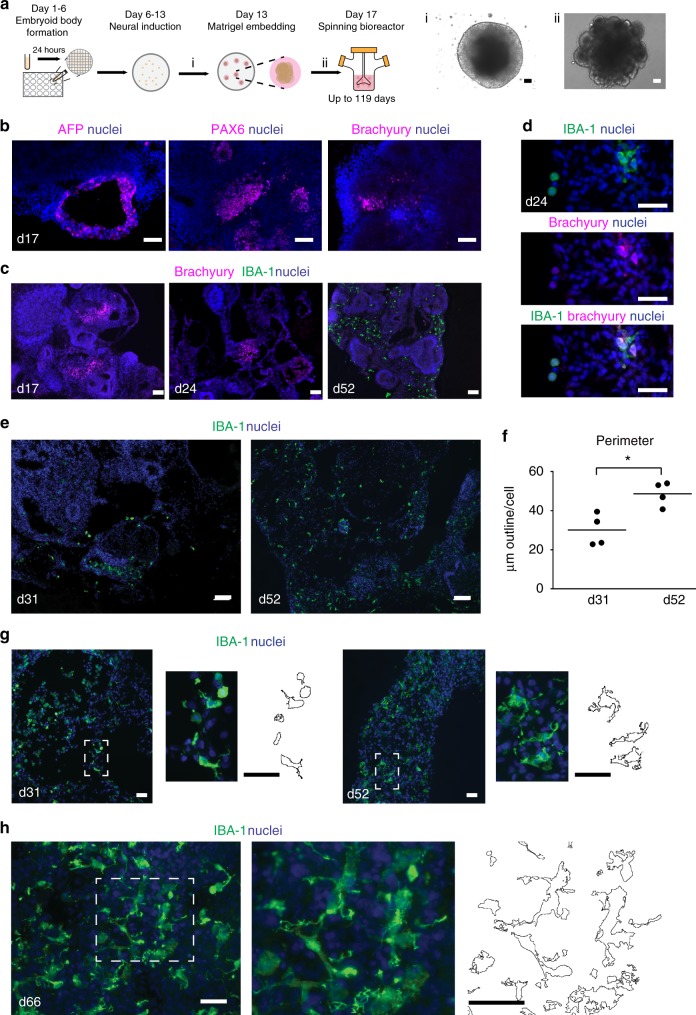
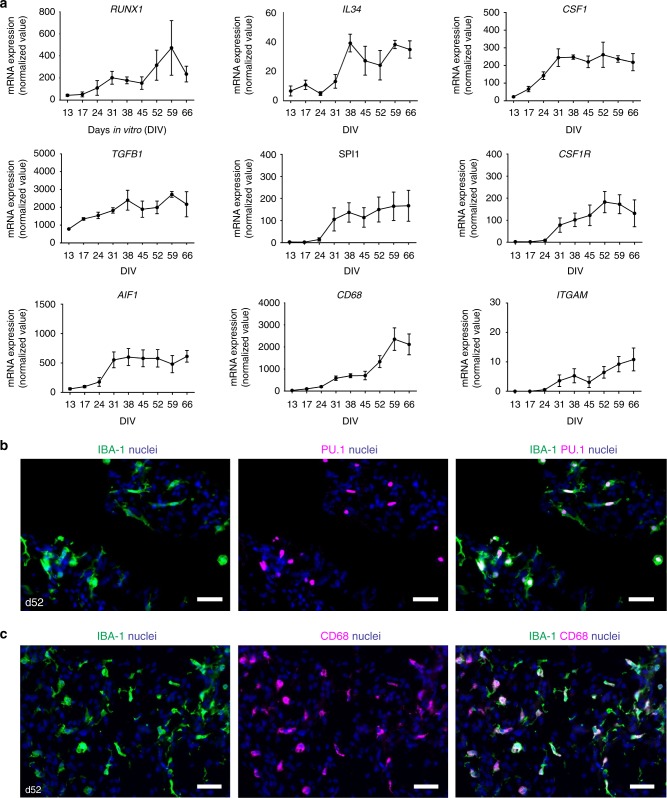
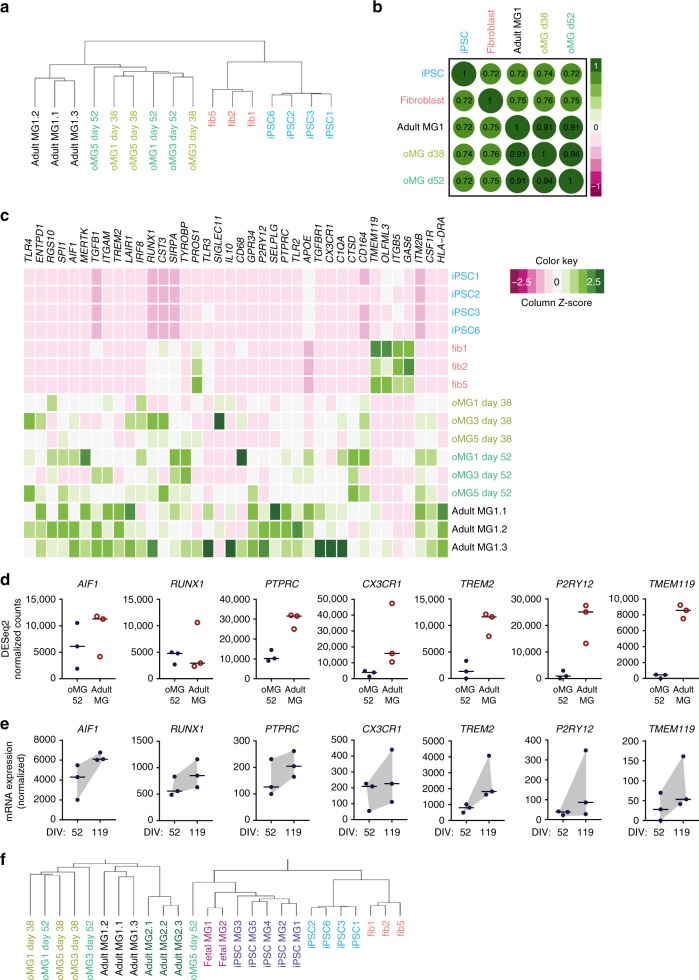
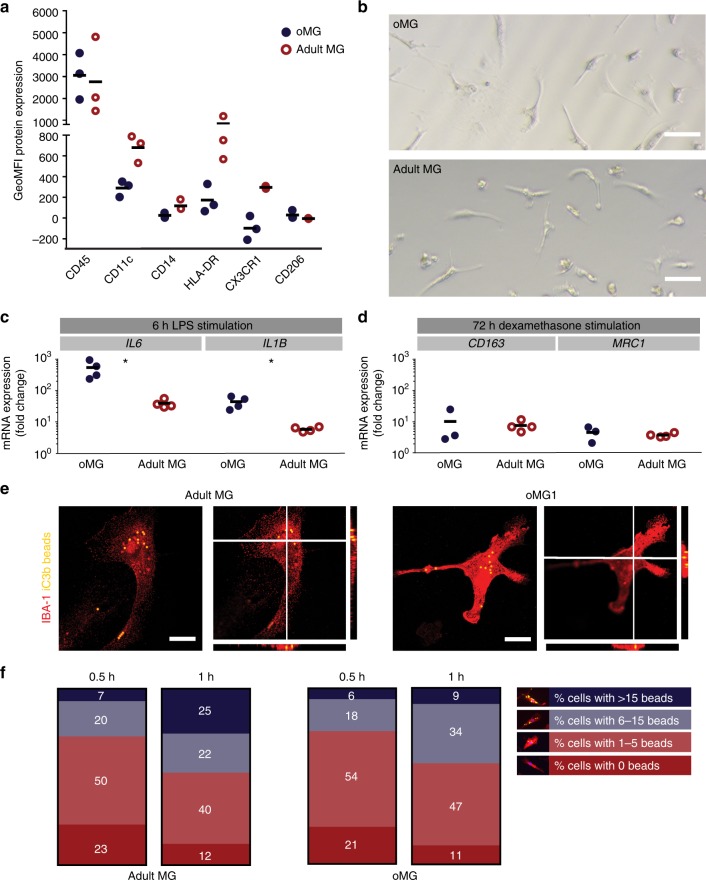
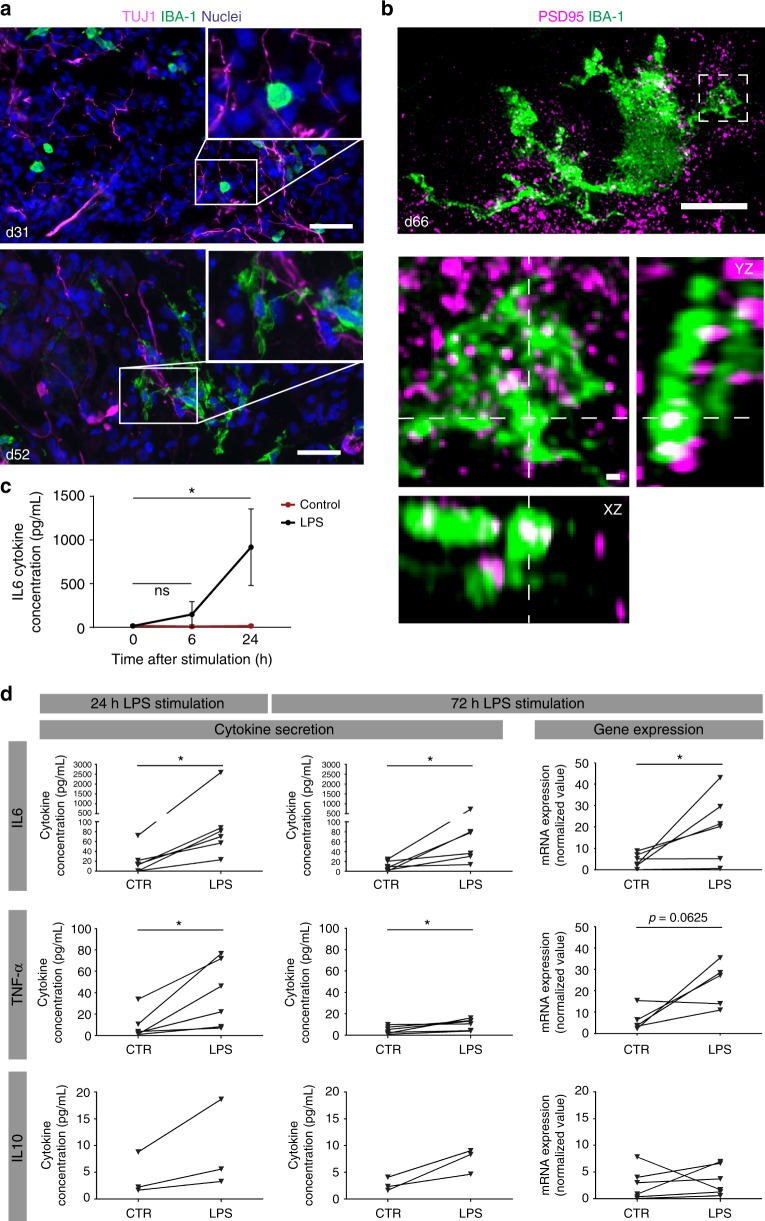
Cerebral organoids are 3D stem cell-derived models that can be utilized to study the human brain. The current consensus is that cerebral organoids consist of cells derived from the neuroectodermal lineage. This limits their value and applicability, as mesodermal-derived microglia are important players in neural development and disease. Remarkably, here we show that microglia can innately develop within a cerebral organoid model and display their characteristic ramified morphology. The transcriptome and response to inflammatory stimulation of these organoid-grown microglia closely mimic the transcriptome and response of adult microglia acutely isolated from post mortem human brain tissue. In addition, organoid-grown microglia mediate phagocytosis and synaptic material is detected inside them. In all, our study characterizes a microglia-containing organoid model that represents a valuable tool for studying the interplay between microglia, macroglia, and neurons in human brain development and disease.


Conflict of interest statement

L.H.B. declares the following competing financial interests: travel grants and consultancy fees at Baxter International, and is a member of the scientific advisory board at Biogen Idec, Cytokinetics, and no other competing interests. All other authors declare no competing interests.

Figures

Fig. 1
Fig. 1
Mesodermal progenitors develop into microglia-like cells within cerebral organoids. a Schematic overview of the cerebral organoid protocol depicting the essential steps in the differentiation process. Embryoid bodies are formed (day 1–6) after which neuroectoderm is induced (day 6–13). Matrigel embedment provides an extracellular matrix to further grow and develop. Four days later they are transferred to a spinning bioreactor. Before matrigel embedment they have a smooth surface (i), which changes into a surface showing typical budding of the organoid 4 days after matrigel embedment (ii). Scale bar 100 µm. See also Supplementary Fig. 1, 2, and Supplementary Table 1. b AFP, PAX6, and brachyury immunostainings, which are markers for the germ layers endoderm ectoderm and mesoderm, respectively. Representative pictures of cerebral organoids are shown at an early stage of organoid development (day 17). Scale bar 40 µm. c, d Brachyury and IBA-1 immunostainings in cerebral organoids at 17 days (c), 24 days (c, d) and 52 days (c) in culture. Co-expression of IBA-1 and brachyury was visible at day 24. Scale bars 100 (c) and 40 µm (d). e IBA-1 immunostainings show distribution of microglia-like cells in cerebral organoids at day 31 and day 52 in culture. Scale bar 40 µm. f, g The perimeter of microglia at day 31 and day 52 quantified (f) with an automated approach by FIJI of IBA-1+ immunostainings of cerebral organoids (g). n = 4 images of organoids quantified per timepoint, Mann–Whitney test U = 0, p = 0.029. Data is represented as median. Scale bars 40 µm. (close-up and perimeter are shown) (*p < 0.05). h Morphology of microglia-like cells illustrated by IBA-1+ immunostainings after 66 days in culture. Scale bar 40 µm. (close-up and perimeter are shown) Representative pictures of cerebral organoids from iPSC 1 are shown
Fig. 2
Fig. 2
Microglia-specific gene and protein expression. a Time course of mRNA expression levels of early microglia markers and factors involved in microglia development in organoids assessed by qRT-PCR and normalized to the geomean of the reference genes SDHA2 and ACTB. Data points represent the mean of four batches of two organoids per batch per timepoint. All batches consisted of organoids derived from iPSC 1. Error bars represent the standard error of the mean (SEM). See also Supplementary Fig. 3a. b, c Double immunostainings of IBA-1 combined with nuclear PU.1 (b) and CD68 (c) at day 52. Representative pictures of cerebral organoids from iPSC 1 are shown. Scale bars 40 µm
Fig. 3
Fig. 3
oMG microglia gene expression profile is highly comparable to microglia(-like) cells. a Unsupervised hierarchical cluster analysis on DESeq2 rlog transformed raw counts of oMG day 38, oMG day 52, adult MG1, iPSC, and fibroblasts based on all genes after removal of common genes (FDR > 0.05, sum of raw read counts > 0) between samples. b Spearman correlation matrix for the correlations between oMG day 38, oMG day 52, adult MG1, iPSC and fibroblast DESeq2 rlog transformed raw counts of genes used in Fig. 3a. Median rlog gene counts of the biological replicates were used as input. The size and color of circles show the strength and direction of the correlation, respectively. c Heatplot representation of DESeq2 normalized expression levels for several microglia markers, , in iPSCs fibroblasts, oMG day 38, oMG day 52, and adult MG1. d Plotted DESeq2 normalized expression of a selection of microglia typical genes in oMG at day 52 and adult MG1. e Temporal mRNA expression of characteristic microglia markers. Microglia were enriched with CD11b-MACs from organoids after 52 or 119 days in culture. mRNA levels were assessed by qRT-PCR and normalized to the geomean of the reference genes SDHA2 and ACTB. Data points represent mRNA levels of oMG 1, 3, and 5. f Unsupervised hierarchical cluster analysis on log transformed FPKM values for all available gene expression data of oMG day 38 and 52, adult MG1, fetal MG, another iPSC-derived microglia model (iPSC MG; GSE85839) and additional primary adult microglia (adult MG2; GSE73721). Prior to hierarchical clustering, log transformed FPKM values were scaled for each sample. See also Supplementary Fig. 4, and Supplementary Data 1 and 2
Fig. 4
Fig. 4
oMG expressed microglia-characteristic cell surface markers and showed similar functional immune and phagocytic properties as adult MG. a Flow cytometric analyses of the expression pattern of microglial extracellular markers on CD11b+-gated oMG (oMG 1, 3, and 5) compared to adult MG derived from three separate brain regions from adult MG1.1. (eight organoids were pooled per donor (oMG 1, 3, and 5) after 52 days in culture). b Morphology of magnetic automated cell sorted CD11b+ oMG 1 and adult MG in bright field microscope after 1 week in culture. Scale bar 40 μm. c mRNA expression, determined by qRT-PCR, of pro-inflammatory cytokines IL6 and IL1B after 6 h stimulation with LPS was significantly higher in oMG compared to adult MG (Mann–Whitney test IL6 and IL1B: U = 0, n = 4, p = 0.03). LPS-stimulated response relative to control condition without LPS. (n = 4 experiments, eight organoids pooled per experiment; adult MG1.1) (*p < 0.05). d Anti-inflammatory response of oMG and adult MG was compared by qRT-PCR for expression of anti-inflammatory genes CD163 and MRC1 upon 72 h stimulation with dexamethasone. Dexamethasone-stimulated response relative to control condition without dexamethasone. (oMG, n = 3 separate experiments in which oMG were isolated from > 4 pooled cerebral organoids from iPSC 1 per experiment; adult MG, n = 4). e Phagocytosis capacity was tested oMG 1 and adult MG by performing a phagocytosis assay with iC3b-coated green-yellow fluorescent beads. Phagocytosis was analyzed by confocal microscopy. Maximum intensity projection and orthogonal views are depicted. One experiment per donor. Scale bars 40 μm. f Quantification of iC3b beads engulfment by oMG and adult MG after 0.5 and 1 h exposure to the beads. Three randomly selected view fields per condition were manually quantified (oMG 1, for 0.5 and 1 h; adult MG1.7, 1.8, and 1.9, for 0.5 and 1 h). IBA-1+ cells were categorized based on the number of inoculated beads as follows: 0 (type 1), 1–5 (type 2), 6–15 (type 3), or > 15 (type 4)
Fig. 5
Fig. 5
oMG form functional interactions with neurons and respond to inflammatory stimuli in situ. a Microglia (IBA-1)–neuron (TUJ1) interaction at an early (day 31) and late (day 52) timepoint was visualized by immunostainings. Representative pictures of cerebral organoids from iPSC 1 are shown. Scale bars 40 μm. b gSTED microscopy showing synaptic content inside microglial processes visualized by immunohistochemistry for IBA-1 and PSD-95 on day 66 organoids. Maximum intensity projection of the entire cell (scale bar 10 μm), and close-up of region of interest (box in dashed line) with maximum intensity projection (scale bar 1 μm) and orthogonal view (voxel size 0.18 μm). c Pilot experiment in which the IL6 inflammatory response was measured in organoids in situ. The cytokine response was significantly increased after 24 h as determined with a Friedman’s ANOVA test (p = 0.03; Dunn’s test t = 6 vs. baseline: -3 with p = 0.44; Dunn’s test t = 24 vs. baseline: -6 with p = 0.03). N = 3 iPSC 1 organoids per group. Error bars indicate standard deviation. d Inflammatory response in situ was measured in whole organoids upon 24 and 72 h of LPS stimulation by ELISA for cytokine release (IL6, TNF-α, and IL10; both timepoints) and transcript fold change by qRT-PCR (after 72 h) for mRNA levels (IL6, TNF, IL10) in day 52 organoids. Secretion of both IL6 and TNF-α, but not IL10, was significantly increased after 24 and 72 h as analyzed with Wilcoxon matched-pairs signed rank test (IL6 and TNF-α: W = 21, p = 0.03). Similarly, mRNA levels of IL6 and TNF, but not IL10, were increased after 72 h stimulation (IL6: W = 21, p = 0.03; TNF: W = 19, p = 0.06). mRNA levels were determined by qRT-PCR and normalized to the geomean of the reference genes SDHA2 and ACTB. Two batches of cerebral organoids from iPSC 1, 3, and 5 were used (n = 6). IL10 levels were below detection level for the second batch of organoids. (*p < 0.05)

Comment in

  • Findings of Research Misconduct.
    [No authors listed] [No authors listed] Fed Regist. 2020 Aug 14;85(158):49661-49662. Fed Regist. 2020. PMID: 32831428 Free PMC article. No abstract available.

References

    1. Ginhoux F, et al. Fate-mapping analysis reveals that adult microglia derive from primitive macrophages. Sci. (80). 2010;330:841–845. doi: 10.1126/science.1194637. - DOI - PMC - PubMed
    1. Kierdorf K, et al. Microglia emerge from erythromyeloid precursors via Pu.1- and Irf8-dependent pathways. Nat. Neurosci. 2013;16:273–280. doi: 10.1038/nn.3318. - DOI - PubMed
    1. Stevens Beth, Allen Nicola J., Vazquez Luis E., Howell Gareth R., Christopherson Karen S., Nouri Navid, Micheva Kristina D., Mehalow Adrienne K., Huberman Andrew D., Stafford Benjamin, Sher Alexander, Litke Alan M., Lambris John D., Smith Stephen J., John Simon W.M., Barres Ben A. The Classical Complement Cascade Mediates CNS Synapse Elimination. Cell. 2007;131(6):1164–1178. doi: 10.1016/j.cell.2007.10.036. - DOI - PubMed
    1. Miyamoto, A., Wake, H., Moorhouse, A. J. & Nabekura, J. Microglia and synapse interactions: fine tuning neural circuits and candidate molecules. Front. Cell. Neurosci. (2013). 10.3389/fncel.2013.00070 - PMC - PubMed
    1. Miyamoto A, et al. Microglia contact induces synapse formation in developing somatosensory cortex. Nat. Commun. 2016 doi: 10.1038/ncomms12540. - DOI - PMC - PubMed

Publication types