. 2018 Oct 9;9(1):4163.
doi: 10.1038/s41467-018-06501-w.

A hippocampal circuit linking dorsal CA2 to ventral CA1 critical for social memory dynamics

Affiliations

A hippocampal circuit linking dorsal CA2 to ventral CA1 critical for social memory dynamics

Torcato Meira et al. Nat Commun. .

Abstract

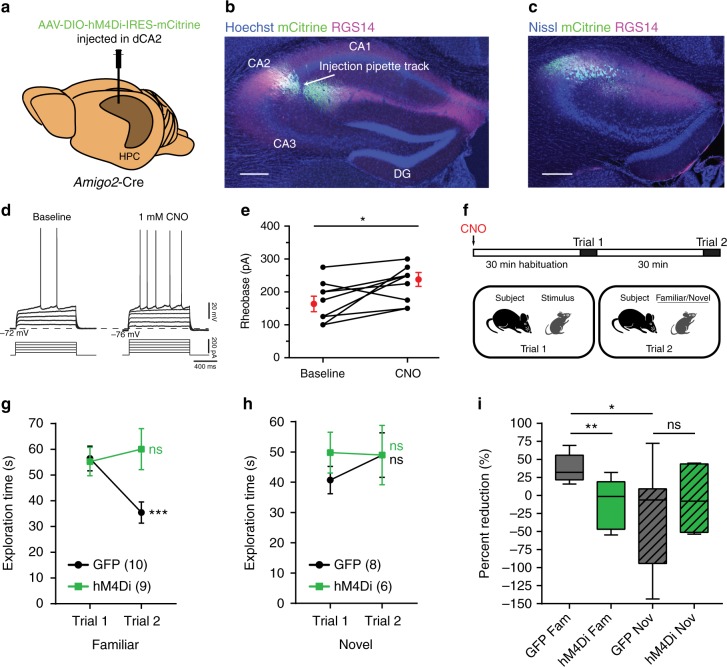
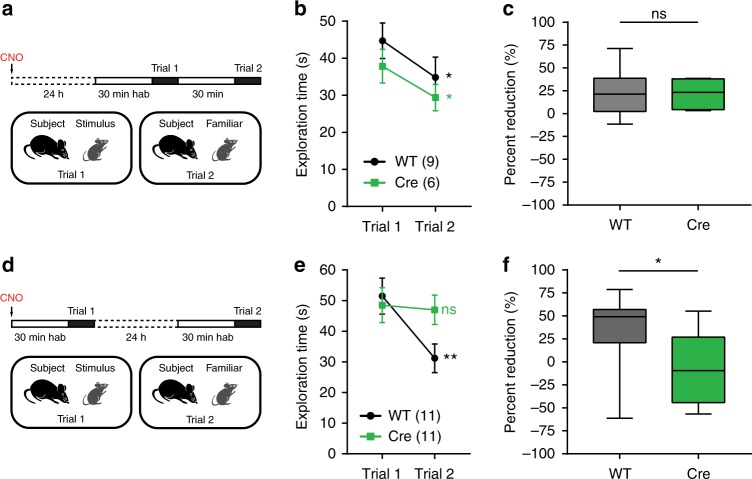
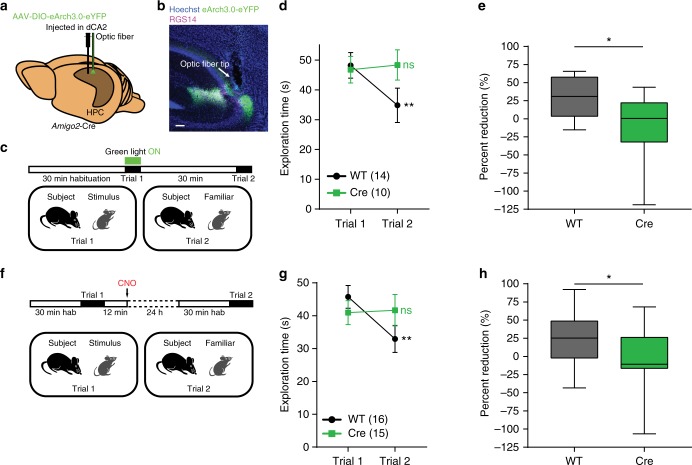
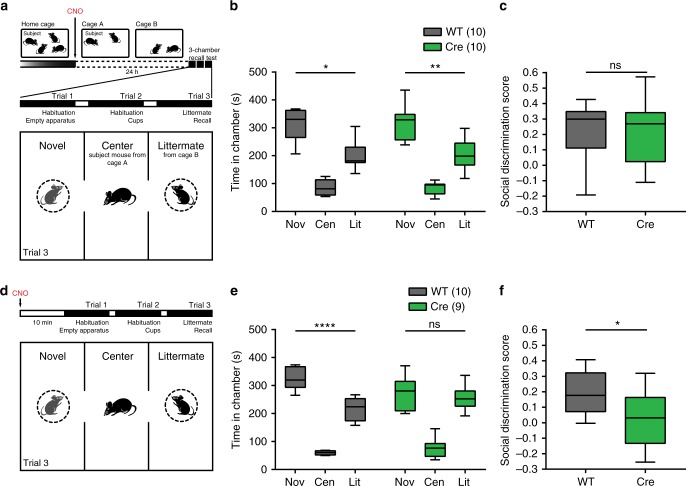
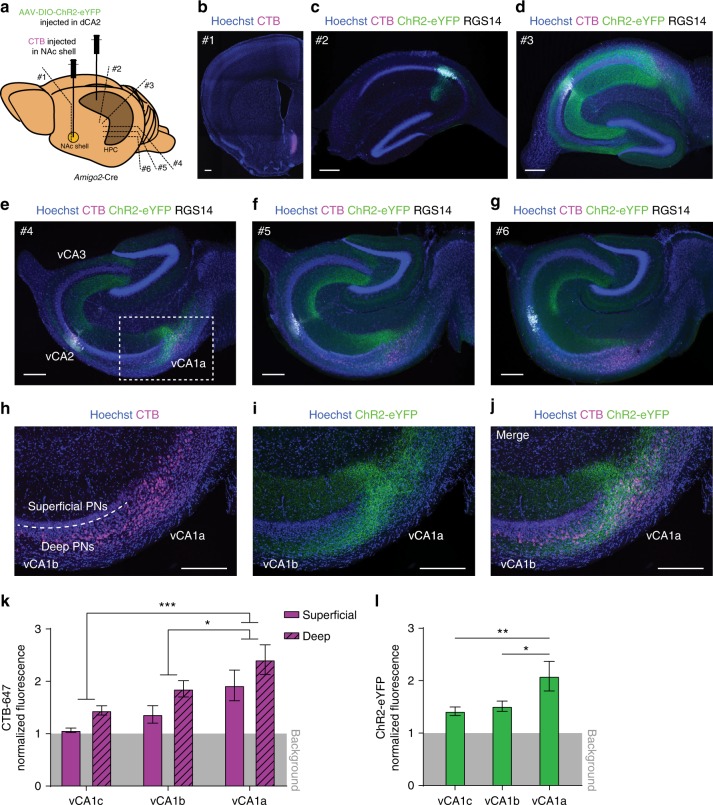
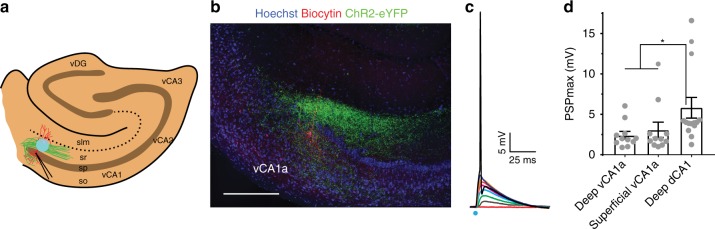
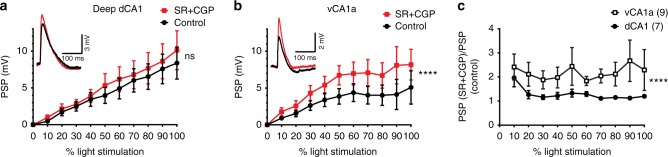
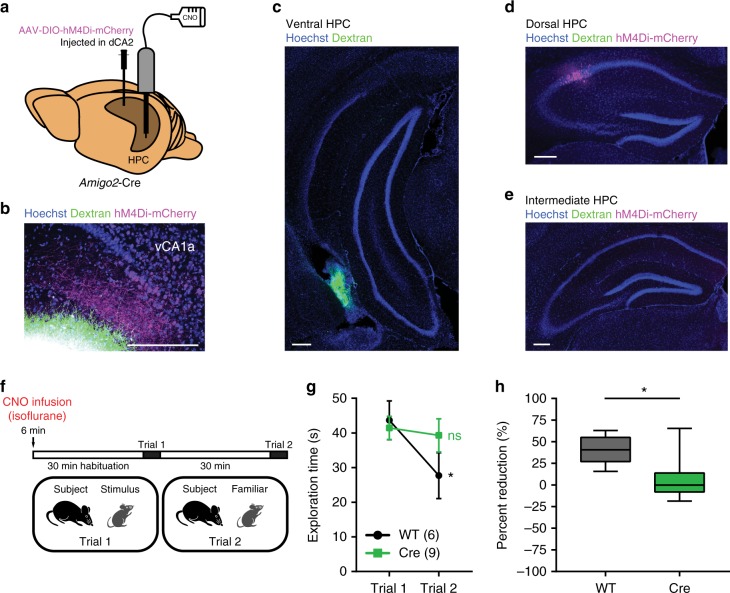
Recent results suggest that social memory requires the dorsal hippocampal CA2 region as well as a subset of ventral CA1 neurons. However, it is unclear whether dorsal CA2 and ventral CA1 represent parallel or sequential circuits. Moreover, because evidence implicating CA2 in social memory comes largely from long-term inactivation experiments, the dynamic role of CA2 in social memory remains unclear. Here, we use pharmacogenetics and optogenetics in mice to acutely and reversibly silence dorsal CA2 and its projections to ventral hippocampus. We show that dorsal CA2 activity is critical for encoding, consolidation, and recall phases of social memory. Moreover, dorsal CA2 contributes to social memory by providing strong excitatory input to the same subregion of ventral CA1 that contains the subset of neurons implicated in social memory. Thus, our studies provide new insights into a dorsal CA2 to ventral CA1 circuit whose dynamic activity is necessary for social memory.


Conflict of interest statement

The authors declare no competing interests.

Figures

Fig. 1
Fig. 1
Acute dCA2 silencing impairs social memory. a AAV-DIO-hM4Di-IRES-mCitrine injection into dCA2 of Amigo2-Cre mice. b Overlap of mCitrine (green) and RGS14 (magenta). c Anterior extent of mCitrine expression. d Action potentials recorded from hM4Di-expressing CA2 PNs (n = 10) in response to progressively higher depolarizing currents before (baseline) and after CNO application. e Rheobase is increased after CNO application (paired t test: t(9) = 2.967, P = 0.0158). f Direct interaction test of social memory performed 30 min after CNO IP in hM4Di-expressing and control (GFP-expressing) Amigo2-Cre mice. g When the same stimulus mouse encountered in trial 1 is also encountered in trial 2, GFP-expressing but not hM4Di-expressing mice showed decreased social exploration time (two-way ANOVA: treatment × trial F(1,17) = 14.85, P = 0.0013; GFP: n = 10, P = 0.0006, Sidak’s multiple comparisons test; hM4Di: n = 9, P = 0.5572, Sidak’s multiple comparisons test). h When a novel stimulus mouse was encountered in trial 2, neither GFP-expressing nor hM4Di-expressing mice showed decreased social exploration (two-way ANOVA: treatment × trial F(1,12) = 0.5303, P = 0.4805; GFP: n = 8, t(7) = 1.078, P = 0.3169, paired t test; hM4Di: n= 6, t(5) = 0.07924, P = 0.9399, paired t test). i Reduction in social exploration time in trial 2 by groups from g and h. For GFP-expressing mice, reduction in exploration during trial 2 to the same (Fam, familiar) mouse presented in trial 1 was significantly greater than reduction when a novel (Nov) mouse was presented in trial 2 (unpaired t test: t(16) = 2.851, P = 0.0116) or when hM4Di-expressing mice encountered a familiar mouse in trial 2 (unpaired t test: t(17) = 3.962, P = 0.0010). No difference was found between GFP and hM4Di-expressing mice encountering a novel mouse in trial 2 (unpaired t test: t(12) = 0.6749, P = 0.5126). Results in e, g and h show mean ± s.e.m. Box-whiskers plot in i present median (center line), 25th to 75th percentiles (box) and minimal and maximal values (whiskers). *P < 0.05; **P < 0.01; ***P < 0.001; ns, P > 0.05. Scale bars, 250 µm (b and c)
Fig. 2
Fig. 2
dCA2 is necessary in the initial stages of social memory formation. a Protocol for experiment examining effect of IP injection of CNO 24 h prior to the direct interaction test. Both WT and Amigo2-Cre littermates were injected in dCA2 with AAV-DIO-hM4Di-IRES-mCitrine. b WT controls and Amigo2-Cre mice showed normal decrease in social exploration time during trial 2 (WT: n = 9, t(8) = 2.815, P = 0.0227, paired t test; Cre: n= 6, t(5) = 2.790, P = 0.0384, paired t test). The groups did not differ significantly (two-way ANOVA: treatment × trial F(1,13) = 0.08127, P = 0.7801). c No difference was found in percent reduction in social exploration time in trial 2 compared to trial 1 between groups (unpaired t test: t(13) = 0.1591, P = 0.8760). d Protocol for a direct interaction test with 24 h intertrial interval. WT and Amigo2-Cre littermates were injected in dCA2 with AAV-DIO-hM4Di-IRES-mCitrine. Trial 1 was performed 30 min after IP injection of CNO and trial 2 was performed 24 h later. e WT but not Amigo2-Cre mice displayed decreased social exploration during trial 2 relative to trial 1 (WT: n = 11, P = 0.0040, Sidak’s multiple comparisons test; Cre: n= 11, P = 0.9578, Sidak’s multiple comparisons test). The groups differed significantly (two-way ANOVA: treatment × trial F(1,20) = 5.394, P = 0.0309). f Percent reduction in social exploration time was lower in Amigo2-Cre than WT groups (unpaired t test: t(20) = 2.558, P = 0.0187). Results in b and e show mean ± s.e.m. Box-whiskers plots in c and f present median (center line), extension from the 25th to 75th percentiles (box) and minimal and maximal values (whiskers). *P < 0.05; **P < 0.01; ns, P > 0.05
Fig. 3
Fig. 3
dCA2 is necessary for social memory encoding and consolidation. a Diagram illustrating injection of AAV-DIO-eArch3.0-eYFP into dCA2 of Amigo2-Cre and WT littermates. An optic fiber was implanted above dCA2. b Dorsal HPC coronal section from an Amigo2-Cre mouse expressing eArch3.0-eYFP in dCA2 (green). Arrow indicates optic fiber tip location, above dCA2. c Behavior protocol for testing whether dCA2 is required for social memory encoding. Green light was delivered through the optic fiber during the 2 min of trial 1 of a direct interaction test. Trial 2 was performed 30 min later with light off. d WT mice displayed decreased social exploration during trial 2 (WT: n = 14, P = 0.0074, Sidak’s multiple comparisons test) whereas Amigo2-Cre mice did not (Cre: n= 10, P = 0.9371, Sidak’s multiple comparisons test). The groups differed significantly (two-way ANOVA: treatment × trial F(1,22) = 5.482, P = 0.0287). e Percent reduction in social exploration time was lower in Amigo2-Cre mice than WT littermates (unpaired t test: t(22) = 2.590, P = 0.0167). f Protocol for determining whether dCA2 is needed during memory consolidation with a direct interaction test. WT and Amigo2-Cre littermates were injected in dCA2 with AAV-DIO-hM4Di-IRES-mCitrine. CNO was given IP 12 min after trial 1, with trial 2 performed 24 h later. g Only WT mice displayed social memory (WT: n = 16, P = 0.0045, Sidak’s multiple comparisons test; Cre: n = 15, P = 0.9797, Sidak’s multiple comparisons test). The groups differed significantly (two-way ANOVA: treatment × trial F(1,29) = 6.058, P = 0.020). h Percent reduction was lower in Amigo2-Cre compared to WT group (unpaired t test: t(29) = 2.173, P = 0.0381). Results in d and g show mean ± s.e.m. Box-whiskers plots in e and h present median (center line), extension from the 25th to 75th percentiles (box) and minimal and maximal values (whiskers). *P < 0.05; **P < 0.01; ns, P > 0.05. Scale bar, 250 µm (b)
Fig. 4
Fig. 4
dCA2 silencing does not disrupt a well-consolidated memory of a littermate but prevents its recall. a Protocol testing effect of dCA2 silencing on retention of a well-consolidated social memory. WT and Amigo2-Cre mice were injected with AAV-DIO-hM4Di-IRES-mCitrine in dCA2. Mice were given CNO IP and randomly divided into two housing cages (A and B). After 24 h, subject mice from cage A were presented with a novel (Nov) mouse and a littermate (Lit) from cage B. b WT and Amigo2-Cre mice spent more time in the chamber housing the novel animal (WT repeated measures one-way ANOVA: n = 10, F(1.414, 12.73) = 44.89, P < 0.0001, Novel vs Littermate P = 0.0114, Tukey’s multiple comparisons test; Cre repeated measures one-way ANOVA: n = 12, F(1.253, 13.79) = 50.15, P < 0.0001, Novel vs Littermate P = 0.0086, Tukey’s multiple comparisons test). The groups did not differ significantly (two-way ANOVA: treatment × chamber F(2,40) = 0.006505, P = 0.9935). c WT and Amigo2-Cre mice showed similar social discrimination scores (unpaired t test: t(20) = 0.03401, P = 0.9732). d Experimental protocol silencing dCA2 during social memory recall. WT and Amigo2-Cre mice previously injected with AAV-DIO-hM4Di-IRES-mCitrine were given CNO IP 30 min prior to the social discrimination trial. e WT mice spent more time in the novel animal chamber compared to the littermate chamber; hM4Di-expressing Amigo2-Cre mice did not show a preference (WT: n = 10, P < 0.0001, Tukey’s multiple comparisons test; Cre: n = 9, P = 0.8026, Tukey’s multiple comparisons test). The groups differed significantly (two-way ANOVA: treatment × chamber F (2,34) = 5.005, P = 0.0124). f Amigo2-Cre mice social discrimination score was significantly lower than that of the WT group (unpaired t test t(17) = 2.391, P = 0.0286). Box-whiskers plots present median (center line), extension from the 25th to 75th percentiles (box) and minimal and maximal values (whiskers). *P < 0.05; **P < 0.01; ****P < 0.0001; ns, P > 0.05
Fig. 5
Fig. 5
dCA2 targets a vCA1 site containing PNs that project to the NAc shell. a AAV-DIO-ChR2-eYFP was injected in dCA2 and the retrograde label CTB-647 was injected into the NAc shell of Amigo2-Cre mice. Approximate location of sections in b, c, d, e, f, and g are indicated (position #1, #2, #3, #4, #5, and #6, respectively). b Site of injection of CTB-647 (magenta). c Dorsal HPC section showing ChR2-eYFP (green) expression in dCA2 PN cell bodies (co-expressing RGS14, white) with no CTB-647 staining (lack of magenta). d Transverse section of intermediate HPC showing dCA2 fibers (labeled with ChR2-eYFP, green) distributed throughout CA3 and CA1 and sparse CTB-647 labeling (magenta). eg Transverse sections progressing through vHPC showing dCA2 fibers (green) in vCA3, distal vCA1 (vCA1a) and adjacent ventral subiculum. Retrograde CTB-647 labeling of projections to NAc shell is seen in deep distal vCA1 (vCA1a) and adjacent ventral subiculum (magenta). hj High magnification views of dotted area in e. k Quantification of normalized CTB-647 fluorescence in deep versus superficial PNs cell layers in vCA1c, vCA1b, and vCA1a. Ventral CA1 fluorescence was greater in deep versus superficial layers (n = 9 slices, 3 mice, repeated measures two-way ANOVA: deep/superficial F(1,8) = 55.05, P < 0.0001). Fluorescence was greater in distal (vCA1a) versus more proximal (vCA1b and vCA1c) areas (n = 9 slices, 3 mice, repeated measures two-way ANOVA: proximal-distal F(2,16) = 14.96, P = 0.0002, vCA1a vs vCA1b P = 0.0135, vCA1a vs vCA1c P = 0.0002, vCA1b vs vCA1c P = 0.1404, Tukey’s multiple comparisons test). l Quantification of normalized fluorescence intensity of ChR2-eYFP signal in dCA2 projections in vCA1. Signal was more intense in vCA1a compared to vCA1b and vCA1c (n = 9 slices, 3 mice, repeated measures one-way ANOVA: F(2,16) = 7.058, P = 0.0063, vCA1a vs vCA1b P = 0.0231, vCA1a vs vCA1c P = 0.0083, vCA1b vs vCA1c P = 0.8702, Tukey’s multiple comparisons test). Results in k and l show mean ± s.e.m. *P < 0.05; **P < 0.01; ***P < 0.001. Scale bars, 250 µm
Fig. 6
Fig. 6
dCA2 provides excitatory input to vCA1a PNs. a Diagram of patch-clamp recordings from vCA1 PNs in response to photostimulation of ChR2-eYFP-expressing fibers from dCA2 PNs. Typical recording site in vCA1a. b Post hoc immunohistochemistry after patch-clamp recording from a vCA1a PN showing the recorded cell (filled with biocytin, red) and ChR2-eYFP-labeled dCA2 fibers (green). c Photostimulation (1 ms blue light pulse) of dCA2 inputs with increasing strengths of illumination evoked PSPs of increasing amplitude in a vCA1a PN. Highest intensity light pulse elicited an action potential. d Peak PSP depolarization from deep and superficial vCA1 PNs and from deep dCA1 PNs in response to photostimulation of dCA2 inputs at maximum light intensity (light intensity before action potentials were triggered or beyond which no further increase in PSP amplitude was observed). No difference was found between deep and superficial vCA1 PNs PSPs (ndeep vCA1a = 11 cells, 6 mice; nsuperficial CA1a = 11 cells, 7 mice; unpaired t test: t(20) = 0.6334, P = 0.5337). Deep dCA1 PNs PSPs (n= 14 cells, 7 mice) were ~twofold larger in amplitude than those in vCA1 (deep and superficial combined; unpaired t test: t(34) = 2.540, P = 0.0158). Results show mean ± s.e.m. *P < 0.05. Circles represent individual cells. Scale bar, 250 µm (b)
Fig. 7
Fig. 7
dCA2 inputs recruit more disynaptic inhibition in vCA1a than in deep dCA1. AAV-DIO-ChR2-eYFP was injected in dCA2 of Amigo2-Cre mice. a Synaptic input-output curves following photostimulation of dCA2 inputs at indicated intensities in deep dCA1 PNs, before and after blockade of GABAA receptors with 2 µM SR 95531 and GABAB receptors with 1 µM CGP 55845. 100% light intensity defined in Fig. 6 legend. Blockade of inhibition caused a small, statistically non-significant increase in the peak PSP (n = 7 cells, 3 mice; two-way ANOVA: treatment × light intensity F(10,132) = 0.06631, P > 0.9999; treatment F(1,132) = 1,741, P = 0.1893). b Input-output curves following photostimulation of dCA2 inputs to vCA1a PNs, before and after 2 µM SR 95531 and 1 µM CGP 55845. Blockade of inhibition blockade produced a significant ~twofold increase in the PSP amplitude (n = 9 cells, 5 mice; two-way ANOVA: treatment × light intensity F(10,154) = 0.4744, P = 0.9046; treatment F(1,154) = 17.79, P < 0.0001). c Ratio of the peak PSP after inhibition block  divided by PSP before inhibition block is greater in vCA1a than in deep dCA1 (two-way ANOVA: dorsal/ventral × light intensity F(9,129) = 0.2679, P = 0.9821; dorsal/ventral F(1,129) = 23.06, P < 0.0001). Results show mean ± s.e.m.****P < 0.0001; ns, P > 0.05
Fig. 8
Fig. 8
dCA2 projections to vHPC are necessary for social memory. a AAV-DIO-hM4Di-mCherry was injected in dCA2 of Amigo2-Cre mice and WT littermates. A cannula guide was implanted for local CNO or dye infusion in vCA1. b Ventral HPC horizontal slice showing overlap between dCA2 fibers located in vCA1a (labeled with hM4Di-mCherry, magenta) and dextran conjugated to Alexa Fluor 680 (green) infused in vCA1. c Ventral HPC coronal slice from an Amigo2-Cre mouse after infusion in vHPC of a dextran conjugated to Alexa Fluor 488 (green). d Dorsal HPC coronal slice from same brain as in c, showing expression of hM4Di-mCherry (magenta) but no Alexa signal. e Intermediate HPC coronal slice showing lack of signal for hM4Di-mCherry or Alexa dye. f A direct interaction test was performed 30 min after bilateral local infusion of CNO in vHPC (2 µL of 1 mM solution per side). g WT mice displayed decreased social exploration time during trial 2 (n = 6, P = 0.0110, Sidak’s multiple comparisons test) whereas hM4Di-mCherry expressing Amigo2-Cre mice showed no decrease (n= 9, P = 0.8351, Sidak’s multiple comparisons test). The two groups differed significantly (two-way ANOVA: treatment × trial F(1,13) = 4.964, P = 0.0442). h The percent reduction in interaction time in trial 2 versus trial 1 in Amigo2-Cre mice was significantly less than in WT mice (unpaired t test: t(13) = 2.962, P = 0.0110). Results in g show mean ± s.e.m. Box-whiskers plot in h present median (center line), extension from the 25th to 75th percentiles (box) and minimal and maximal values (whiskers). *P < 0.05; ns, P > 0.05. Scale bar, 250 µm (b, c, d, e)

Similar articles

Cited by

References

    1. Squire LR, Wixted JT. The cognitive neuroscience of human memory since H.M. Annu. Rev. Neurosci. 2011;34:259–288. doi: 10.1146/annurev-neuro-061010-113720. - DOI - PMC - PubMed
    1. Nakashiba T, et al. Young dentate granule cells mediate pattern separation, whereas old granule cells facilitate pattern completion. Cell. 2012;149:188–201. doi: 10.1016/j.cell.2012.01.046. - DOI - PMC - PubMed
    1. Nakashiba T, Young JZ, McHugh TJ, Buhl DL, Tonegawa S. Transgenic inhibition of synaptic transmission reveals role of CA3 output in hippocampal learning. Science. 2008;319:1260–1264. doi: 10.1126/science.1151120. - DOI - PubMed
    1. Suh J, Rivest AJ, Nakashiba T, Tominaga T, Tonegawa S. Entorhinal cortex layer III input to the hippocampus is crucial for temporal association memory. Science. 2011;334:1415–1420. doi: 10.1126/science.1210125. - DOI - PubMed
    1. Dudek SM, Alexander GM, Farris S. Rediscovering area CA2: unique properties and functions. Nat. Rev. Neurosci. 2016;17:89–102. doi: 10.1038/nrn.2015.22. - DOI - PMC - PubMed

Publication types