. 2018 Oct 9;8(1):15009.
doi: 10.1038/s41598-018-33391-1.

Functional analysis of polyketide synthase genes in the biocontrol fungus Clonostachys rosea

Affiliations

Functional analysis of polyketide synthase genes in the biocontrol fungus Clonostachys rosea

Umma Fatema et al. Sci Rep. .

Abstract

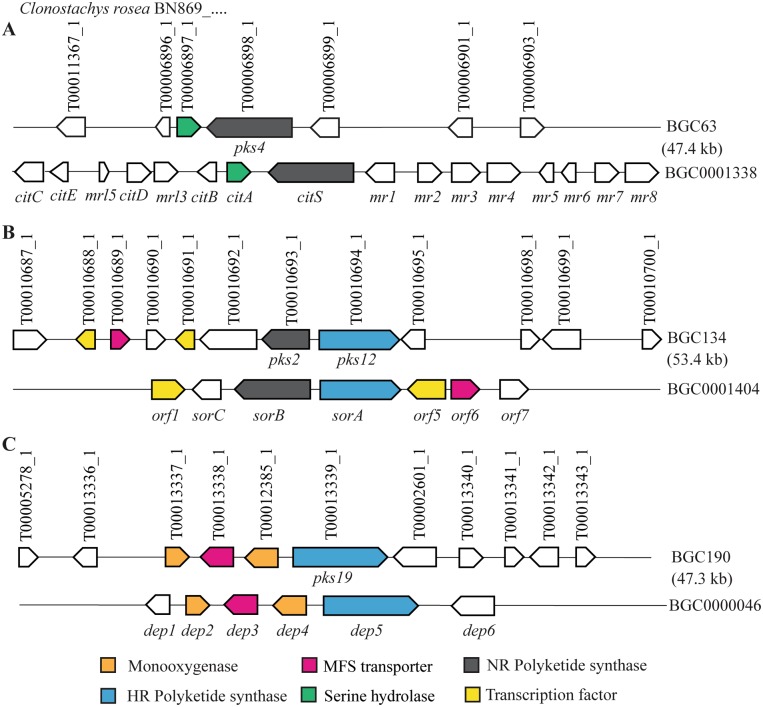
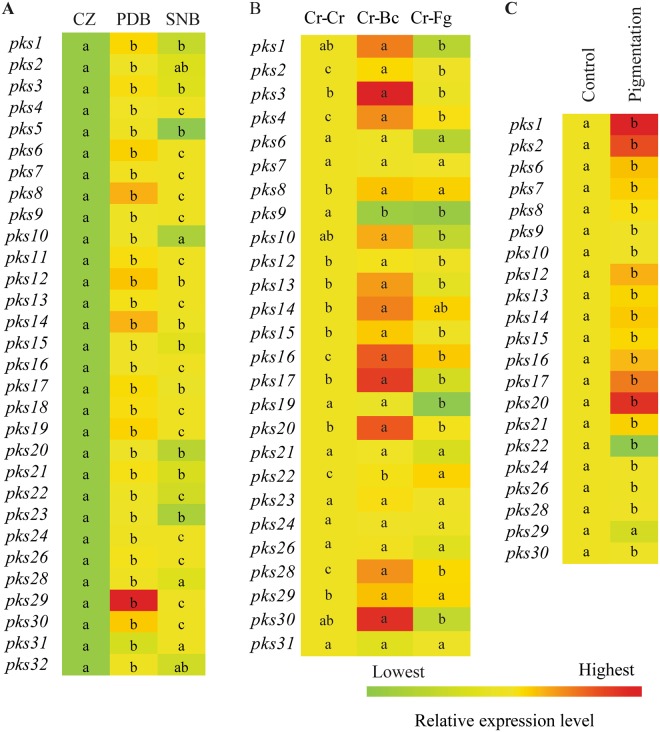
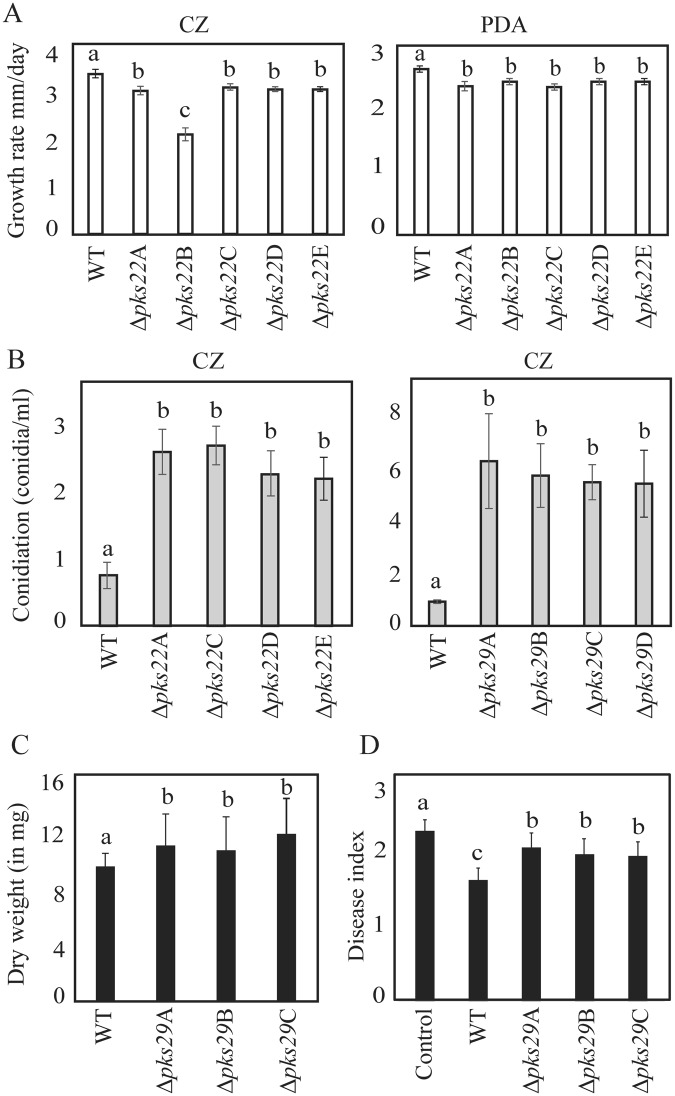
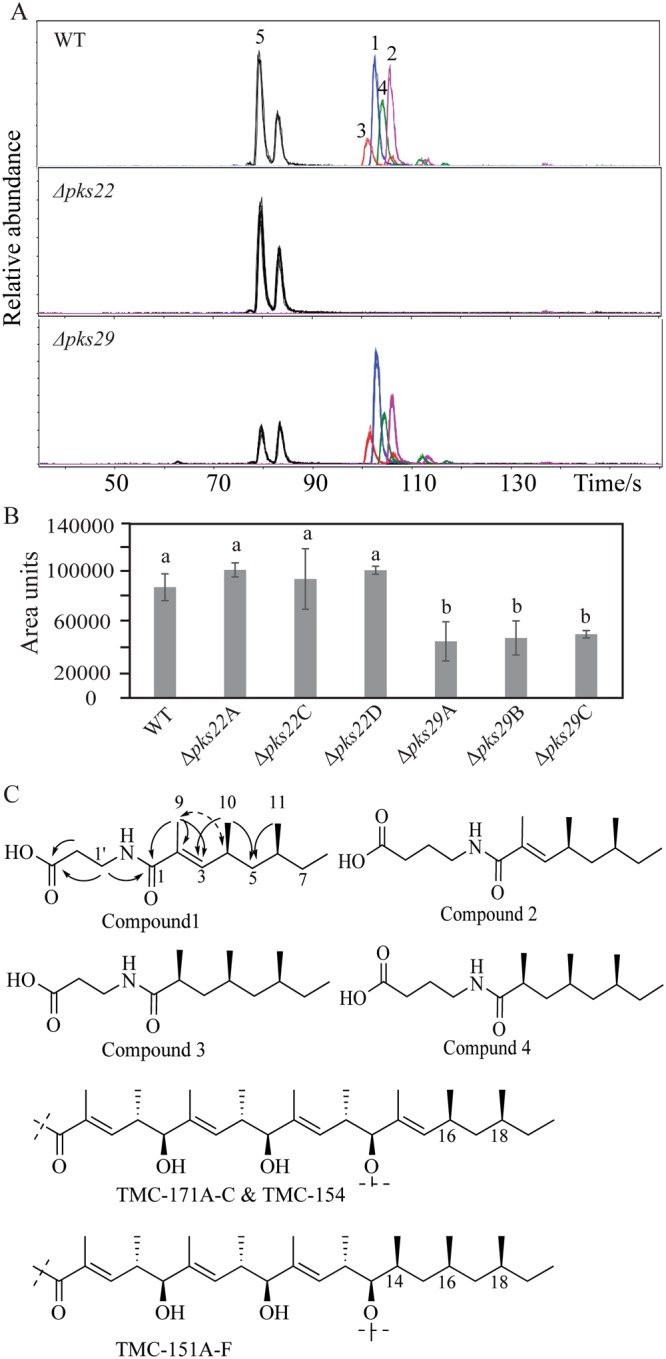
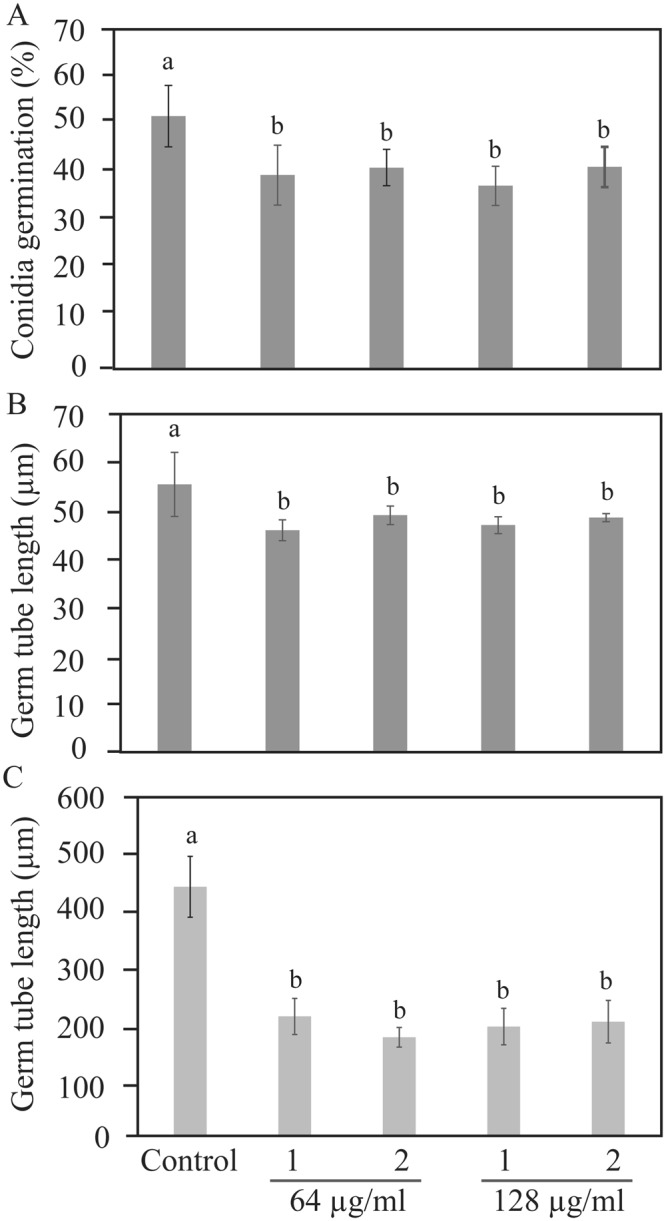
Clonostachys rosea is a mycoparasitic fungus used for biological control of plant diseases. Its genome contains 31 genes putatively encoding for polyketide synthases (PKSs), 75% of which are arranged in biosynthetic gene clusters. Gene expression analysis during C. rosea interactions with the fungal plant pathogens Botrytis cinerea and Fusarium graminearum showed common and species-specific induction of PKS genes. Our data showed a culture media dependent correlation between PKS gene expression and degree of antagonism in C. rosea. The pks22 and pks29 genes were highly induced during fungal-fungal interactions but not during pigmentation, and gene deletion studies revealed that PKS29 was required for full antagonism against B. cinerea, and for biocontrol of fusarium foot rot on barley. Metabolite analysis revealed that Δpks29 strains has a 50% reduced production (P = 0.001) of an unknown polyketide with molecular formula C15H28O3, while Δpks22 strains lost the ability to produce four previously unknown polyketides named Clonorosein A-D. Clonorosein A and B were purified, their structures determined, and showed strong antifungal activity against B. cinerea and F. graminearum. These results show that PKS22 is required for production of antifungal polyketide Clonorosein A-D, and demonstrate the role of PKS29 in antagonism and biocontrol of fungal plant diseases.


Conflict of interest statement

The authors declare no competing interests.

Figures

Figure 1
Figure 1
Schematic representation of C. rosea putative PKS biosynthetic gene clusters (BGCs) showing similarity with genes from characterised BGCs. (A) Citrinin BGC, (B) Sorbicillin BGC, and (C) Depudicin BGC. Type of genes common (≥40% sequence identity; e- value ≥1 × 1025) between two BGC are highlighted with the same colour, white arrows represent genes that are not common between BGC. Genes name are given in parentheses below the arrow, their orientation are indicated, while distance and size are not set to scale. C. rosea protein IDs are given above the arrows. Genbank accession numbers: citA: ALI92654.1; citS: ALI92655.1; orf1: CAP95402.1; sorB: CAP95404.1; sorC: CAP95405.1; orf5: CAP95406.1; orf6: CAP95407.1; dep2: ACZ57545.1; dep3: ACZ57546.1; dep4: ACZ57547.1; dep5: ACZ57548.1.
Figure 2
Figure 2
Production of fungal growth-inhibitory compounds by C. rosea in different media. C. rosea was grown in liquid medium broth (czapek-dox, CZ; malt extract, ME; potato dextrose, PDB; synthetic minimal salt, SMS; synthetic nutrient broth, SNB) for 4 days at 25 °C, culture filtrate was collected after removing the mycelium, and was then inoculated with an A. alternata (Aa), B. cinerea (Bc), F. graminearum (Fg) or R. solani (Rs) agar plug. Fungus inoculated into the respective fresh culture broth was used as control. Biomass production in culture filtrates was analysed by determining mycelial dry weight 4 days post-inoculation. Error bars indicate standard deviation based on five biological replicates. Different letters indicate statistically significant differences (P ≤ 0.05) within experiments based on the Fisher’s exact test.
Figure 3
Figure 3
Heat map of polyketide synthase gene expression in C. rosea. (A) During mycelial growth in liquid CZ, PDB and SNB culture media. C. rosea mycelia grown in CZ medium were used as control treatment. (B) During interactions with itself (Cr-Cr), B. cinerea (Cr-Bc) or F. graminearum (Cr-Fg). C. rosea interaction with self (Cr–Cr) was used as control treatment. (C) During pigment production. Four days old C. rosea culture plates, incubated at the same conditions were used as control treatment as no pigmentation was observed at this stage. Relative expression level based on RT-qPCR was calculated as the ratio between the target PKS gene and β-tubulin using 2−ΔΔCt method (Livak and Schmittgen, 2001), and compared with the respective control. Statistically significant differences (P ≤ 0.05) in gene expression between treatments were determined using Fisher’s exact test and are indicated by different letters. The scale representing the relative expression intensity values is shown.
Figure 4
Figure 4
Phenotypic characterizations of C. rosea WT and deletion mutants. (A) Growth rate of WT, and pks22 deletion strains on czapek-dox (CZ) or potato dextrose agar (PDA) medium. Strains were inoculated on solid agar medium, incubated at 25 °C and the growth rate was recorded five days post-inoculation. Error bars represent standard deviation based on 4 biological replicates. (B) Conidiation of WT, pks22 and pks29 deletion strains on CZ medium 12 days post-inoculation. Conidia were harvested in equal volume of water and counted using a Bright-Line Haemocytometer as per instruction of manufacturer. Error bars represent standard deviation based on 4 biological replicates. (C) Culture filtrate test of C. rosea strains. Culture filtrates from WT and deletion strains grown in PDB were collected 10 days post-inoculation and then inoculated with a B. cinerea agar plug. Biomass production in culture filtrates was analysed by determining mycelial dry weight 4 days post-inoculation. Error bars represent standard deviation based on 4 biological replicates. (D) In vivo bioassay to test the biocontrol ability of C. rosea strains against F. graminearum foot rot disease on barley. Barley seeds were coated with C. rosea conidia, and planted in moist sand together with a F. graminearum agar plug. Seedlings were harvested three weeks post-inoculation and disease symptoms were scored on 0–4 scale. The experiment was performed in five biological replicates with 12–15 plants in each replicate. Different letters indicate statistically significant differences (P ≤ 0.05) within the experiments based on the Fisher’s exact test.
Figure 5
Figure 5
Secondary metabolite analysis of C. rosea WT and deletion strains. (A) Extracted ion chromatograms of compounds 15 obtained by UHPLC-MS analysis of WT, and deletion strains culture filtrates. The experiment was performed in three biological replicates. (B) Relative quantification of compounds 5 in culture filtrates of C. rosea WT and deletion strains. Quantification was done by UHPLC-MS using representative extracted-ion chromatograms for the compound. Sample areas are presented as relative area units. Error bars represent standard deviation based on three biological replicates. (C) Proposed structures of compounds 14, and key HMBC (solid arrows) and ROESY (dashed arrow) correlations for structure determination of compound 1, along with partial structures of TMC-171A-C, TMC-154, and TMC-151A-F (Kohno et al.; Kohno et al.).
Figure 6
Figure 6
Antifungal activity of compound 1 and compound 2 extracted from C. rosea against plant pathogens B. cinerea and F. graminearum. Conidial suspensions in half-strength potato dextrose broth were inoculated in 96-well microtiter plates containing compound 1 or compound 2. Frequency of germinating conidia was determined 8 hour post-inoculation by counting the number of germinating and non-germinating conidia, while germ tube length was measured using ImageJ software. (A) B. cinerea conidia germination, (B) B. cinerea germ tube length, (C) F. graminearum germ tube length. Abbreviation: 1, compound 1; 2, compound 2. Concentrations of compound are indicated below the bar. Error bars represent standard deviation based on three biological replicates. Different letters indicate statistically significant differences (P ≤ 0.05) within the experiments based on Fisher’s exact test.

References

    1. Staunton J, Weissman KJ. Polyketide biosynthesis: a millennium review. Nat Prod Rep. 2001;18:380–416. doi: 10.1039/a909079g. - DOI - PubMed
    1. Fujii I. Functional analysis of fungal polyketide biosynthesis genes. J Antibiot. 2010;63:207–218. doi: 10.1038/ja.2010.17. - DOI - PubMed
    1. Keller NP, Turner G, Bennett JW. Fungal secondary metabolism - from biochemistry to genomics. Nat Rev Microbiol. 2005;3:937–947. doi: 10.1038/nrmicro1286. - DOI - PubMed
    1. Chooi Y, Tang Y. Navigating the fungal polyketide chemical space: from genes to molecules. J Org Chem. 2012;77:9933–9953. doi: 10.1021/jo301592k. - DOI - PMC - PubMed
    1. Keller NP. Translating biosynthetic gene clusters into fungal armor and weaponry. Nat Chem Biol. 2015;11:671–677. doi: 10.1038/nchembio.1897. - DOI - PMC - PubMed

Publication types

Substances