. 2018 Oct 9;8(1):15050.
doi: 10.1038/s41598-018-33420-z.

Uncovering association networks through an eQTL analysis involving human miRNAs and lincRNAs

Affiliations

Uncovering association networks through an eQTL analysis involving human miRNAs and lincRNAs

Paulo R Branco et al. Sci Rep. .

Abstract

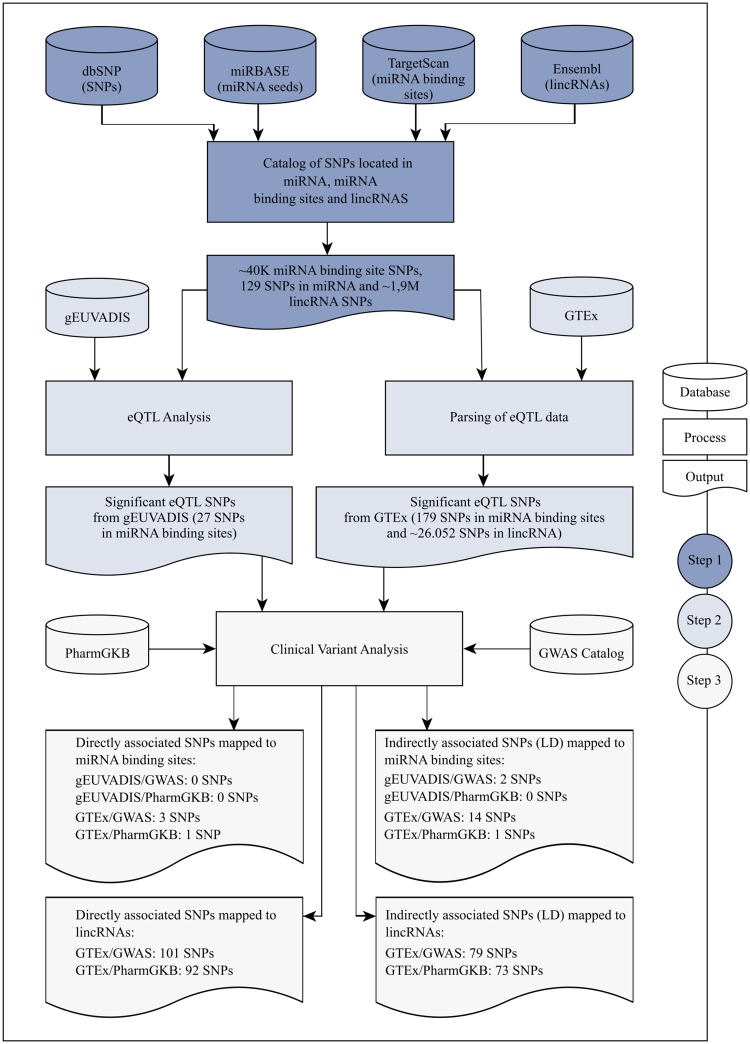
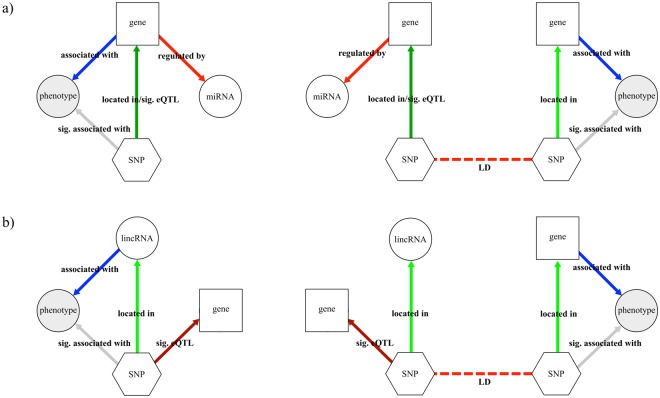
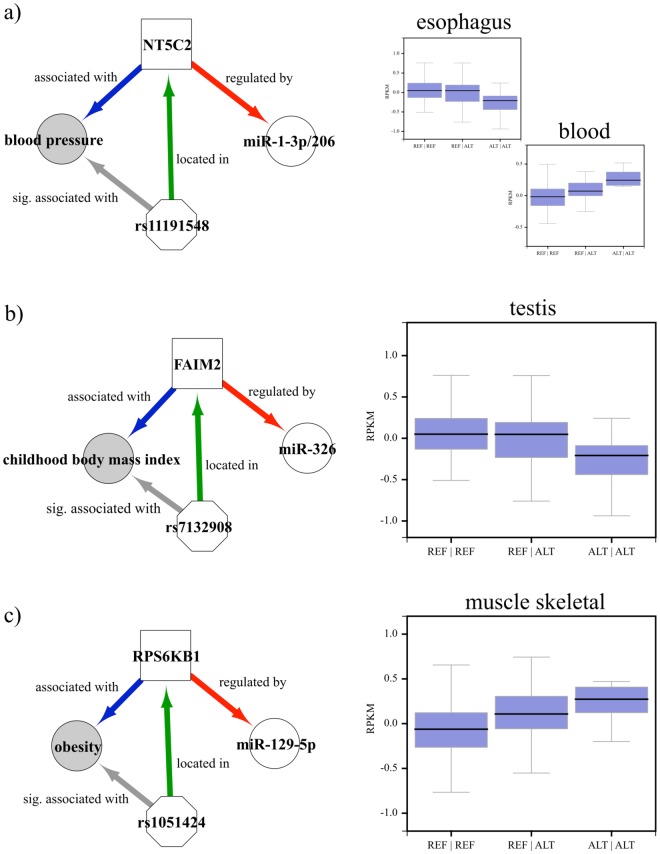
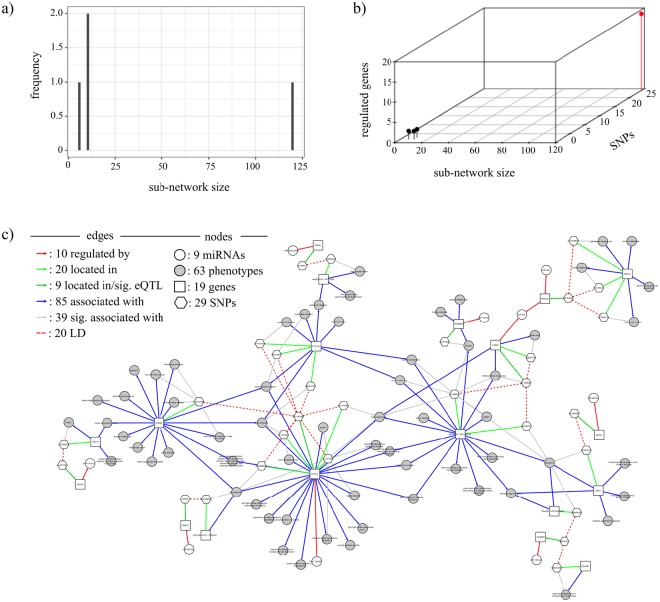
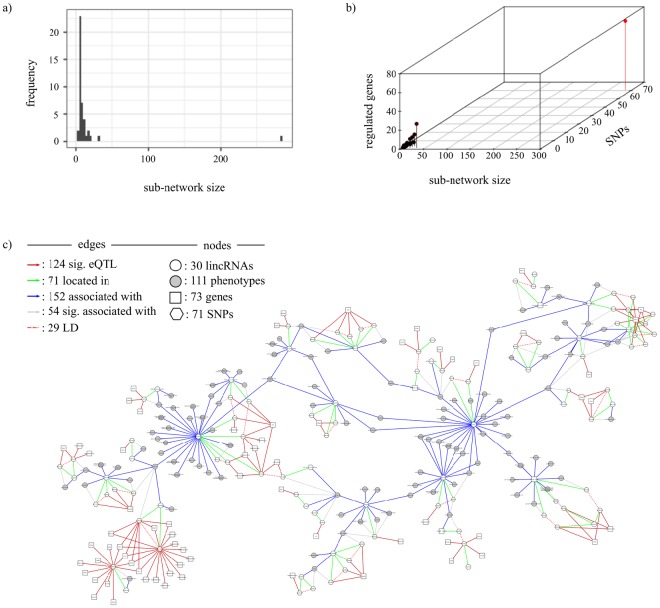
Non-coding RNAs (ncRNA) have an essential role in the complex landscape of human genetic regulatory networks. One area that is poorly explored is the effect of genetic variations on the interaction between ncRNA and their targets. By integrating a significant amount of public data, the present study cataloged the vast landscape of the regulatory effect of microRNAs (miRNA) and long intergenic noncoding RNAs (lincRNA) in the human genome. An expression quantitative trait loci (eQTL) analysis was used to identify genetic variants associated with miRNA and lincRNA and whose genotypes affect gene expression. Association networks were built for eQTL associated to traits of clinical and/or pharmacological relevance.


Conflict of interest statement

The authors declare no competing interests.

Figures

Figure 1
Figure 1
Schematic representation of the analysis workflow for the present study. In Step 1, four databases were integrated to identify SNPs mapped to miRNA seeds and miRNA binding sites, as well as SNPs mapped to lincRNAs. Step 2 comprises two processes: an eQTL analysis with gEUVADIS data as well as data extracted from an eQTL analysis from GTEx. Finally, eQTL from both gEUVADIs and GTEx were compared to variant annotation from GWAS Catalog and PharmGKB.
Figure 2
Figure 2
A graphical model for miRNA eQTL association networks. (a) Graphical model for miRNA eQTL association networks for direct analysis (left) and indirect analysis as defined by linkage disequilibrium (right). (b) Graphical model for lincRNA eQTL association networks for direct analysis (left) and indirect analysis by linkage disequilibrium (right). The elements of the network were represented by distinct shapes, as follows: genes as squares, SNPs as hexagons, lincRNAs and miRNAs as white circles and phenotypes as grey circles. Directed edges (arrows) are represented as follows: genes regulated by miRNAs as light red, SNPs located in genes as light green, eQTL associations as dark red, SNPs located and eQTL associated with genes as dark green, SNPs associated with phenotypes as grey and genes or lincRNAs associated with phenotypes as blue. Undirected edges (light red dashed lines) represent SNPs in high linkage disequilibrium.
Figure 3
Figure 3
gEUVADIS eQTL analysis results. (a) Manhattan plot derived from gEUVADIS eQTL mapped to miRNA-binding sites. Significant SNPs are identified by green dots and threshold (p-adj < = 0.05) is represented by the blue line. (b) Boxplot of TCFL5 expression level (as measured by RPKM) in gEUVADIS samples grouped by rs3664 genotype. (c) Boxplot of WDR43 expression level in gEUVADIS samples grouped by rs11680458 genotype. (d) Boxplot of CSF1R expression level on gEUVADIS samples grouped by rs3828609 genotype.
Figure 4
Figure 4
Distribution of effect size for significant eQTL (derived from GTEx). Y-axis represents the putative SNP effect size (slope) over gene expression. X-axis represents the SNPs grouped by the gene where they are located. SNPs mapped to miRNA binding sites are represented by red or green dots for thyroid (a) and testis (b) tissues. Green dots represent those SNPs that are outliers for the respective distribution (z-score >2 or z-score <−2).
Figure 5
Figure 5
Association networks for eQTL mapped to miRNA-binding sites and present in the GWAS Catalog. (a) Association network for rs11191548, located in the binding sites of miR-1-3p and miR-206 in NT5C2 and associated with blood pressure (left). Boxplot of NT5C2 expression levels on GTEx samples (esophagus and blood tissues) grouped by rs11191548 genotype (right). (b) Association network for rs7132908, located in the binding site of miR-326 in FAIM2 and associated with the childhood body mass index (left). Boxplot of FAIM2 expression levels on GTEx samples (testis) grouped by rs7132908 genotype (right). (c) Association network for rs1051424, located in the binding site of miR-129-5p in RPS6KB1 and associated with obesity (left). Boxplot of RPS6KB1 expression levels on GTEx samples skeletal (muscle) grouped by rs1051424 genotype (right).
Figure 6
Figure 6
Association network built using all GWAS-linked eQTL mapping to miRNA-binding sites. (a) Sub-network distribution size for the association network. (b) Distribution of the number of regulated genes and the number of SNPs based on the sub-network size. The largest sub-network is shown in red. (c) Graphical representation of the largest sub-network identified by the red bin in (b).
Figure 7
Figure 7
Association network built using all GWAS-linked eQTL mapping to lincRNA. (a) Sub-network distribution size for the network. The X-axis represents the component size and Y-axis represents the frequency of the component. (b) Distribution of regulated genes based on the sub-network size and the number of SNPs. The X-axis represents the sub-network size, Z-axis represents the number of SNPs and Y-axis represents the number of regulated genes. Largest sub-network is shown in red. (c) Graphical representation of the largest sub-network identified by the red bin on (b).
Figure 8
Figure 8
Impact of the removal of individual eQTL in the topology of association network. Impact on miRNA and lincRNA networks is shown in (a and b), respectively. Iteration zero means the initial state of the network topology. Each subsequent iteration represents the removal of an individual and independent eQTL (X-axis). The number of sub-networks resulted from the respective eQTL removal is shown on the Y-axis.

References

    1. Ha M, Kim VN. Regulation of microRNA biogenesis. Nat. Rev. Mol. Cell Biol. 2014;15:509–524. doi: 10.1038/nrm3838. - DOI - PubMed
    1. Winter J, Jung S, Keller S, Gregory RI, Diederichs S. Many roads to maturity: MicroRNA biogenesis pathways and their regulation. Nat. Cell Biol. 2009;11:228–234. doi: 10.1038/ncb0309-228. - DOI - PubMed
    1. Meng Y, Quan L, Liu A. Identification of key microRNAs associated with diffuse large B-cell lymphoma by analyzing serum microRNA expressions. Gene. 2018;642:205–211. doi: 10.1016/j.gene.2017.11.022. - DOI - PubMed
    1. Qu R, et al. MicroRNA-374b reduces the proliferation and invasion of colon cancer cells by regulation of LRH-1/Wnt signaling. Gene. 2018;642:354–361. doi: 10.1016/j.gene.2017.11.019. - DOI - PubMed
    1. Hayes J, Peruzzi PP, Lawler S. MicroRNAs in cancer: Biomarkers, functions and therapy. Trends Mol. Med. 2014;20:460–469. doi: 10.1016/j.molmed.2014.06.005. - DOI - PubMed

Publication types

MeSH terms