Structural Rearrangements Maintain the Glycan Shield of an HIV-1 Envelope Trimer After the Loss of a Glycan
- PMID: 30302011
- PMCID: PMC6177452
- DOI: 10.1038/s41598-018-33390-2
Structural Rearrangements Maintain the Glycan Shield of an HIV-1 Envelope Trimer After the Loss of a Glycan
Abstract
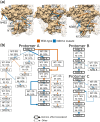
The HIV-1 envelope (Env) glycoprotein is the primary target of the humoral immune response and a critical vaccine candidate. However, Env is densely glycosylated and thereby substantially protected from neutralisation. Importantly, glycan N301 shields V3 loop and CD4 binding site epitopes from neutralising antibodies. Here, we use molecular dynamics techniques to evaluate the structural rearrangements that maintain the protective qualities of the glycan shield after the loss of glycan N301. We examined a naturally occurring subtype C isolate and its N301A mutant; the mutant not only remained protected against neutralising antibodies targeting underlying epitopes, but also exhibited an increased resistance to the VRC01 class of broadly neutralising antibodies. Analysis of this mutant revealed several glycans that were responsible, independently or through synergy, for the neutralisation resistance of the mutant. These data provide detailed insight into the glycan shield's ability to compensate for the loss of a glycan, as well as the cascade of glycan movements on a protomer, starting at the point mutation, that affects the integrity of an antibody epitope located at the edge of the diminishing effect. These results present key, previously overlooked, considerations for HIV-1 Env glycan research and related vaccine studies.
Conflict of interest statement
The authors declare no competing interests.
Figures


Similar articles
-
Changes in Structure and Antigenicity of HIV-1 Env Trimers Resulting from Removal of a Conserved CD4 Binding Site-Proximal Glycan.J Virol. 2016 Sep 29;90(20):9224-36. doi: 10.1128/JVI.01116-16. Print 2016 Oct 15. J Virol. 2016. PMID: 27489265 Free PMC article.
-
Natively glycosylated HIV-1 Env structure reveals new mode for antibody recognition of the CD4-binding site.Nat Struct Mol Biol. 2016 Oct;23(10):906-915. doi: 10.1038/nsmb.3291. Epub 2016 Sep 12. Nat Struct Mol Biol. 2016. PMID: 27617431 Free PMC article.
-
Complete epitopes for vaccine design derived from a crystal structure of the broadly neutralizing antibodies PGT128 and 8ANC195 in complex with an HIV-1 Env trimer.Acta Crystallogr D Biol Crystallogr. 2015 Oct;71(Pt 10):2099-108. doi: 10.1107/S1399004715013917. Epub 2015 Sep 26. Acta Crystallogr D Biol Crystallogr. 2015. PMID: 26457433 Free PMC article.
-
Antibody responses to the HIV-1 envelope high mannose patch.Adv Immunol. 2019;143:11-73. doi: 10.1016/bs.ai.2019.08.002. Epub 2019 Sep 11. Adv Immunol. 2019. PMID: 31607367 Free PMC article. Review.
-
Conformation-Dependent Interactions Between HIV-1 Envelope Glycoproteins and Broadly Neutralizing Antibodies.AIDS Res Hum Retroviruses. 2018 Sep;34(9):794-803. doi: 10.1089/AID.2018.0102. Epub 2018 Jul 17. AIDS Res Hum Retroviruses. 2018. PMID: 29905080 Review.
Cited by
-
Glycoprofile Comparison of the SARS-CoV-2 Spike Proteins Expressed in CHO and HEK Cell Lines.Mol Biotechnol. 2024 Oct 1. doi: 10.1007/s12033-024-01288-2. Online ahead of print. Mol Biotechnol. 2024. PMID: 39352566
-
Quantification of the Resilience and Vulnerability of HIV-1 Native Glycan Shield at Atomistic Detail.iScience. 2020 Nov 20;23(12):101836. doi: 10.1016/j.isci.2020.101836. eCollection 2020 Dec 18. iScience. 2020. PMID: 33319171 Free PMC article.
-
HIV-1 Envelope Conformation, Allostery, and Dynamics.Viruses. 2021 May 7;13(5):852. doi: 10.3390/v13050852. Viruses. 2021. PMID: 34067073 Free PMC article. Review.
-
Glycans in Virus-Host Interactions: A Structural Perspective.Front Mol Biosci. 2021 Jun 7;8:666756. doi: 10.3389/fmolb.2021.666756. eCollection 2021. Front Mol Biosci. 2021. PMID: 34164431 Free PMC article. Review.
-
Virus-Receptor Interactions of Glycosylated SARS-CoV-2 Spike and Human ACE2 Receptor.bioRxiv [Preprint]. 2020 Jul 24:2020.06.25.172403. doi: 10.1101/2020.06.25.172403. bioRxiv. 2020. Update in: Cell Host Microbe. 2020 Oct 7;28(4):586-601.e6. doi: 10.1016/j.chom.2020.08.004. PMID: 32743578 Free PMC article. Updated. Preprint.
References
Publication types
MeSH terms
Substances
Grants and funding
LinkOut - more resources
Full Text Sources
Medical
Research Materials

