. 2018 Oct 9;8(1):15013.
doi: 10.1038/s41598-018-33368-0.

Tracking Tumor Colonization in Xenograft Mouse Models Using Accelerator Mass Spectrometry

Affiliations

Tracking Tumor Colonization in Xenograft Mouse Models Using Accelerator Mass Spectrometry

Nicholas R Hum et al. Sci Rep. .

Abstract

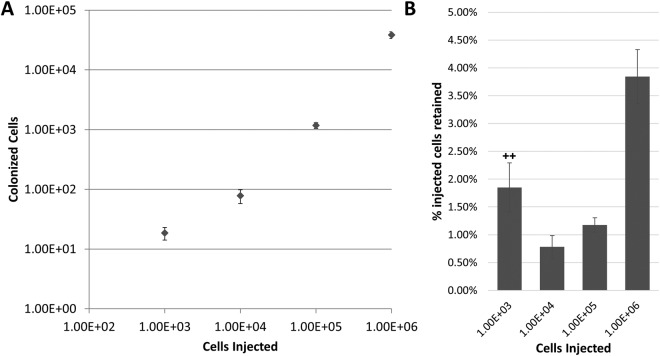
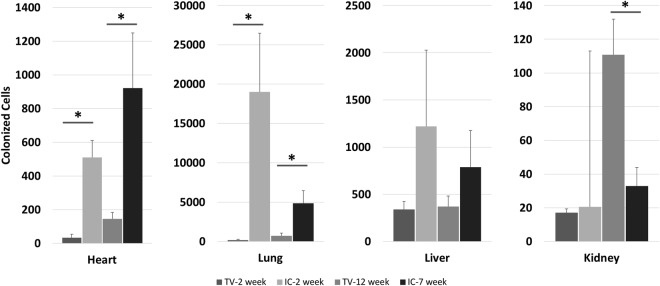
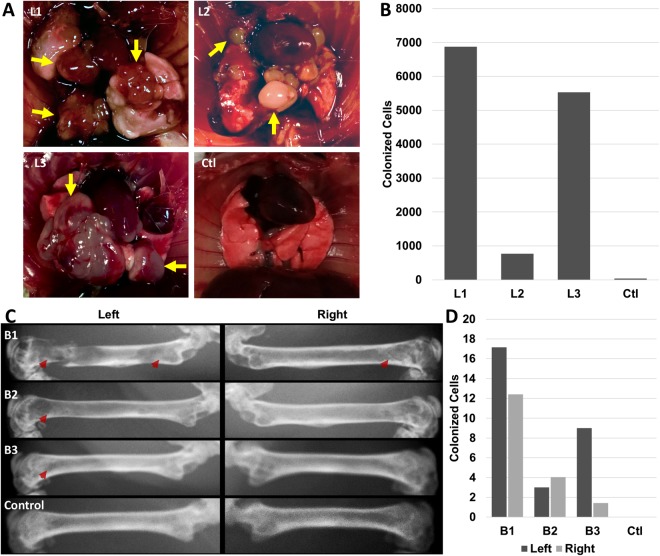
Here we introduce an Accelerator Mass Spectrometry (AMS)-based high precision method for quantifying the number of cancer cells that initiate metastatic tumors, in xenograft mice. Quantification of 14C per cell prior to injection into animals, and quantification of 14C in whole organs allows us to extrapolate the number of cancer cells available to initiate metastatic tumors. The 14C labeling was optimized such that 1 cancer cell was detected among 1 million normal cells. We show that ~1-5% of human cancer cells injected into immunodeficient mice form subcutaneous tumors, and even fewer cells initiate metastatic tumors. Comparisons of metastatic site colonization between a highly metastatic (PC3) and a non-metastatic (LnCap) cell line showed that PC3 cells colonize target tissues in greater quantities at 2 weeks post-delivery, and by 12 weeks post-delivery no 14C was detected in LnCap xenografts, suggesting that all metastatic cells were cleared. The 14C-signal correlated with the presence and the severity of metastatic tumors. AMS measurements of 14C-labeled cells provides a highly-sensitive, quantitative assay to experimentally evaluate metastasis and colonization of target tissues in xenograft mouse models. This approach can potentially be used to evaluate tumor aggressiveness and assist in making informed decisions regarding treatment.


Conflict of interest statement

The authors declare no competing interests.

Figures

Figure 1
Figure 1
Workflow and validation of 14C-labeling cancer colonization assay. (A) Schematic of colonization assay workflow. Cells were first cultured with 14C-thymidine media to achieve single cell resolution and injected into NSG mice via tail vein (TV), heart (IC) or subcutaneous (SQ) routes of delivery. Injected cells were allowed to metastasize for up to 12 weeks. Tissues were harvested at early (2 weeks post injection) and late (12 weeks post injection) time points and DNA was isolated and quantified using AMS. In parallel, the activity of 14C-thymidine label in cultured cells was quantified using liquid scintillation counting (LSC). AMS measurements and LSC readings were combined to calculate the number of colonized cells per each organ examined. (B) Optimization of 14C-thymidine labeling in vitro using various concentrations of radioactivity in cell culture media (n = 3). (C) Correlation of experimental versus theoretical values of 14C-thymidine in labeled cells. (D) Pharmacokinetics of free 14C-thymidine (n = 6): mean concentration-time profile of thymidine in blood following a single intravenous administration of 700 pCi/animal in C57Bl/6 male mice. Data is expressed as the average per time point ± standard error. (E) 14C-thymidine dosing solution administered to C57Bl/6 male mice, thymidine retention time = 16 min. (F,G) HPLC chromatographs of mouse urine collected at 24 h post dose from 2 mice exposed to 14C-thymidine. Open bars indicate thymidine retention time. (H) Stability of 14C-thymidine in labeled cells transferred to non-14C-thymidine media.
Figure 2
Figure 2
Quantification of subcutaneous tumor forming cells. Comparison of subcutaneously injected cells in relation to the number of colonized cells quantified using AMS (A) from the harvested tumor. Percentage of initially injected 14C-labeled cells retained in final tumor (B). At least 4 replicates were analyzed for each quantity of cells injected with the exception of 1.00E + 03 cells due to 14C signal below the level of detection (++).
Figure 3
Figure 3
Colonization of tissue from PC3 and LnCap cells. Quantity of colonized founder cells calculated from 14C signal in DNA from target tissues isolated (A) 2 weeks post injection (n ≥ 5) and (B) 12 weeks post injection (n ≥ 4). Error bars represent SEM. *p < 0.05. (C) Representative pictures of kidneys and livers from PC3 or LnCap injected animals.
Figure 4
Figure 4
Tail vein and intracardiac injected cancer cell colonization. Profile of colonized cells in target tissues calculated from 14C signal in DNA from target tissues isolated at 2-week post injection, 7-week for intracardiac (IC), or 12-week for tail vein (TV) (n = 5).
Figure 5
Figure 5
Tumorigenic and 14C activity in lung and bone metastasis. (A) Lung metastases of differing tumor burden 7-week following PC3 intracardiac injection from 4 mice and (B) quantification of colonized cells from AMS analysis of 14C signal in tissue DNA. (C) X-ray images of femurs from 4 animals 7-week post injection following PC3 intracardiac injection. Red arrows denote sites of osteolytic activity induced by cancer cells and (D) associated quantities of colonized cells in each femur.

Similar articles

Cited by

References

    1. Eckhardt BL, Francis PA, Parker BS, Anderson RL. Strategies for the discovery and development of therapies for metastatic breast cancer. Nature reviews. Drug discovery. 2012;11:479–497. doi: 10.1038/nrd2372. - DOI - PubMed
    1. Koo V, Hamilton PW, Williamson K. Non-invasive in vivo imaging in small animal research. Cellular oncology: the official journal of the International Society for Cellular Oncology. 2006;28:127–139. - PMC - PubMed
    1. Klerk CP, et al. Validity of bioluminescence measurements for noninvasive in vivo imaging of tumor load in small animals. BioTechniques. 2007;43(7–13):30. - PubMed
    1. O’Neill K, Lyons SK, Gallagher WM, Curran KM, Byrne AT. Bioluminescent imaging: a critical tool in pre-clinical oncology research. The Journal of pathology. 2010;220:317–327. doi: 10.1002/path.2656. - DOI - PubMed
    1. Giubellino A, et al. Characterization of two mouse models of metastatic pheochromocytoma using bioluminescence imaging. Cancer letters. 2012;316:46–52. doi: 10.1016/j.canlet.2011.10.019. - DOI - PMC - PubMed

Publication types

Substances