. 2018 Oct 3:9:2041731418801103.
doi: 10.1177/2041731418801103. eCollection 2018 Jan-Dec.

Characterization of the structure, cells, and cellular mechanobiological response of human plantar fascia

Affiliations

Characterization of the structure, cells, and cellular mechanobiological response of human plantar fascia

Jianying Zhang et al. J Tissue Eng. .

Abstract

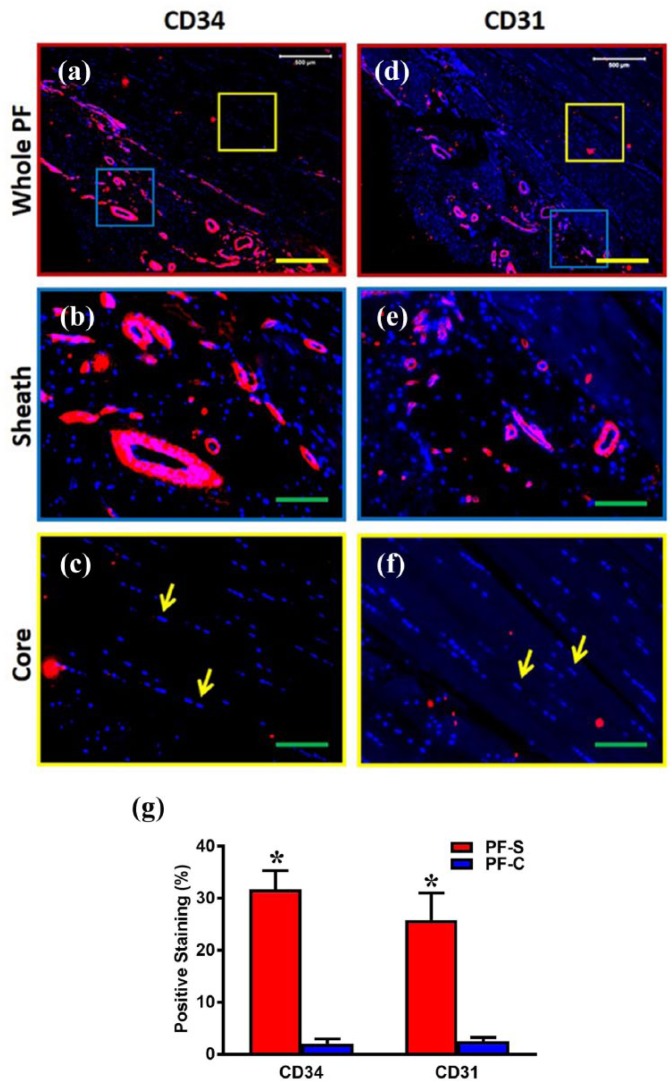
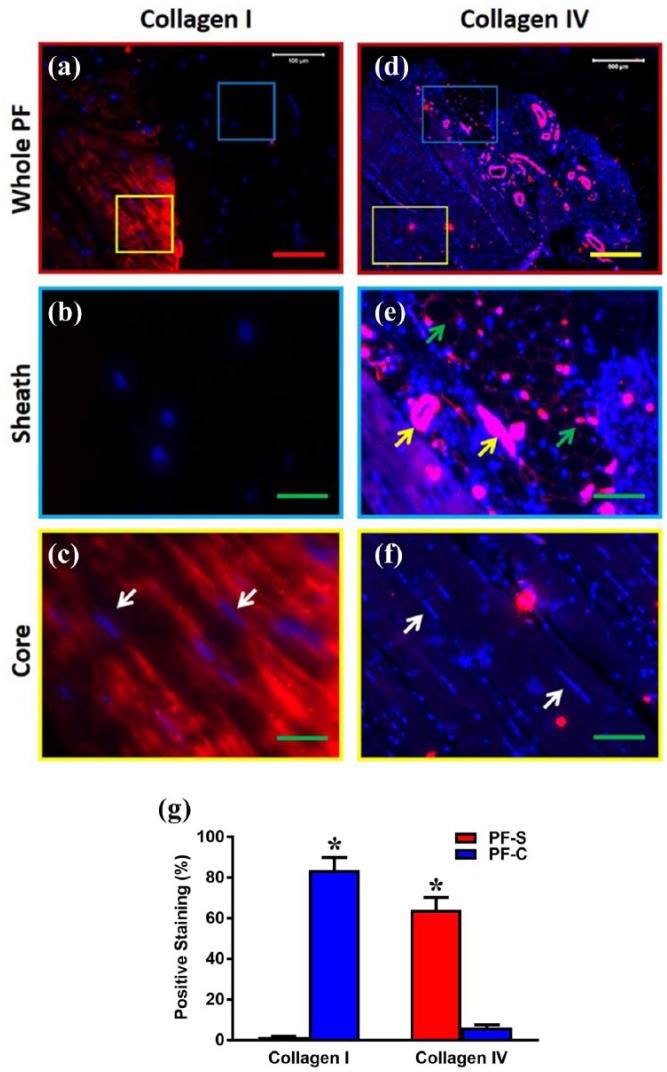
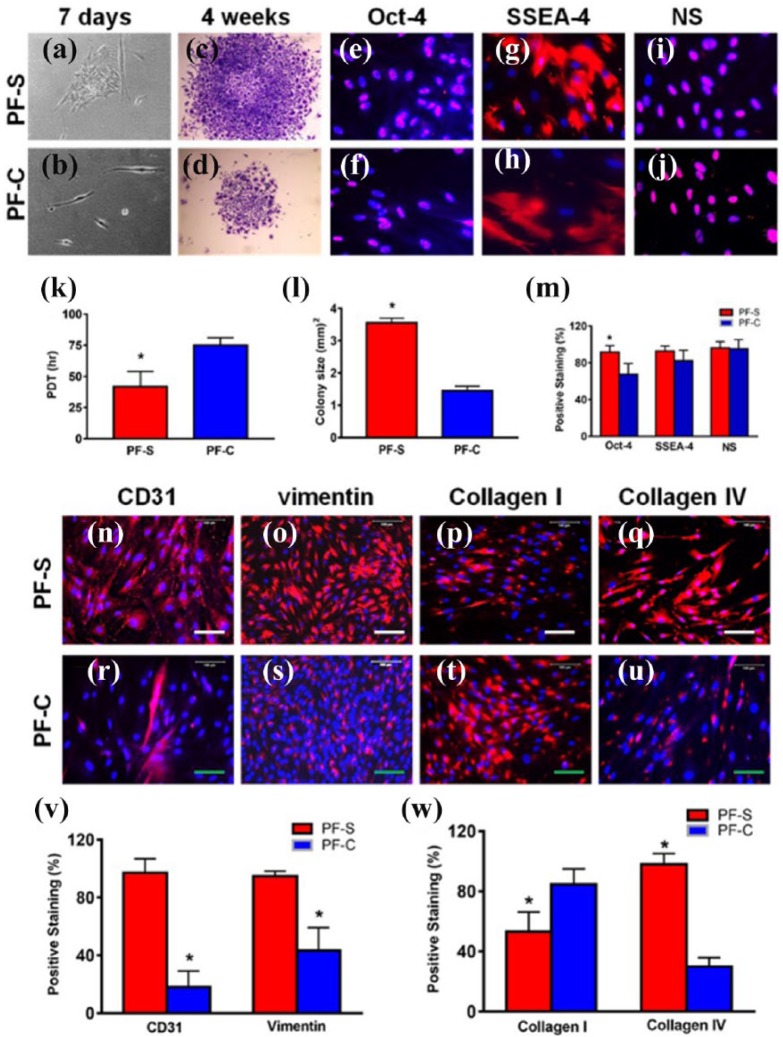
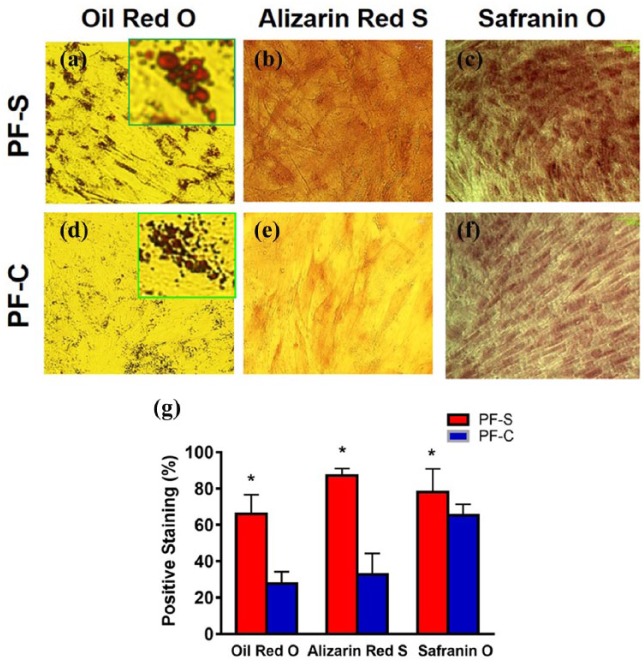
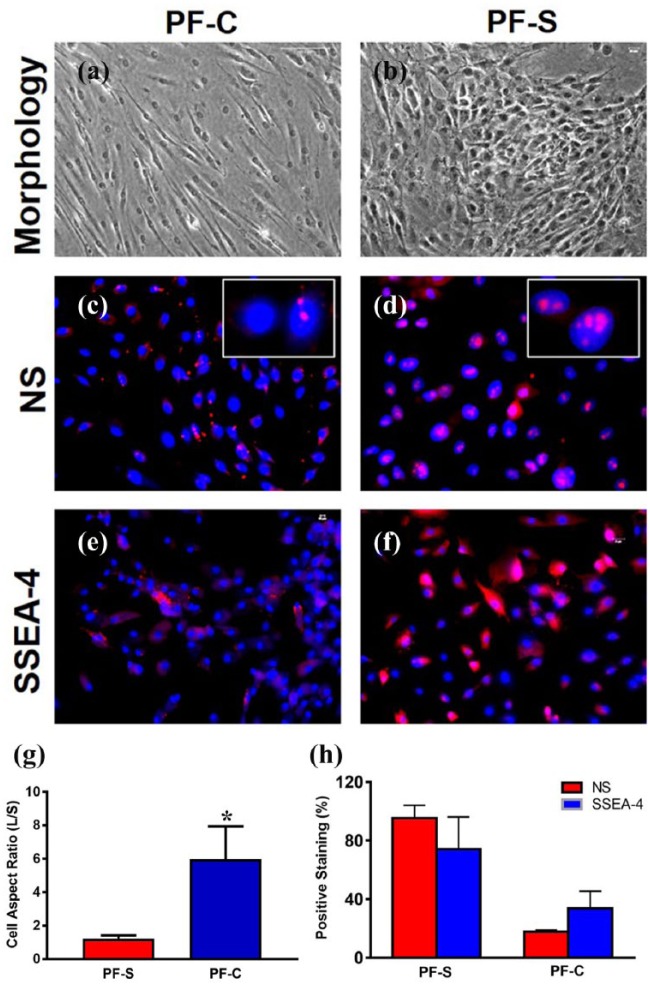
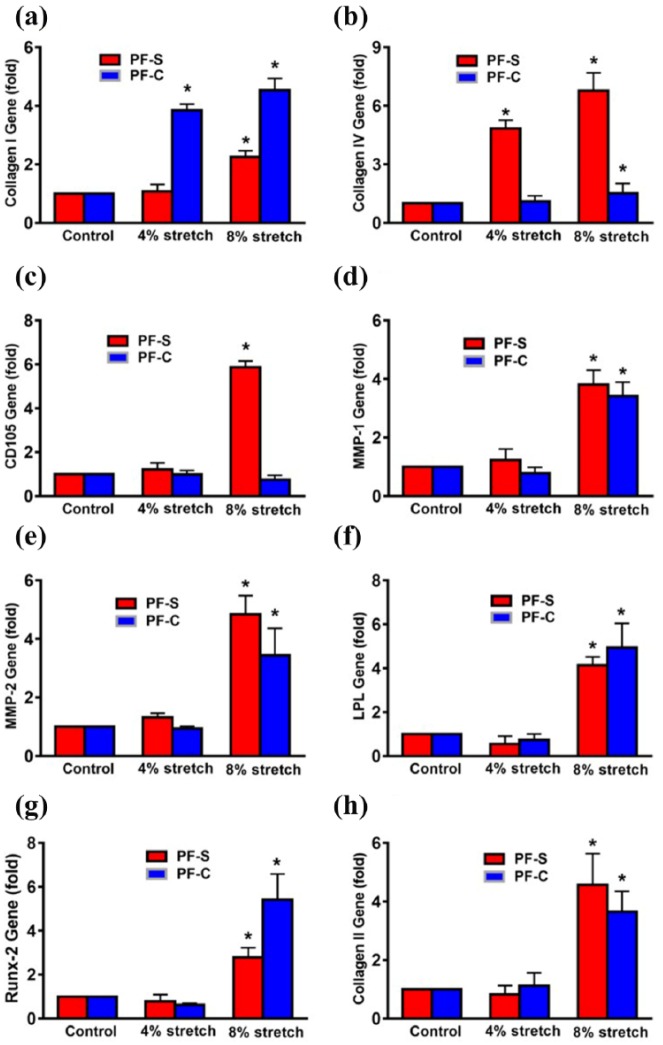
In this study, we report that human plantar fascia consists of two distinct tissues with differential structural properties. These tissues also contain stem/progenitor cells with differential biological properties. The mechanobiological responses of these two plantar fascia stem cells also differ in terms of expression of collagen I and IV, non-ligament-related genes, and proinflammatory genes. The production of inflammatory agents (prostaglandin E2, interleukin-6) and matrix degradative enzymes (matrix metalloproteinase-1, matrix metalloproteinase-2) are also different between the two types of plantar fascia stem cells. Based on the findings from this study, we suggest that plantar fasciitis results from the aberrant mechanobiological responses of the stem cells from plantar fascia sheath and core tissues. Our findings may also be used to devise tissue engineering approaches to treat plantar fascia injury effectively.

Keywords: Plantar fascia; differentiation; inflammation; mechanobiology; stem cells.


Conflict of interest statement

Declaration of conflicting interests: The author(s) declared no potential conflicts of interest with respect to the research, authorship, and/or publication of this article.

Figures

Figure 1.
Figure 1.
Characterization of human PF tested by SEM ((a)–(f)), H&E staining ((g)–(l)), and Safranin O and Fast Green ((m)–(r)). SEM results show that horizontal and cross sections of whole human PF tissue ((a) and (d), respectively) have a sheath region outlined by a blue box and a core region outlined by a yellow box, each characterized by distinct qualities. An enlarged image of the sheath ((b), (e)) region shows a crosslinked collagen network, while an enlarged image of the core ((c), (f)) displays well-organized collagen bundles. H&E staining confirmed SEM findings ((g)–(l)). Enlarged images of the blue (sheath tissue) and yellow (core tissue) box areas in (g) and (j) show sheath tissue with crosslinked network of collagen fibers with many blood vessels (red arrows in (h), (k)) and elongated cells (yellow arrows in (i)) in the core tissue with well-organized collagen fibers. Enlarged image of yellow box area in (j) shows that core tissue has collagen bundle (l). Safranin O and Fast Green staining ((m)–(r)) shows the same results. Both horizontal and cross tissue sections ((m), (p)) show sheath (blue box) and core parts (yellow box). Enlarged image of the blue box area in (m) shows that sheath tissue has a crosslink network of collagen with many blood vessels (red arrows in (n)). Enlarged image of the yellow box area in (m) shows elongated cells (yellow arrows in (o)) stay in the core part with well-organized collagen fibers. Enlarged image of the blue box area in (p) shows sheath with crosslinks of collagen and blood vessels (red arrows in (q)) and some mucin-like tissues (green arrow in (q)). Enlarged image of yellow box area in (p) shows that core tissue has collagen bundle ((r), red arrow). Black bars: 500 µm, yellow bars: 125 µm.
Figure 2.
Figure 2.
The expression of endothelial cell markers, CD34 and CD31, is much higher in the sheath compared to the core in human PF tissue. The immunostaining on CD34 ((a)–(c)) and CD31 ((d)–(f)) shows that human PF tissue has sheath (blue box in (a), (d)) and core parts (yellow box in (a), (d)). Enlarged images of the blue box areas in (a) and (d) show that sheath tissue has a crosslink network of collagen fibers with many blood vessel–like tissues positively stained by CD34 and CD31 (red in (b), (e)). Enlarged images of the yellow box areas in (a) and (d) show elongated cells (yellow arrows in (c), (f)) stay in the core part with well-organized collagen fibers. There is no blood vessel–like tissue found in core part and very few cells are positively stained by CD34 and CD31 ((a), (c), (d), (f)). Red color represents areas positively stained with CD34 and CD31 and blue is stained nuclei. Semi-quantification shows significantly high staining for CD34 and CD31 in PF-S compared to PF-C cells (g). Yellow bars: 500 µm, green bars: 125 µm. *p < 0.01.
Figure 3.
Figure 3.
The differential expression of collagen type I and collagen type IV in the sheath and core parts of human PF tissue. Immunostaining analysis shows that human PF has sheath (blue box in (a), (d)) and core parts (yellow box in (a), (d)). The enlarged image of the blue box area in (a) shows that sheath tissue has a crosslink network of collagen fibers negatively stained by collagen type I (b), while the enlarged image (e) of the blue box area in (d) shows that sheath tissue has a crosslink network of collagen fibers (green arrows in (e)) with many blood vessel–like tissues (yellow arrows in (e)) positively stained by collagen type IV. The enlarged image of the yellow box area in (a) shows elongated cells (white arrows in (c)) stay in the core part with well-organized collagen fibers positively stained with collagen I (c), while an enlarged image (f) of the yellow box area in (d) shows elongated cells (white arrows in (f)) stay in the core part with well-organized collagen fibers negatively stained with collagen IV. Semi-quantification shows significantly high collagen I in PF-C compared to PF-S and significantly high collagen IV in PF-S compared to PF-C cells (g). Red bar: 100 µm, yellow bar: 500 µm; green bars: 125 µm. *p < 0.01.
Figure 4.
Figure 4.
PF-S stem cells differ from PF-C stem cells in proliferation, stem cell, endothelial, basement, and ligament cell marker expression. The morphology of PF-S cells cultured for 7 days shows a typical cobblestone shape consisting of many cells (a). In contrast, the morphology of PF-C cells cultured for 7 days shows elongated shape with very few cells (b). A typical colony formed by PF-S cells (P0) cultured for 4 weeks is large and densely populated (c). However, a typical colony of PF-C cells cultured for 4 weeks is small and sparsely populated (d). PF-S cells grow faster and form larger colonies compared to PF-C cells. Population doubling time (PDT) of PF-S cells is significantly higher than PF-C cells (k), and the average colony size of PF-S cells is significantly greater than PF-C cells (l). Moreover, PF-S stem cells exhibit more extensive expression of stem cell markers compared to PF-C stem cells, although both types of cells at P2 express all three stem cell markers, Oct-4 ((e), (f)), SSEA-4 ((g), (h)), and nucleostemin (NS) ((i), (j)), with Oct-4 expression significantly higher in PF-S cells (m). Furthermore, both PF-S and PF-C cells at P2 express endothelial cell marker, CD31 ((n), (r)); basement marker, vimentin ((o), (s)); collagen type I ((p), (t)); and collagen type IV ((q), (u)), with CD31, vimentin, and collagen IV expression for PF-S significantly higher, but collagen I lesser than PF-C ((v), (w)). Red bars: 500 µm; green bars: 100 µm; *p < 0.05.
Figure 5.
Figure 5.
PF-S stem cells exhibit a higher degree of multi-differentiation potential and maintain better stemness compared to PF-C stem cells. Both PF-S and PF-C cells at P3 undergo adipogenesis shown by Oil Red O ((a), (d)), osteogenesis by Alizarin Red ((b), (e)), and chondrogenesis by Safranin O ((c), (f)) with significantly higher differentiation in PF-S (g). The green box insets in (a) and (d) show adipocytes. *p < 0.05.
Figure 6.
Figure 6.
At P7, PF-S cells still maintain cobblestone-like shape (b), but PF-C cells stay highly elongated (a). The cell shape factor defined by the cell aspect ratio is significantly high in PF-C cells (g). PF-C cells lose stemness ((c), (e)) quickly than PF-S cells ((d), (f)), as evidenced by the low-level expression of stem cell markers, NS and SSEA-4 in PF-C (h). The white box insets show enlarged images of NS staining ((c), (d)). *p < 0.01.
Figure 7.
Figure 7.
IMS induces differential gene expression in PF-S and PF-C stem cells. MMS does not alter the collagen I expression in PF-S stem cells, but there is significant increase in PF-C stem cells. However, IMS enhances collagen I in both types of stem cells with higher expression in PF-C cells (a). In contrast, at MMS, collagen IV expression is significantly enhanced in PF-S cells without any change in PF-C cells (b), whereas IMS significantly increases the expression of collagen IV in PF-S and PF-C stem cells with higher expression in PF-S cells compared to PF-C cells and unstretched control (b). Moreover, at MMS, angiogenesis marker CD105 expression does not change in PF-S and PF-C cells, but 8% stretch significantly enhances the expression only in PF-S cells (c). MMS does not increase gene expression of matrix degradative enzymes MMP-1 and MMP-2; however, IMS significantly enhances the gene expression in PF-S and PF-C cells compared to respective controls ((d), (e)). Moreover, MMS does not change the non-ligament-related gene expression (LPL, Runx-2, collagen II) in both PF-S and PF-C cells ((f)–(h)). However, IMS increases the expression of all three non-ligament-related genes including LPL for adipogenesis (f), Runx-2 for osteogenesis (g), and collagen II for chondrogenesis (h) in both PF-S and PF-C cells compared to unstretched control. *p < 0.05.
Figure 8.
Figure 8.
IMS causes the production of inflammatory mediators, COX-2, IL-6, and PGE2 in PF-S and PF-C stem cells. Western blot shows that MMS does not cause significant changes of COX-1 expression in both PF-S and PF-C cells (a). However, IMS significantly enhances expression of COX-1 in PF-S and COX-2 expression in both types of cells (b). The IL-6 production in PF-S cells is seven times higher than that of PF-C cells (c). MMS does not change the IL-6 production significantly in both PF-S and PF-C cells compared to control groups. However, IMS significantly increases IL-6 production in both PF-S (2-fold) and PF-C cells (8-fold) compared to respective unstretched controls. Under IMS condition, PF-S cells have twice the amount of IL-6 compared to PF-C cells (c). PGE2 level in control PF-S cells is also much higher (5.6-fold) than PF-C cells (d). MMS does not change PGE2 production in both PF-S and PF-C cells; however, IMS significantly increases PGE2 production in both PF-S (2-fold) and PF-C cells (8-fold) compared to respective unstretched controls (d). *p < 0.05.

Similar articles

Cited by

References

    1. Scott SH, Winter DA. Internal forces of chronic running injury sites. Med Sci Sport Exer 1990; 22: 357–369. - PubMed
    1. Carlson RE, Fleming LL, Hutton WC. The biomechanical relationship between the tendoachilles, plantar fascia and metatarsophalangeal joint dorsiflexion angle. Foot Ankle Int 2000; 21: 18–25. - PubMed
    1. Giddings VL, Beaupré GS, Whalen RT, et al. Calcaneal loading during walking and running. Med Sci Sport Exer 2000; 32: 627–634. - PubMed
    1. Erdemir A, Hamel AJ, Fauth AR, et al. Dynamic loading of the plantar aponeurosis in walking. J Bone Joint Surg Am 2004; 86-A: 546–552. - PubMed
    1. Riddle DL, Pulisic M, Pidcoe P, et al. Risk factors for plantar fasciitis: a matched case-control study. J Bone Joint Surg Am 2003; 85-A: 872–877. - PubMed

LinkOut - more resources