. 2018 Oct 2:4:54.
doi: 10.1038/s41421-018-0054-x. eCollection 2018.

Abnormal gametogenesis induced by p53 deficiency promotes tumor progression and drug resistance

Affiliations

Abnormal gametogenesis induced by p53 deficiency promotes tumor progression and drug resistance

Chunfang Liu et al. Cell Discov. .

Abstract

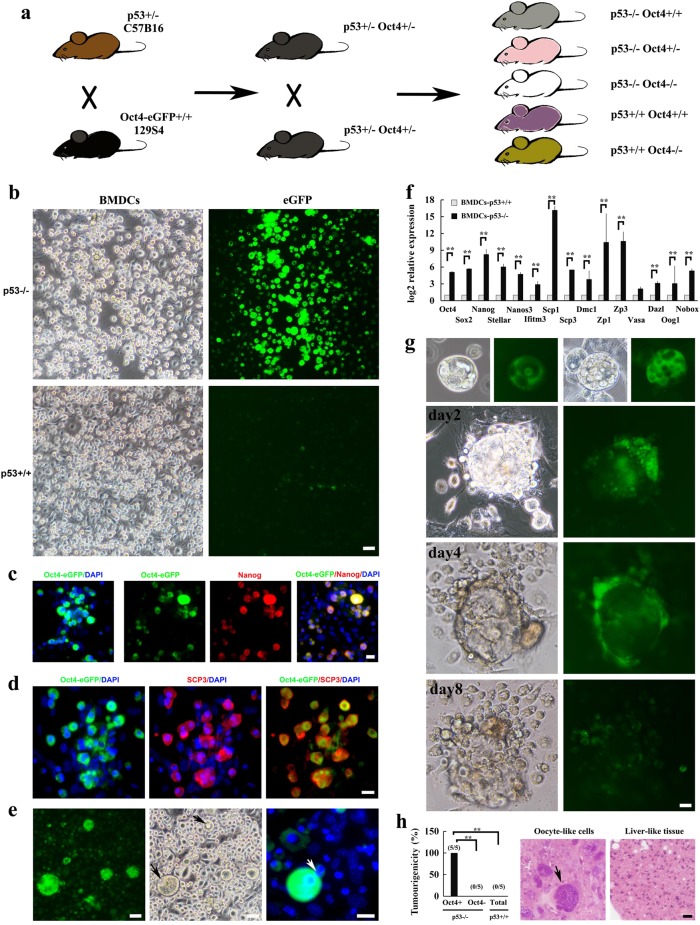
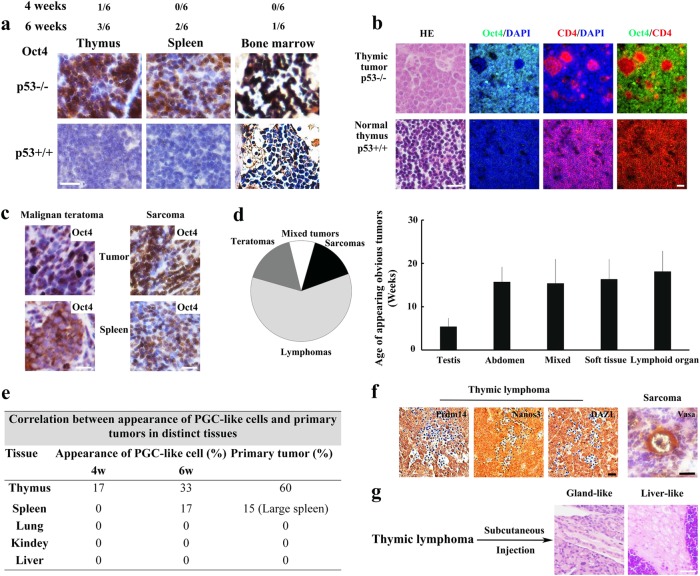
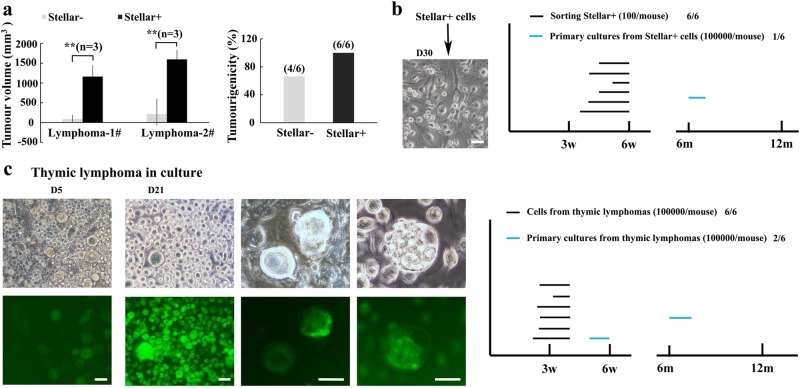
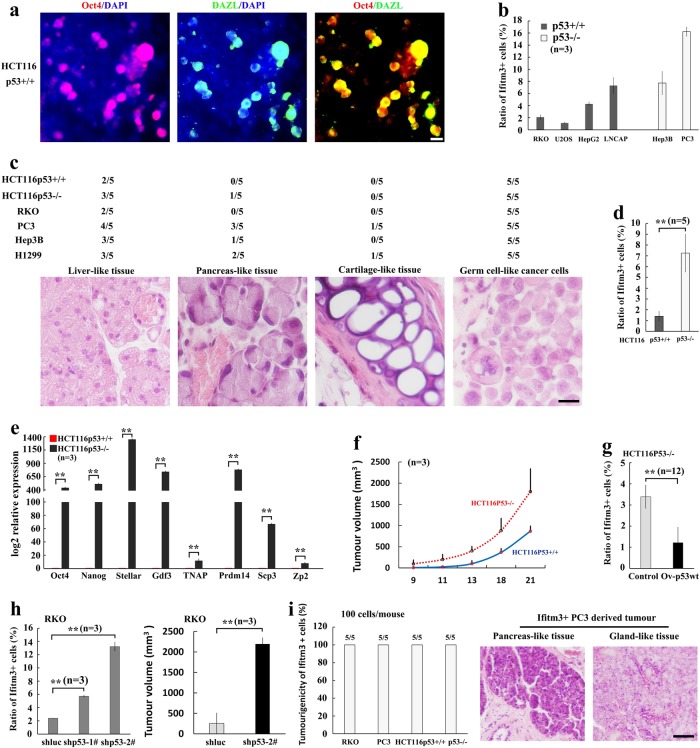
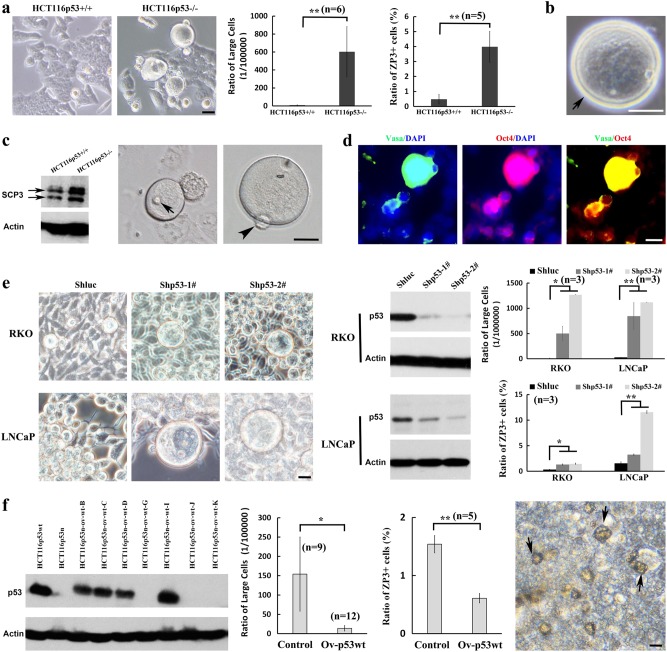
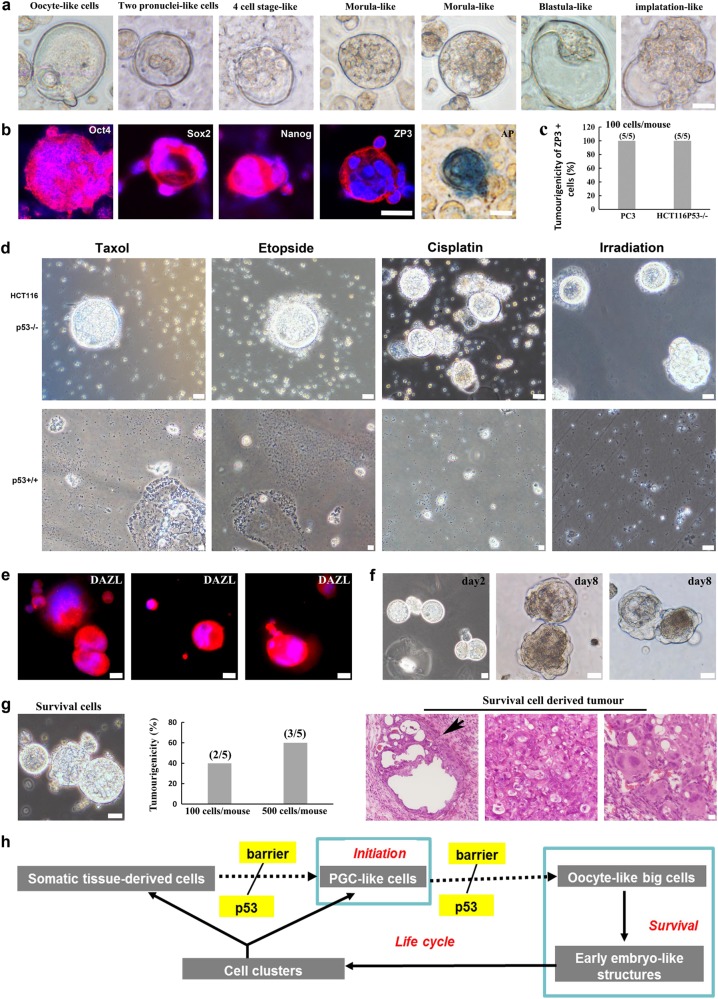
The century-old embryonal/gametogenesis hypothesis of tumors could link diverse tumors' malignant features together likely representing the real "stemness" of tumors. However, the genetic evidence to validate abnormal gametogenesis in tumors remains lacking. Here we show that p53 deficiency elicits abnormal gametogenesis from primordial germ cell-like stage to late oocyte-like stage and subsequent parthenogenetic activation. The similar upregulation of abnormal gametogenesis by p53 deficiency is observed both in p53-/- mouse model and cultured cancer cells. Notably, germ cell-like cells isolated from distinct tumors from p53-/- mice and cancer cell lines display potent tumorigenicity potential. Abnormal oogenesis induced by p53 deficiency and then spontaneous parthenogenetic activation endow tumors with imitated embryonic development, life cycle, and therapeutic resistance. Our study establishes the genetic evidence to support embryonal/gametogenesis theory of tumors and reveals a pivotal role of p53 in restricting abnormal gametogenesis that may represent a novel aspect for p53's tumor suppression.


Conflict of interest statement

The authors declare that they have no conflict of interest.

Figures

Fig. 1
Fig. 1. Abnormal gametogenesis is detected in p53−/− BMDCs.
a The mice-breeding scheme for gametogenesis study was shown. b Bright-field and Oct4-GFP fluorescence image of primary BMDCs derived from p53−/− and p53+/+ mice were shown. c Oct4-GFP fluorescence, Nanog staining image, and DAPI staining image showed the morphology and germ cell marker expression of germ cell-like cells in p53−/− BMDCs. d Oct4-GFP fluorescence and meiosis marker SCP3 staining image in p53−/− BMDCs. e Bright-field, Oct4-GFP fluorescence image and DAPI staining of p53−/− BMDCs showed the oocyte-like cells with germinal vesicle (GV)-like structures (black arrow) and oocyte-like cells with a polar body (PB)-like structure (white arrow). f The qRT-PCR for a series of germ cell markers, including early germ cell markers (Oct4, Sox2, Nanog, Stellar, Nanos3, and Ifitm3), meiosis markers (Scp1, Scp3, and Dmc1), and late germ cell markers (Vasa, Dazl, Oog1, and Nobox) in paired primary BMDCs derived from p53−/− and p53+/+ mice (n = 3). **p < 0.01. g Bright-field and Oct4-GFP fluorescence image showed the embryo-like structures at the different developmental stages in p53−/− BMDCs were seen after sub-culturing at different culture times. h Oct4-GFP+ (100 cells) and Oct4-GFP (100 cells) cells isolated from p53−/− BMDCs or p53+/+ BMDCs (~500 000 cells) with six passage culture were injected subcutaneously into nude mice (5 mice/each group) for tumorigenicity assay (n = 5). **p < 0.01. The representative tumor sections from Oct4-GFP+ p53−/− BMDCs stained with hematoxylin and eosin (H&E). The oocyte-like tumor cell was indicated with arrow (scale bar = 20 μm)
Fig. 2
Fig. 2. Extensive upregulation of abnormal gametogenesis is found in tumors from p53−/− mice.
a Sections of paired normal tissues derived from p53−/− and p53+/+ mice were stained with Oct4 antibody. The relative ratio of obvious Oct4+ cells appeared in the p53−/− mice with different ages was shown. b Sections of paired thymic lymphoma of p53−/− mouse and normal thymus of p53+/+ mouse were stained with H&E or antibodies against the indicated proteins. c Sections of malignant teratoma, spleen, and sarcoma from p53−/− mice were stained with Oct4 antibody. d The pie chart showed the spontaneous tumor types with different percentage in p53−/− mice. The age of tumor formation was counted at the appearance of obvious tumors. The plot showed the age of appearing obvious tumors in the different spontaneous tumor types in p53−/− mice. e The correlation between the appearance of PGC-like cells and tumor formation in a variety of tissues from p53−/− mice. f Section from spontaneous tumors of p53−/− mice were stained with antibody against Prdm14, Nanos3, Vasa, or H&E. Section of sarcoma stained with Vasa antibody showed an oocyte-like tumor cell (arrow). g Sections were stained with H&E (scale bar = 20 μm)
Fig. 3
Fig. 3. PGC-like cells from p53−/− mice show strong tumorigenicity potential.
a In all, 100 Stellar or Stellar+ cells sorted from two different p53−/− lymphomas by FACS were injected subcutaneously into nude mice, and tumor volume was measured at 6 weeks after injection. The plots showed relative tumor volume from paired sorted Stellar and Stellar+ cells within 6 weeks (n = 3). **p < 0.01. b 100 Stellar+ cells after cultured in dish for 30 days. The cultures from the Stellar+ cells after cultured for 30 days were injected subcutaneously into nude mice and tumorigenicity was analyzed. The plot showed the distinct tumorigenicity of sorting Stellar+ cells and cultured Stellar+ cells. c Bright-field and Oct4-GFP fluorescence image of primary cultured thymic lymphomas at different time points. The plot showed the distinct tumorigenicity of total thymic lymphoma cells and primary cultures from thymic lymphoma after cultured for 21 days (scale bar = 40 μm in b and 20 μm in c)
Fig. 4
Fig. 4. Germ cell-like cells are enriched in diverse human cancer cell lines.
a Immunofluorescence assay showed that expression and colocalization of Oct4 and DAZL in a subset of cultured p53+/+ HCT116 cells. b The percentages of Ifitm3+ cells in diverse cancer cell lines with or without p53 were analyzed by flow cytometry (n = 3). c Diverse cancer cell lines were injected subcutaneously into nude mice (1 × 105 cells/mouse), and tumors were collected for H&E staining. The incidence for liver-like tissues, pancreas-like tissues, and cartilage-like tissues was counted. Representative tumor sections from PC3 cells stained with H&E were shown. d The ratio of ifitm3+ in the isogenic wild-type and p53−/− HCT116 cancer cell lines was analyzed by flow cytometry (n = 5), **p < 0.01. e The relative expression of a series of germ cell-related markers in paired p53+/+ and p53−/− HCT116 cells was analyzed by RT-PCR. f The plot showed the tumor growth curve from nude mice injected with p53−/− HCT116 and p53+/+ HCT116 cells. g The relative ratio of Ifitm3+ in p53−/− HCT116 cells with or without p53 restoration from multiple single-cell clones was analyzed by flow cytometry (n = 12). **p < 0.01. h The relative ratio of Ifitm3+ cells in RKO cells with control or p53 knockdown was analyzed by flow cytometry (n = 3). **p < 0.01. Tumor volume from nude mice injected subcutaneously with RKO cells with control or p53 knockdown was shown (n = 3). **p < 0.01. i A total of 100 Ifitm3+ cells isolated from diverse cancer cell lines were injected subcutaneously into nude mice for tumorigenicity assay (n = 5). The tumor sections from PC3 cells were stained with H&E (scale bar = 20 μm)
Fig. 5
Fig. 5. p53 deficiency dictates oocyte-like large cell formation.
a Representative bright-field images of paired p53+/+ and p53−/− HCT116 cultures were shown. The oocyte-like large cells were frequently observed in p53−/− HCT116 cultures (especially >25 μm in diameter). The oocyte-like tumor cells larger than 25 μm in diameter were counted under high-power microscope in p53+/+ and p53−/− HCT116 cultures (n = 6). The relative ratio of ZP3+ cells in p53+/+ and p53−/− HCT116 cultures were analyzed by flow cytometry (n = 5). **p < 0.01. b Representative bright-field image of an oocyte-like cell with zona pellucida-like membrane (arrow) in p53−/− HCT116 cultures was shown. c The immunoblotting showed the expression of meiosis entry related protein SCP3 in p53+/+ and p53−/− HCT116 cells. The oocyte-like tumor cells with GV-like structure (arrow) or polar body-like structure (arrow head) was detected in p53−/− HCT116 cultures. d Immunostaining showed the expression of Oct4 and Vasa in oocyte-like large cells of p53−/− HCT116 cultures. e Bright-field images showed oocyte-like cell appeared in RKO or LNCaP cells with p53 knockdown. The p53 immunoblotting was shown in RKO or LNCaP with control and p53 knockdown. The relative ratio of oocyte-like large cells or ZP3+ cells in RKO or LNCaP with control and p53 knockdown was analyzed by flow cytometry (n = 3). *p < 0.05, **p < 0.01. f Multiple single-cell clones were selected from p53−/− HCT116 cells transfected with p53 for immunoblotting assay. The relative ratio of oocyte-like large cells (n = 9 and 12) and ZP3+ cells (n = 5) in p53−/− HCT116 cells with or without p53 restoration from multiple single-cell clones were analyzed. *p < 0.05, **p < 0.01. Bright-field image showed the appearance of apoptotic cells in the p53−/− HCT116 with p53 restoration (scale bar = 20 μm)
Fig. 6
Fig. 6. Abnormal oogenesis induced by p53 loss contributes to life cycle and therapeutic resistance.
a Bright-field image of an oocyte-like cell and a series of embryo-like structures at different developmental stages in p53−/− HCT116 cultures were shown. Somatic cancer cells were observed to derive from the embryo-like structures. b Cultured p53−/− HCT116 cancer cells with embryo-like structures were stained with antibody against indicated proteins or AP. c Tumor incidence from nude mice injected with 100 ZP3+ cells isolated from PC3 and p53−/− HCT116 cultures was shown. d Bright-field images showed the surviving cells from paired p53+/+ and p53−/− HCT116 cells 4 weeks after distinct genotoxic treatment or 16 days after γ-irradiation. e The surviving cells after taxol treatment were stained with antibody against DAZL (a specific marker for germ cell and early preimplantation embryo). f Surviving p53−/− HCT116 cells after treatment with taxol were cultured in semisolid medium, and bright-field images of spheres at day 2 and day 8 after culturing were shown. The new offspring cancer cells were observed to derive from surviving large cells at day 8 cultured in semisolid medium. g The surviving cells in p53−/− HCT116 cells 4 weeks after taxol treatment were shown in the bright field. The surviving large cells were injected subcutaneously into nude mice for tumorigenesis assay (n = 5). The tumor incidence within 4 months was shown. Tumor sections stained with H&E showed the embryonic body-like structures (arrow) and germ cell-like cells. h The working model showed p53 deficiency promotes abnormal life cycle and gametogenesis (scale bar = 20 μm)

Similar articles

Cited by

References

    1. Bignold, L. P., Coghlan, B. L. & Jersmann, H. P. Hansemann, Boveri, chromosomes and the gametogenesis-related theories of tumours. Cell Biol. Int.30, 640–644 (2006). - PubMed
    1. Old LJ. Cancer/testis (CT) antigens—a new link between gametogenesis and cancer. Cancer Immun. 2001;1:1. - PubMed
    1. Simpson AJ, Caballero OL, Jungbluth A, Chen YT, Old LJ. Cancer/testis antigens, gametogenesis and cancer. Nat. Rev. Cancer. 2005;5:615–625. doi: 10.1038/nrc1669. - DOI - PubMed
    1. Chung JY, et al. Synaptonemal complex protein 3 as a novel prognostic marker in early stage non-small cell lung cancer. Hum. Pathol. 2013;44:472–479. doi: 10.1016/j.humpath.2012.06.018. - DOI - PMC - PubMed
    1. Erenpreisa J, et al. The “virgin birth”, polyploidy, and the origin of cancer. Oncoscience. 2015;2:3–14. doi: 10.18632/oncoscience.108. - DOI - PMC - PubMed