. 2018 Sep 26:4:41.
doi: 10.1038/s41420-018-0103-0. eCollection 2018.

Inhibition of glioblastoma cell proliferation, invasion, and mechanism of action of a novel hydroxamic acid hybrid molecule

Affiliations

Inhibition of glioblastoma cell proliferation, invasion, and mechanism of action of a novel hydroxamic acid hybrid molecule

Issan Zhang et al. Cell Death Discov. .

Erratum in

Abstract

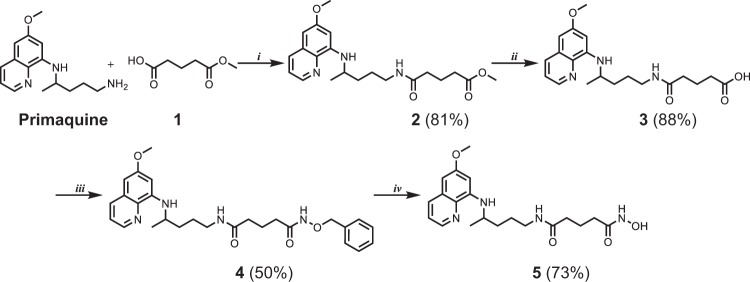
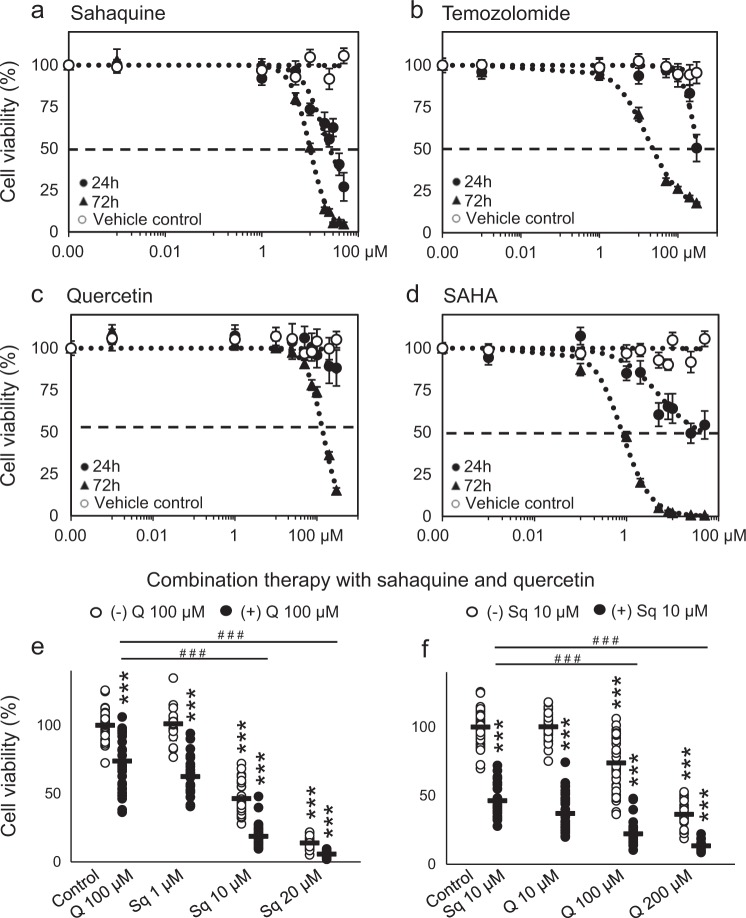
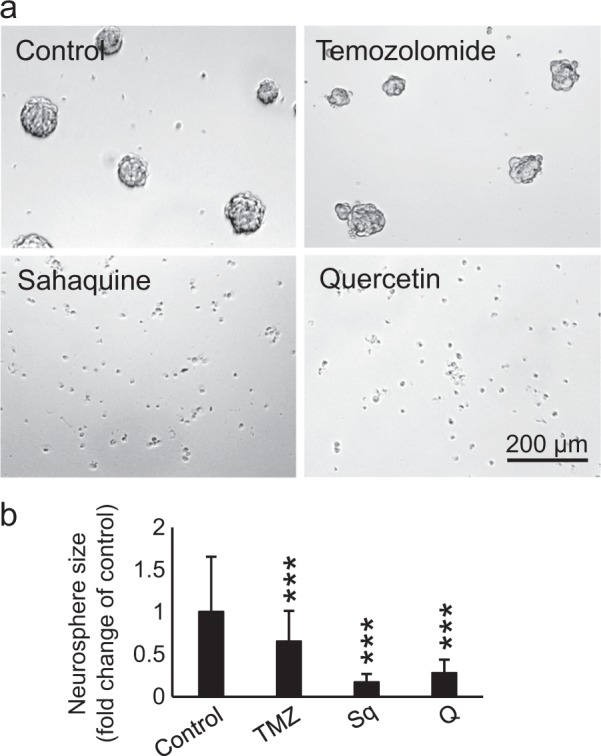
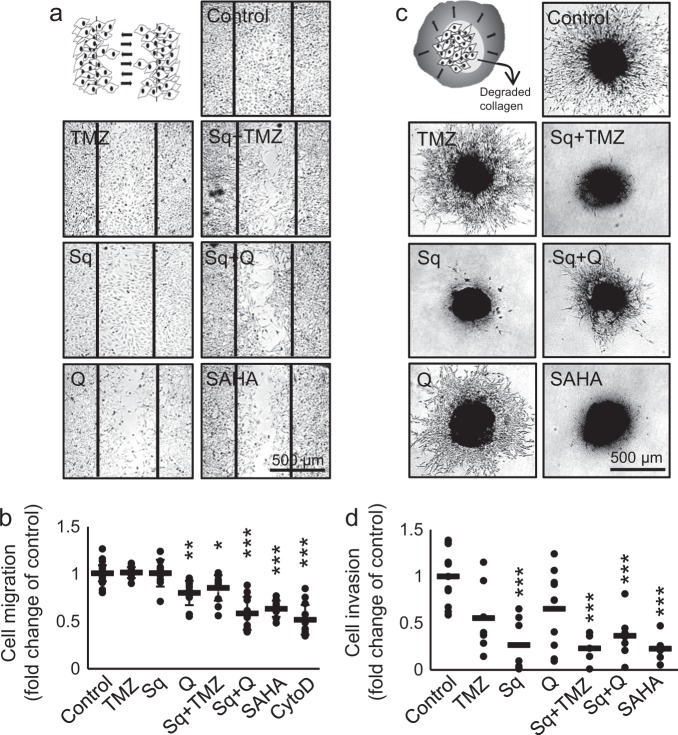
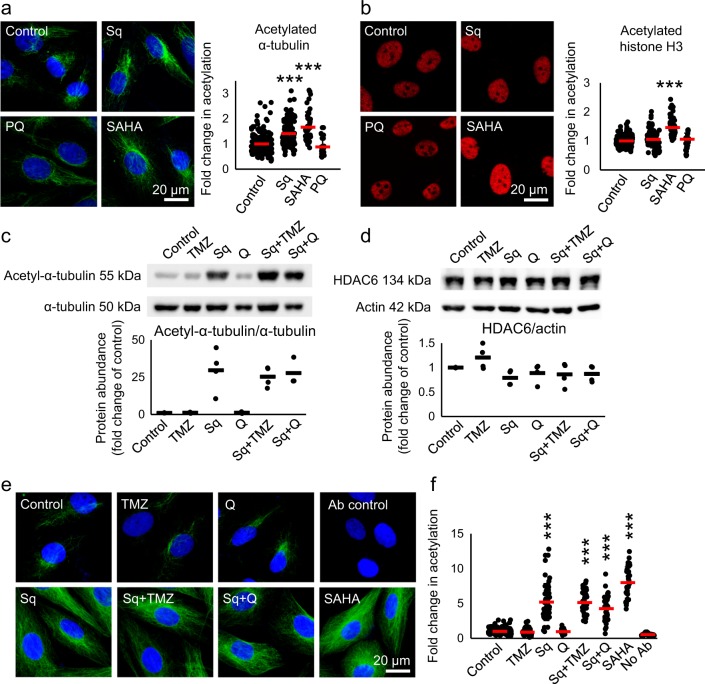
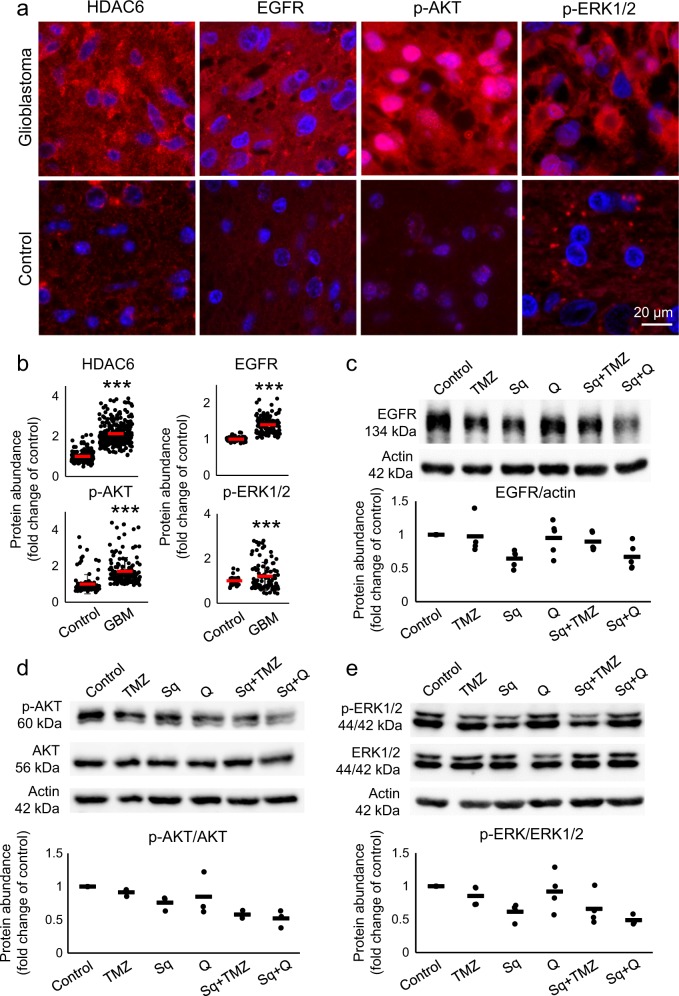
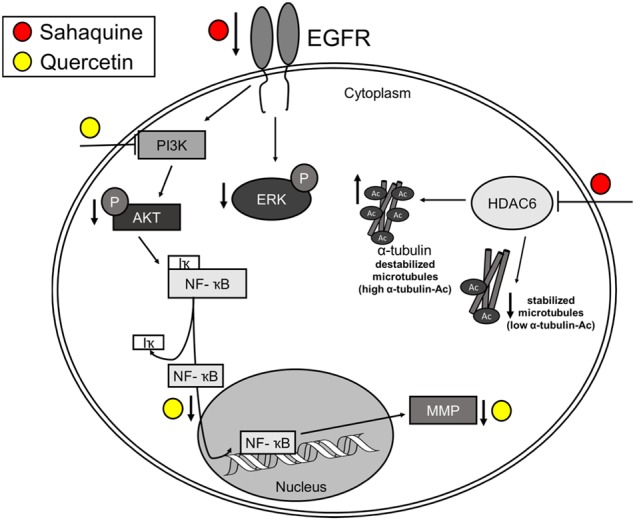
Glioblastoma multiforme is one of the most aggressive brain tumors and current therapies with temozolomide or suberoylanilide hydroxamic acid (SAHA, vorinostat) show considerable limitations. SAHA is a histone deacetylase (HDAC) inhibitor that can cause undesirable side effects due to the lack of selectivity. We show here properties of a novel hybrid molecule, sahaquine, which selectively inhibits cytoplasmic HDAC6 at nanomolar concentrations without markedly suppressing class I HDACs. Inhibition of HDAC6 leads to significant α-tubulin acetylation, thereby impairing cytoskeletal organization in glioblastoma cells. The primaquine moiety of sahaquine reduced the activity of P-glycoprotein, which contributes to glioblastoma multiforme drug resistance. We propose the mechanism of action of sahaquine to implicate HDAC6 inhibition together with suppression of epidermal growth factor receptor and downstream kinase activity, which are prominent therapeutic targets in glioblastoma multiforme. Sahaquine significantly reduces the viability and invasiveness of glioblastoma tumoroids, as well as brain tumor stem cells, which are key to tumor survival and recurrence. These effects are augmented with the combination of sahaquine with temozolomide, the natural compound quercetin or buthionine sulfoximine, an inhibitor of glutathione biosynthesis. Thus, a combination of agents disrupting glioblastoma and brain tumor stem cell homeostasis provides an effective anti-cancer intervention.


Conflict of interest statement

The authors declare that they have no conflict of interest.

Figures

Figure 1
Figure 1. Synthesis of sahaquine and its precursors.
Reagents and conditions: (i) HATU, DIEA, dichloromethane, 1 h, (ii) LiOH, methanol, H2O, 1 h, (iii) O-benzylhydroxylamine, HATU, DIEA, dichloromethane, 2 h, (iv) H2, 10% Pd/C, methanol, 4 h. All reactions were performed at room temperature. Yields are shown in brackets. HATU 1-[bis(dimethylamino)methylene]-1H-1,2,3-triazolo[4,5-b]pyridinium 3-oxid hexafluorophosphate, DIEA N,N-diisopropylethylamine, LiOH lithium hydroxide)
Figure 2
Figure 2. Sahaquine kills human glioblastoma cells in a dose-dependent and time-dependent manner.
GBM cell viability (n = 9) following treatment with a sahaquine (Sq, 0.001–50 µM), b temozolomide (TMZ, 0.001–500 µM), c quercetin (Q, 0.001–300 µM), and d SAHA (0.001–50 µM) for 24 or 72 h. Shown is the mean (SEM) percentage cell viability compared to untreated controls from three independent experiments. e, f Dose-dependent decrease in cell viability (72 h) with the combination of either a fixed concentration of quercetin (100 µM, n = 41) and increasing concentrations of sahaquine (Sq 1 µM, n = 21, Sq 10 µM, n = 30, Sq 20 µM, n = 21, Sq 1 µM + Q, n = 25, Sq 10 µM + Q, n = 29, Sq 20 µM + Q, n = 27), or a fixed concentration of sahaquine (10 µM n = 30) and increasing concentrations of quercetin (Q 10 µM, n = 37, Q 100 µM, n = 41, Q 200 µM, n = 28, Q 10 µM + Sq, n = 34, Q 100 µM + Sq, n = 35, Q 200 µM + Sq, n = 21). Each point represents a percentage value normalized to the untreated control (e n = 47, f n = 125). Horizontal bars represent the mean (SD) from at least three independent experiments (***p < 0.001 compared to the untreated control; ###p < 0.001 compared to e Q 100 µM alone or f Sq 10 µM alone; Welch’s ANOVA with Games–Howell post hoc test). Cell viability was measured by counting Hoechst 33342-labeled nuclei imaged using a fluorescence microscope
Figure 3
Figure 3. Sahaquine and quercetin are most effective in killing human brain cancer stem cells.
a Representative micrographs of BTSCs treated with temozolomide (100 μM, n = 99), sahaquine (10 μM, n = 183) or quercetin (100 μM, n = 264) for 7 days. b The surface area of neurospheres was measured based on 2D micrographs from three independent experiments. Shown are average values (SD) normalized to the untreated controls (set to 1, n = 334) (***p < 0.001, Welch’s ANOVA with Games–Howell post hoc test)
Figure 4
Figure 4. Sahaquine inhibits human glioblastoma cell migration and invasion.
Cell migration was measured using the scratch assay, as schematically represented in a. Representative micrographs show migration of cells into the scratch (delineated by vertical black bars) after treatment with temozolomide (100 µM, n = 12), sahaquine (Sq, 10 µM, n = 10), quercetin (Q, 100 µM, n = 12) or SAHA (10 µM, n = 10), alone or in combination (Sq + TMZ, n = 12; Sq + Q, n = 12) for 24 h. Cytochalasin D (40 nM, n = 13) served as a positive control. b Cell migration was quantified as the area covered by migrating cells. Each point represents a value normalized to the untreated control (set to 1, n = 35). Horizontal bars represent the mean (SD) from at least three independent experiments (*p < 0.05, **p < 0.01, ***p < 0.001, Welch’s ANOVA with Games–Howell post hoc test). c Cell invasion was measured from the radial movement of cells from 3D tumoroids embedded in a collagen matrix, as schematically represented in the first panel. Representative micrographs show cell movement from 3D tumoroids treated with temozolomide (100 µM, n = 7), sahaquine (Sq, 10 µM, n = 7), quercetin (Q, 100 µM, n = 10), or SAHA (10 µM, n = 5), alone or in combination (Sq + TMZ, n = 5; Sq + Q, n = 8) after 4 days. d Cell invasion was quantified from the area covered by invading cells. Each point represents a value normalized to the untreated control (set to 1, n = 11). Horizontal bars represent the mean from at least three independent experiments (***p < 0.001, two-tailed one-way ANOVA with Tukey–Kramer’s post hoc test)
Figure 5
Figure 5. Sahaquine-mediated HDAC6 inhibition results in selective α-tubulin hyperacetylation at nanomolar concentrations.
a Representative fluorescence micrographs of GBM α-tubulin acetylation (green) at lysine 40 in response to sahaquine (Sq, 100 nM, n = 121 cells), SAHA (100 nM, n = 54 cells) or primaquine (PQ, 10 µM, n = 30 cells) treatment for 24 h. b Representative fluorescence micrographs of GBM histone H3 acetylation (red) at lysine 9/lysine 14 in response to sahaquine (Sq, 100 nM, n = 120 cells), SAHA (100 nM, n = 90 cells) or primaquine (PQ, 10 µM, n = 83 cells) for 24 h. Nuclei (blue) were labeled with Hoechst 33342. Cells were imaged using a fluorescence microscope and fluorescence was analyzed in ImageJ. Shown are averages of fluorescence per cell (SD) normalized to the untreated controls (set to 1) from at least three independent experiments (***p < 0.001, Welch’s ANOVA with Games–Howell post hoc test). c Acetylated α-tubulin (n = 3) and d HDAC6 protein abundance (n = 4) in GBM cells treated with temozolomide (TMZ, 100 µM), sahaquine (Sq, 10 µM) or quercetin (Q, 100 µM) alone or in combination for 24 h, measured by Western blotting. Acetylated α-tubulin and HDAC6 were normalized to total α-tubulin and actin, respectively. Each point represents a value normalized to the untreated control (set to 1). Horizontal bars represent the mean from at least three independent experiments. e Representative fluorescence micrographs of GBM α-tubulin acetylation (green) at lysine 40 in response to temozolomide (TMZ, 100 µM, n = 76 cells), sahaquine (Sq, 10 µM, n = 56 cells), quercetin (Q, 100 µM, n = 32 cells) or SAHA (10 µM, n = 36 cells) alone or in combination for 24 h. Nuclei (blue) were labeled with Hoechst 33342. f Shown are averages (SD) of fluorescence per cell normalized to the untreated control (set to 1, n = 197 cells) from at least three independent experiments (***p < 0.001, Welch’s ANOVA with Games–Howell post hoc test)
Figure 6
Figure 6. Sahaquine reduces EGFR abundance and AKT/ERK1/2 phosphorylation in human glioblastoma.
a Representative fluorescence micrographs of human brain sections (GBM or healthy control) labeled for HDAC6, EGFR, phosphorylated AKT (p-AKT), or dually phosphorylated ERK1/2 (p-ERK1/2). Nuclei (blue) were labeled with Hoechst 33342. Cells were imaged using a fluorescence microscope and fluorescence was analyzed in ImageJ. b Horizontal bars represent averages of fluorescence per cell (SD) for HDAC6 (control, n = 181 cells, GBM, n = 272 cells), EGFR (control, n = 94 cells, GBM, n = 116 cells), p-AKT (control, n = 115 cells, GBM, n = 147 cells) and p-ERK1/2 (control, n = 35 cells, GBM, n = 104 cells). Each point represents a value normalized to the healthy control (set to 1) (***p < 0.001, Welch’s ANOVA with Games–Howell post hoc test). c EGFR (TMZ, n = 4, Sq, n = 5, Q, n = 5, Sq + TMZ, n = 5, Sq + Q, n = 5), d phosphorylated AKT (n = 3), and e phosphorylated ERK1/2 (TMZ, n = 4, Sq, n = 4, Q, n = 4, Sq + TMZ, n = 4, Sq + Q, n = 3) protein abundances were measured in GBM cells treated with temozolomide (TMZ, 100 µM), sahaquine (Sq, 10 µM), or quercetin (Q, 100 µM) alone or in combination for 24 h, by Western blotting. EGFR protein abundance was normalized to the actin loading control. Phosphorylated AKT and ERK1/2 were normalized to total AKT and total ERK1/2, respectively. Each point represents a value normalized to the untreated control (set to 1). Horizontal bars represent means from at least three independent experiments
Figure 7
Figure 7
Proposed mechanism of action of sahaquine and quercetin in GBM

References

    1. Weller M, et al. European Association for Neuro-Oncology (EANO) guideline on the diagnosis and treatment of adult astrocytic and oligodendroglial gliomas. Lancet Oncol. 2017;18:e315–e329. doi: 10.1016/S1470-2045(17)30194-8. - DOI - PubMed
    1. Weller M, et al. MGMT promoter methylation in malignant gliomas: ready for personalized medicine? Nat. Rev. Neurol. 2010;6:39–51. doi: 10.1038/nrneurol.2009.197. - DOI - PubMed
    1. Hegi ME, et al. MGMT gene silencing and benefit from temozolomide in glioblastoma. N. Engl. J. Med. 2005;352:997–1003. doi: 10.1056/NEJMoa043331. - DOI - PubMed
    1. Erasimus H, Gobin M, Niclou S, Van Dyck E. DNA repair mechanisms and their clinical impact in glioblastoma. Mutat. Res. Rev. Mutat. Res. 2016;769:19–35. doi: 10.1016/j.mrrev.2016.05.005. - DOI - PubMed
    1. Johnstone RW. Histone-deacetylase inhibitors: novel drugs for the treatment of cancer. Nat. Rev. Drug Discov. 2002;1:287–299. doi: 10.1038/nrd772. - DOI - PubMed