. 2018 Oct 3:4:43.
doi: 10.1038/s41420-018-0107-9. eCollection 2018.

Basal and starvation-induced autophagy mediates parasite survival during intraerythrocytic stages of Plasmodium falciparum

Affiliations

Basal and starvation-induced autophagy mediates parasite survival during intraerythrocytic stages of Plasmodium falciparum

Shiny Joy et al. Cell Death Discov. .

Erratum in

Abstract

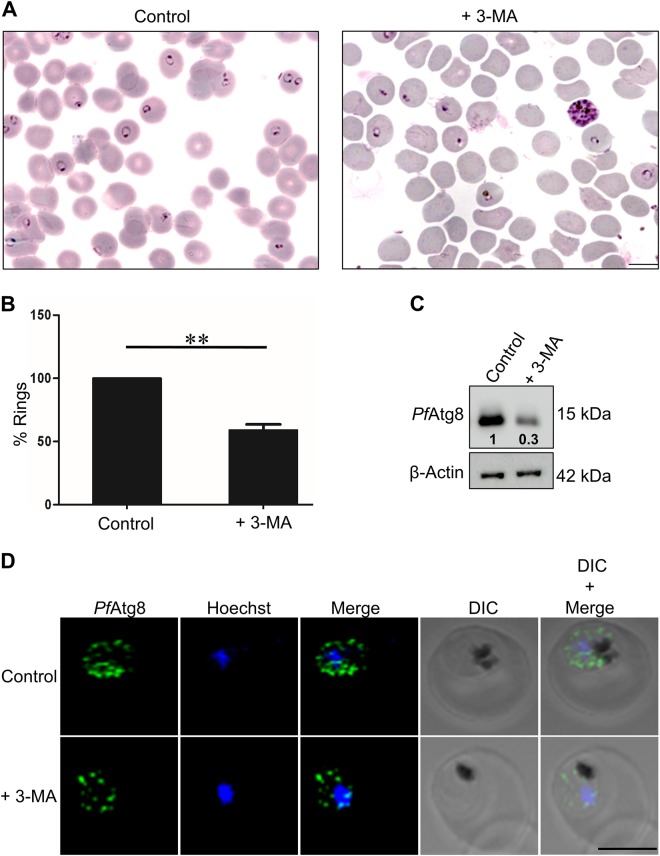
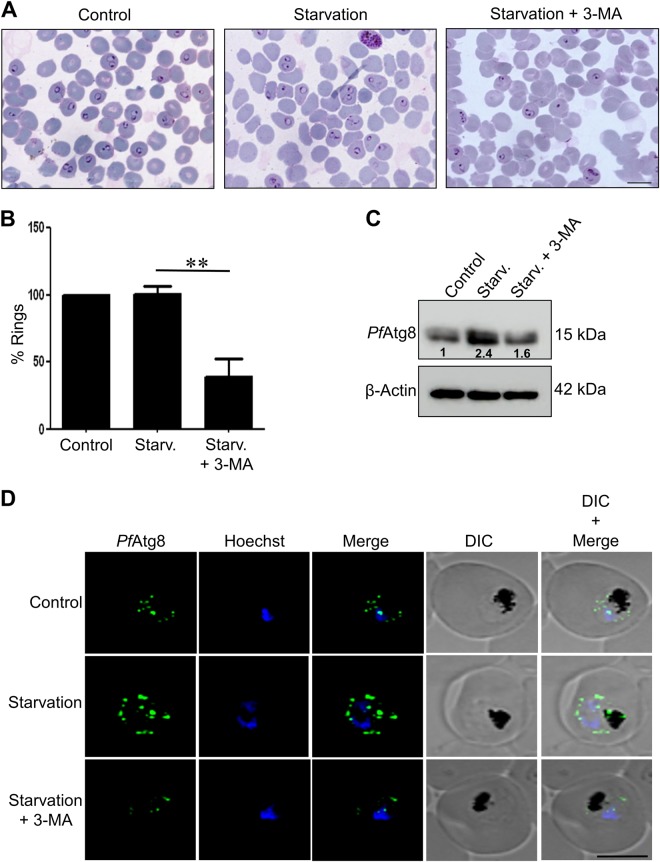
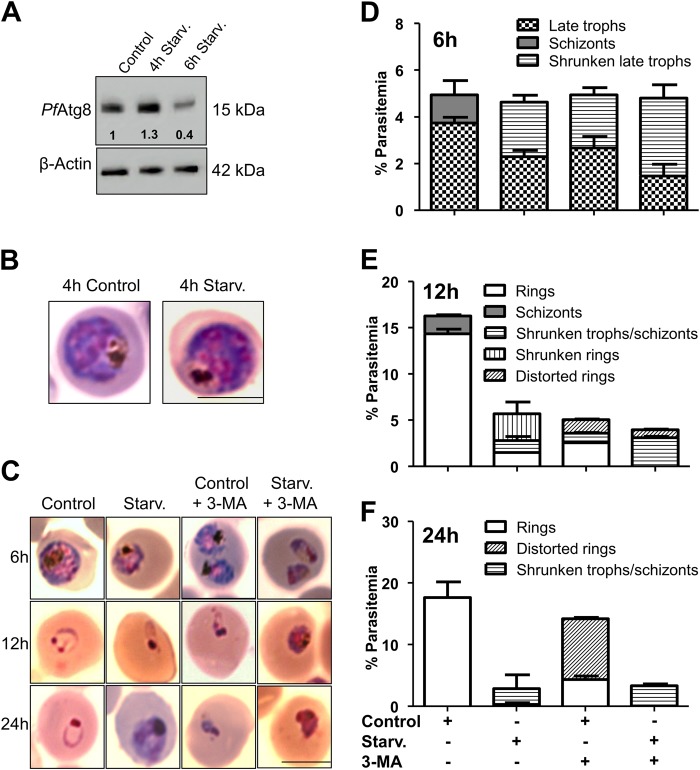
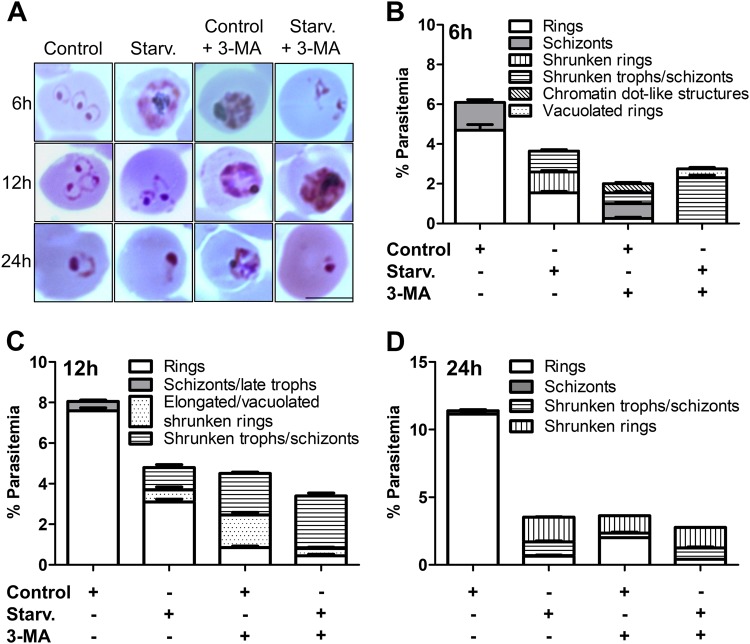
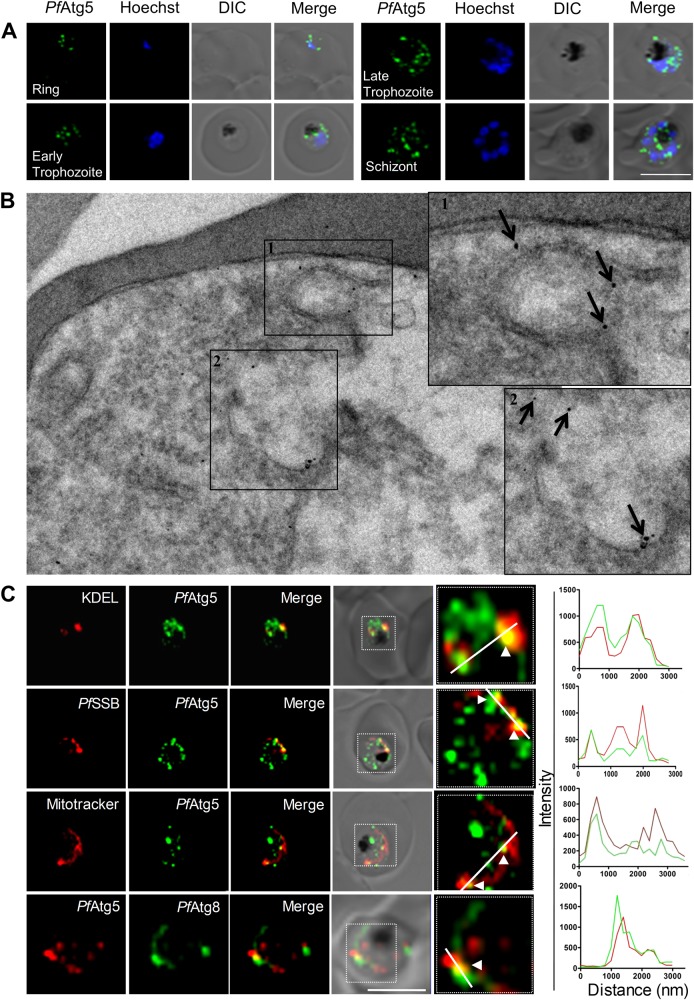
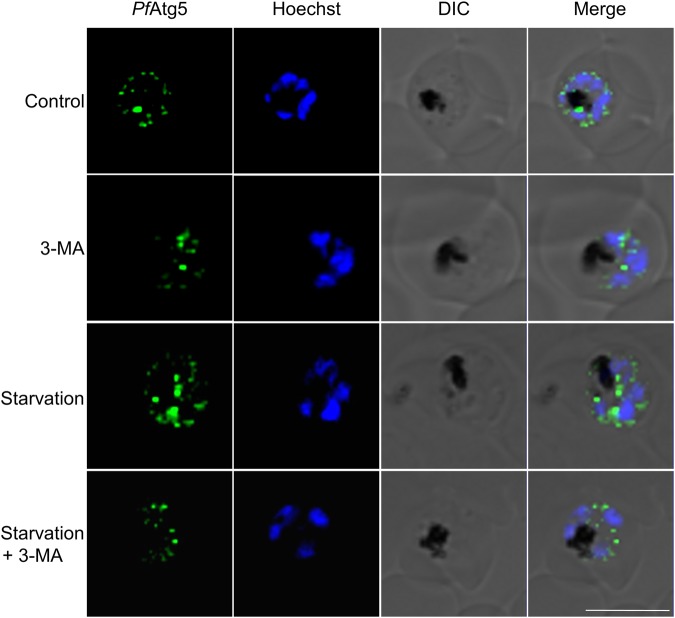
The precise role of autophagy in P. falciparum remains largely unknown. Although a limited number of autophagy genes have been identified in this apicomplexan, only PfAtg8 has been characterized to a certain extent. On the basis of the expression levels of PfAtg8 and the putative PfAtg5, we report that the basal autophagy in this parasite is quite robust and mediates not only the intraerythrocytic development but also fresh invasion of red blood cells (RBCs) in the subsequent cycles. We demonstrate that the basal autophagy responds to both inducers and inhibitors of autophagy. In addition, the parasite survival upon starvation is temporally governed by the autophagy status. Brief periods of starvation, which induces autophagy, help survival while prolonged starvation decreases autophagy leading to stalled parasite growth and reduced invasion. Thus, starvation-induced autophagy is context dependent. Importantly, we report characterization of another autophagy marker in this parasite, the putative PfAtg5 (Pf3D7_1430400). PfAtg5 is expressed in all the intraerythrocytic stages and partially colocalizes with ER, mitochondria, apicoplast and PfAtg8. It is also present on the double membrane bound vesicles. Altogether, these studies pave way for the detailed dissection of P. falciparum autophagy machinery and insights into molecular and functional characterization of its players for developing new therapeutics as antimalarials.


Conflict of interest statement

The authors declare no potential conflict of interest.

Figures

Fig. 1
Fig. 1. Inhibition of basal autophagy results in reduced reinvasion and PfAtg8 expression.
a Giemsa stained smears showing rings in control and 3-MA treated parasites. Highly synchronized parasites at late schizonts stage (38 h.p.i) were incubated in complete medium (control) with or without 3-MA (5 mM) for 2 h, and invasion was monitored by counting number of rings in the next cycle. Scale bar: 10 µm. b Graph representing percent rings in control and 3-MA treated parasites. The data presented are mean of 5 individual experiments. Error bars show the standard deviation. **P< 0.05. c Immunoblot analysis of PfAtg8 expression levels. Lysates were prepared from tightly synchronized parasites at trophozoite stage incubated in complete medium with or without 3-MA for 2 h. Immunoblot was probed using custom generated anti-PfAtg8 antibodies.β-actin was probed as loading control. Number below the bands indicate fold difference as compared to the normalized control. Uncropped blots are shown in Supplementary Figure 5. d PfAtg8 immunofluorescence staining in control and 3-MA treated parasites. Hoechst was used as a DNA marker. Scale bar: 5 µm
Fig. 2
Fig. 2. Starvation-induced autophagy mediates parasite invasion.
a Giemsa stained smears showing rings in ensuing invasion of fresh RBCs in control, starved and starved parasites treated with 3-MA (5 mM, 2 h). Highly synchronized parasites at late schizont stage (38 h.p.i) were incubated in control, starvation medium (complete medium devoid of serum and amino acids) with or without 3-MA (5 mM) for 2 h, and number of rings in parasites were counted in ensuing invasion. Scale bar:10 µm. b Graph representing percent rings in parasites grown in control, starvation or starvation medium with 3-MA. The data represented are mean of 5 individual experiments (200 parasites counted in each experiment). Error bars show standard deviation. **P< 0.05. c Immunoblot analysis of PfAtg8 expression levels. Lysates from trophozoites were prepared from control or starved parasites treated with or without 3-MA and probed using anti-PfAtg8 antibodies.β-actin was used as loading control. Number below the bands indicate fold difference compared to the normalized control. Uncropped blots are shown in Supplementary Figure 5. d Immunofluorescence staining of PfAtg8 in parasites incubated for 2 h in control, starvation or starvation medium with 3-MA (5 mM). Hoechst was used as a DNA marker. Scale bar: 5 µm
Fig. 3
Fig. 3. Duration of starvation-induced autophagy determines parasite survival.
a Immunoblot analysis of PfAtg8 expression levels upon 4 and 6 h starvation. Lysates from trophozoite stage parasites cultured in complete or starvation medium for 4 and 6 h were analyzed using immunoblotting by probing with custom generated anti-PfAtg8 antibodies. Uncropped blots are shown in Supplementary Figure 6. b Morphological features of control and 4 h starved parasites stained with Giemsa. Scale bar: 5 µm. c Prolonged starvation induces abnormal morphology. Parasites at late trophozoite stage were incubated in control, control + 3-MA, starvation or starvation + 3-MA media for 6, 12 and 24 h. Parasite morphology was assessed in Giemsa stained smears. Scale bar:5 µm. df Graph representing parasites with starvation-induced morphological changes after 6, 12 and 24 h incubation in control, control + 3-MA, starvation or starvation + 3-MA media. Data represented is mean of 5 individual experiments. Number of parasites scored for morphology, n = 2500. Error bars show standard deviation
Fig. 4
Fig. 4. Long-term starvation inhibits reinvasion of host RBCs.
a Giemsa stained smears showing rings in representative iRBCs. Highly synchronized schizonts were incubated in complete or starvation medium in presence or absence of 3-MA for 6, 12 and 24 h. Giemsa stained smears were assessed for number of rings and parasite morphology. Scale bar: 5 µm. b As described in (a), morphological analysis of the parasites after various treatments at different time points were carried out. Graphs representing % parasitemia for these three time points are shown in bd. The data represented are mean of 5 individual experiments. Number of parasites scored for rings, n = 2500. Error bars show standard deviation
Fig. 5
Fig. 5. The putative PfAtg5 is expressed throughout the intraerythrocytic cycle and appears as puncta in the parasite cytosol.
a PfAtg5 immunofluorescence staining at various intraerythrocytic stages. Tightly synchronized parasites at ring, early trophozoite, late trophozoite and schizont stage were immunolabeled with anti-PfAtg5 antibodies. Representative image from at least 20 parasites is shown. Hoechst was used as a DNA marker. Scale bar: 5 µm. b RBCs infected with P. falciparum (8% parasitemia) were analyzed by immunoelectron microscopy (immunogold and silver enhancement method) with antibody against PfAtg5. Insets 1 and 2 show enlarged images of Atg5 decorated double membrane structures. Scale bar: 0.2 μm. c Synchronized parasites at trophozoite stage were immunolabeled with anti-PfAtg5 antibodies (1:400) along with various organelle markers: Anti-KDEL antibody (1:200) as an endoplasmic reticulum marker, Anti-PfSSB antibody (1:200) as an apicoplast marker, MitoTracker Red CMXROS (100 nM) as a marker for mitochondria and Anti-PfAtg8 antibody as a marker for autophagosomes. Hoechst was used as DNA marker; Scale bar: 5 µm
Fig. 6
Fig. 6. PfAtg5 expression too is induced by short-term starvation and inhibited by 3-MA.
Immunofluorescence staining of PfAtg5 in parasites incubated in control, starvation, control + 3-MA or starvation + 3-MA media for 2 h. Representative image from at least 20 parasites is shown. Hoechst was used as DNA marker. Scale bar: 5 µm

References

    1. Klionsky DJ, et al. A comprehensive glossary of autophagy-related molecules and processes (2nd edition) Autophagy. 2014;7:1273–1294. doi: 10.4161/auto.7.11.17661. - DOI - PMC - PubMed
    1. He C, Klionsky DJ. Regulation mechanisms and signaling pathways of autophagy. Annu. Rev. Genet. 2009;43:67–93. doi: 10.1146/annurev-genet-102808-114910. - DOI - PMC - PubMed
    1. Brennand A, et al. Autophagy in parasitic protists: Unique features and drug targets. Mol. Biochem. Parasitol. 2011;177:83–99. doi: 10.1016/j.molbiopara.2011.02.003. - DOI - PubMed
    1. Navale R, Atul, Allanki AD, Sijwali PS. Characterization of the autophagy marker protein Atg8 reveals atypical features of autophagy in Plasmodium falciparum. PLoS ONE. 2014;9:e113220. doi: 10.1371/journal.pone.0113220. - DOI - PMC - PubMed
    1. Kitamura K, et al. Autophagy-related Atg8 localizes to the apicoplast of the human malaria parasite Plasmodium falciparum. PLoS ONE. 2012;7:e42977. doi: 10.1371/journal.pone.0042977. - DOI - PMC - PubMed