. 2018 Oct 3:3:41.
doi: 10.1038/s41541-018-0078-0. eCollection 2018.

System immunology-based identification of blood transcriptional modules correlating to antibody responses in sheep

Affiliations

System immunology-based identification of blood transcriptional modules correlating to antibody responses in sheep

Roman Othmar Braun et al. NPJ Vaccines. .

Erratum in

Abstract

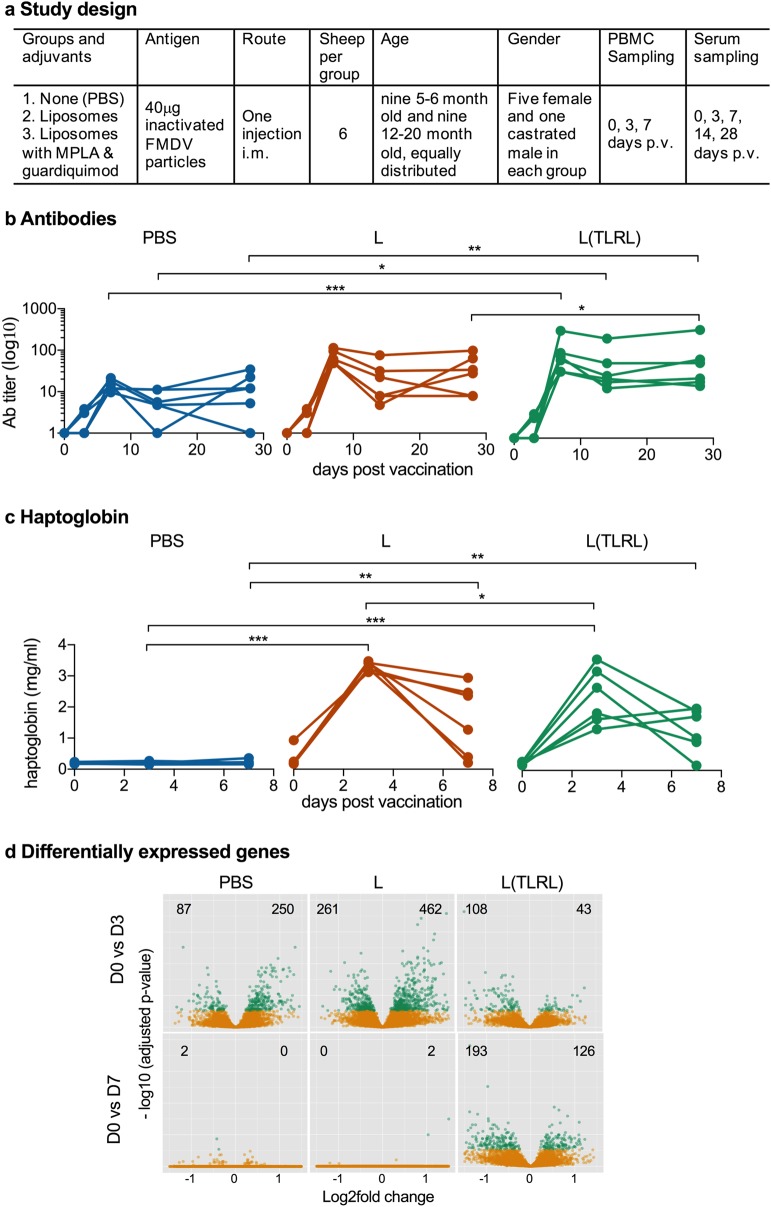
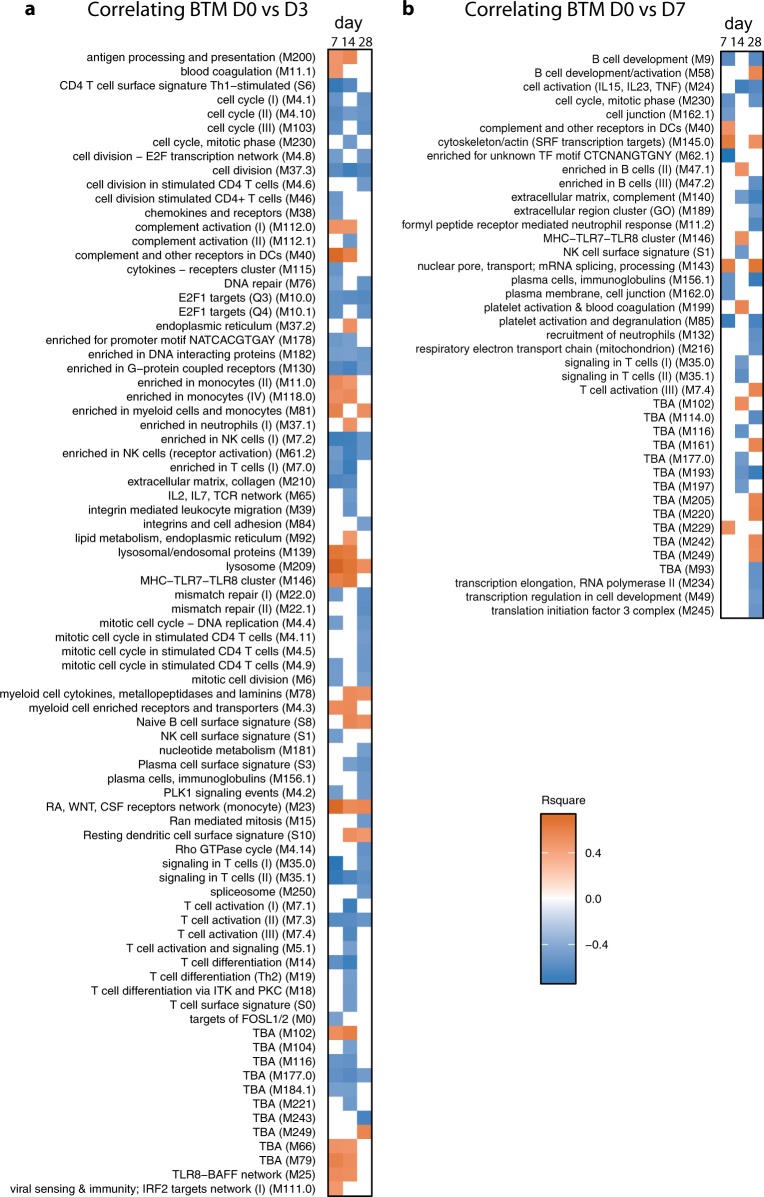
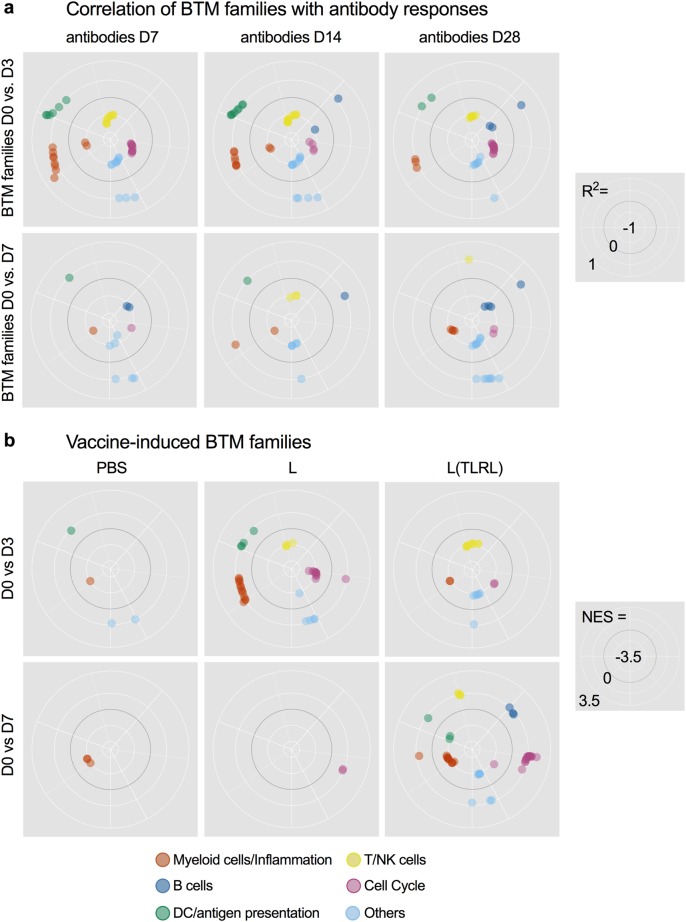
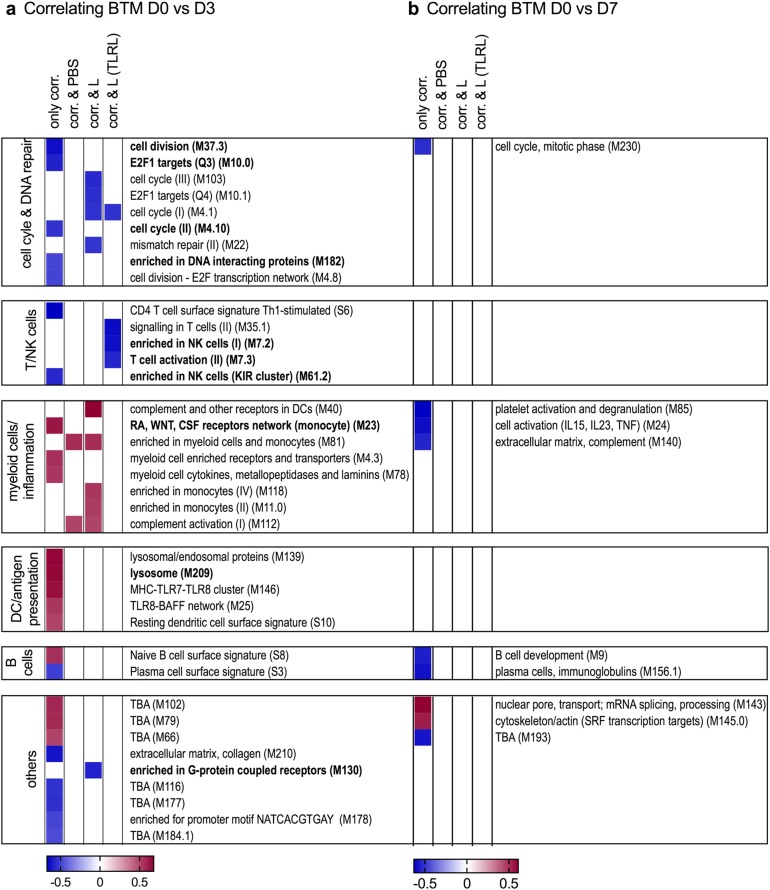
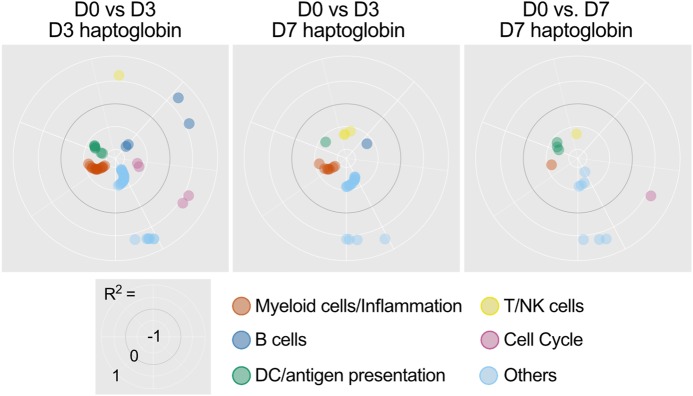
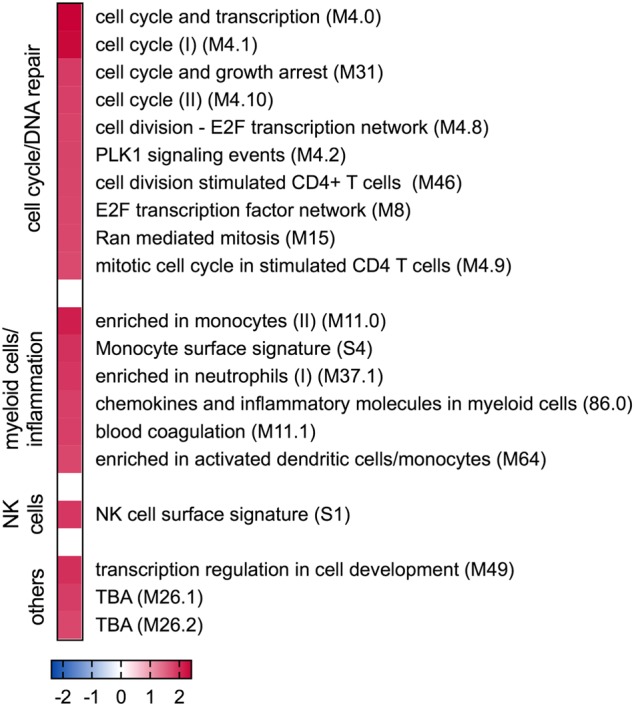
Inactivated vaccines lack immunogenicity and therefore require potent adjuvants. To understand the in vivo effects of adjuvants, we used a system immunology-based analysis of ovine blood transcriptional modules (BTMs) to dissect innate immune responses relating to either antibody or haptoglobin levels. Using inactivated foot-and-mouth disease virus as an antigen, we compared non-adjuvanted to liposomal-formulated vaccines complemented or not with TLR4 and TLR7 ligands. Early after vaccination, BTM relating to myeloid cells, innate immune responses, dendritic cells, and antigen presentation correlated positively, whereas BTM relating to T and natural killer cells, as well as cell cycle correlated negatively with antibody responses. Interestingly, similar BTM also correlated with haptoglobin, but in a reversed manner, indicating that acute systemic inflammation is not beneficial for early antibody responses. Analysis of vaccine-dependent BTM modulation showed that liposomal formulations induced similar responses to those correlating to antibody levels. Surprisingly, the addition of the TLR ligands appeared to reduce early immunological perturbations and mediated anti-inflammatory effects, despite promoting antibody responses. When pre-vaccination BTM were analyzed, we found that high vaccine responders expressed higher levels of many BTM relating to cell cycle, antigen-presenting cells, and innate responses as compared with low responders. In conclusion, we have transferred human BTM to sheep and identified early vaccine-induced responses associated with antibody levels or unwanted inflammation in a heterogeneous and small group of animals. Such readouts are applicable to other veterinary species and very useful to identify efficient vaccine adjuvants, their mechanism of action, and factors related to low responders.


Conflict of interest statement

The authors declare no competing interests.

Figures

Fig. 1
Fig. 1
Neutralizing antibodies, haptoglobin and differentially expressed genes in PBMC induced by vaccination. a Study design. b Serum neutralizing antibody titers following vaccination of sheep with antigen in phosphate buffered saline (PBS), antigen formulated in liposomes (L) and antigen formulated in liposomes with TLRL (L(TLRL)). c Vaccine-induced haptoglobin responses. d Vulcano plots showing differentially expressed genes which were up- or downregulation on day 3 (D3) and day 7 (D7) compared with before immunization, respectively. Green dots represent significant genes (p adjusted < 0.05). Digits in the plots indicate the number of significantly down or upregulated genes. In b and c, statistical significant differences between two groups were calculated using unpaired two-way ANOVA with repeated measures followed by Tukey’s multiple comparisons test (***p < 0.001; **p < 0.002; *p < 0.033)
Fig. 2
Fig. 2
BTM correlating to serum neutralizing antibody titers. a Heatmap showing the correlation of D3 BTM with antibody levels on day 7, 14, or 28 after immunization. Animals from all groups were included (n = 18, cutoff p < 0.05). b Heatmap showing the correlation of D7 BTM with antibody levels in analogy to a
Fig. 3
Fig. 3
BTM families correlating with antibody responses and induced by the vaccines. BTM families were created as described in Table 1. a The polar plots show the correlation coefficients for BTM of the module families with significant positive or negative correlation to neutralizing antibody levels in serum (p < 0.05). BTM for the D3 (upper plots) and D7 (lower plots) transcriptome are shown. b Vaccine-dependent BTM modulations were calculated as normalized enrichment scores (NES) using GSEA. The significantly (p < 0.05) modulated BTM were grouped as BTM families as in a. The data are shown was calculated for each vaccine group with the D3 (upper plots) and D7 (lower plots) transcriptome
Fig. 4
Fig. 4
Relationship of BTM correlating to antibody levels and their induction by the vaccines. The heatmap shows the average correlation coefficient r2 from BTM correlating to antibodies at least at two different time points. BTM correlating to antibody levels at all time points (day 7, 14 and 28) are indicated in bold letters. BTMs were allocated to BTM families defined in Table 1 and grouped as BTM which were not induced by any of the vaccine group (only corr.), induced by the PBS-based vaccine (corr. & PBS), the L (corr. & L) or the L(TLRL) vaccines (corr. & L(TLRL); for data on vaccine-induced BTM see Supplementary Fig. 4). The blank cells indicate that there was no significant correlation for this time point post vaccination
Fig. 5
Fig. 5
BTM families correlating to vaccine-induced haptoglobin levels. BTM families were created as described in Table 1. The polar plots show correlation coefficients for module families with significant (p < 0.05) positive or negative correlation to serum haptoglobin levels. BTM families for the D3 (upper plots) and D7 (lower plots) transcriptome are shown
Fig. 6
Fig. 6
Pre-vaccination BTM associated with antibody levels. a GSEA was used to determine the BTM enriched in “high responders” (n = 6, red) and “low responders” (n = 6, blue). The colors indicates the NES. b Heatmap for the BTM “monocyte surface signature” (S4) as an example of the analysis in a. Each square represents the indicated gene expression for individual animals (same color code as in a)

Similar articles

Cited by

References

    1. Li S, et al. Molecular signatures of antibody responses derived from a systems biology study of five human vaccines. Nat. Immunol. 2014;15:195–204. doi: 10.1038/ni.2789. - DOI - PMC - PubMed
    1. Nakaya HI, et al. Systems biology of vaccination for seasonal influenza in humans. Nat. Immunol. 2011;12:786–795. doi: 10.1038/ni.2067. - DOI - PMC - PubMed
    1. Querec TD, et al. Systems biology approach predicts immunogenicity of the yellow fever vaccine in humans. Nat. Immunol. 2009;10:116–125. doi: 10.1038/ni.1688. - DOI - PMC - PubMed
    1. Obermoser G, et al. Systems scale interactive exploration reveals quantitative and qualitative differences in response to influenza and pneumococcal vaccines. Immunity. 2013;38:831–844. doi: 10.1016/j.immuni.2012.12.008. - DOI - PMC - PubMed
    1. Patil PK, et al. Early antibody responses of cattle for foot-and-mouth disease quadrivalent double oil emulsion vaccine. Vet. Microbiol. 2002;87:103–109. doi: 10.1016/S0378-1135(02)00046-9. - DOI - PubMed