. 2018 Sep 25:6:158-168.
doi: 10.1016/j.ssmph.2018.09.009. eCollection 2018 Dec.

Canadian report card on health equity across the life-course: Analysis of time trends and cross-national comparisons with the United Kingdom

Affiliations

Canadian report card on health equity across the life-course: Analysis of time trends and cross-national comparisons with the United Kingdom

Alexandra Blair et al. SSM Popul Health. .

Abstract

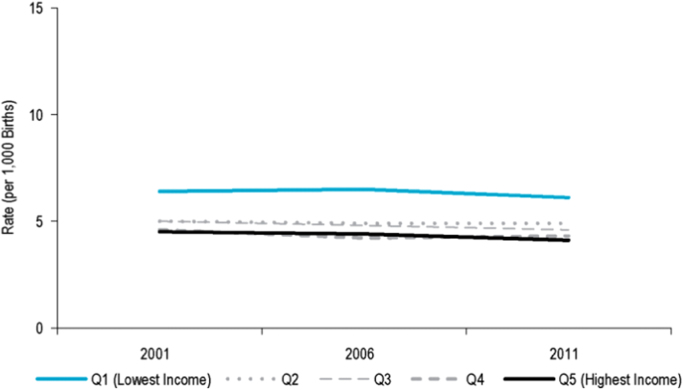
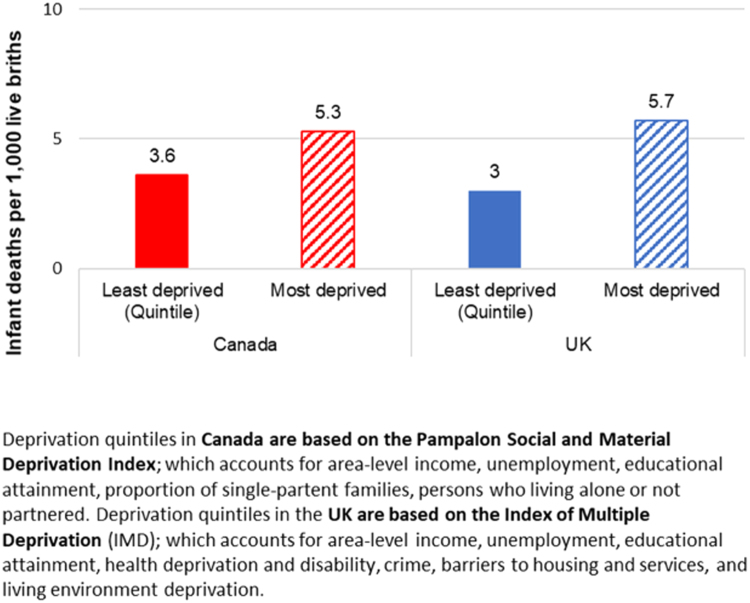
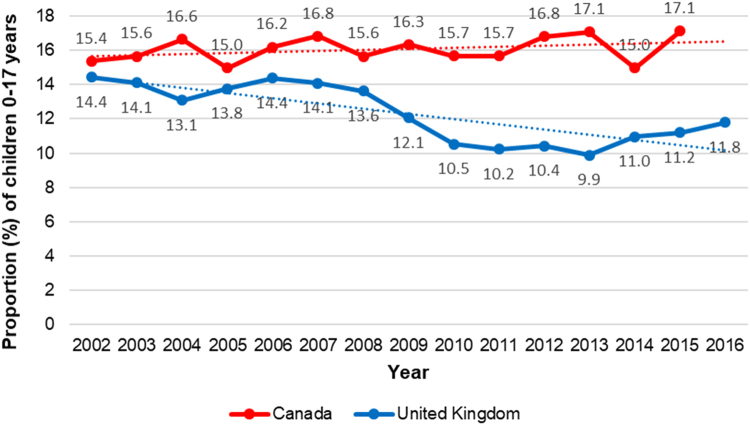
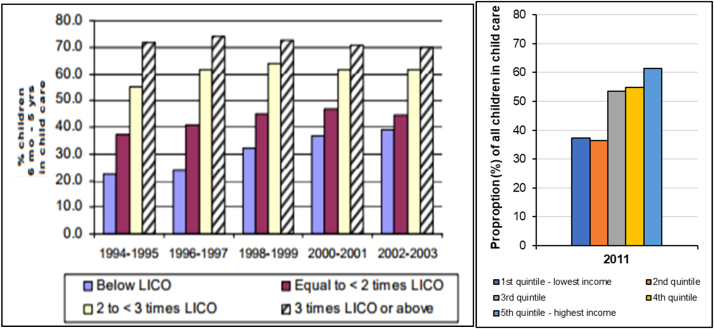
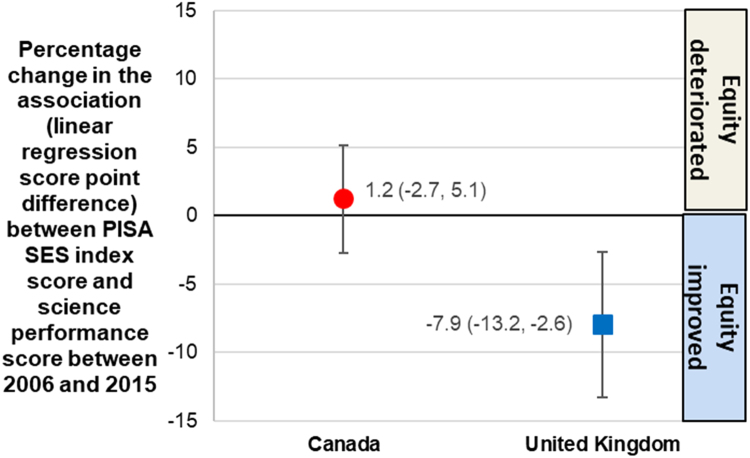
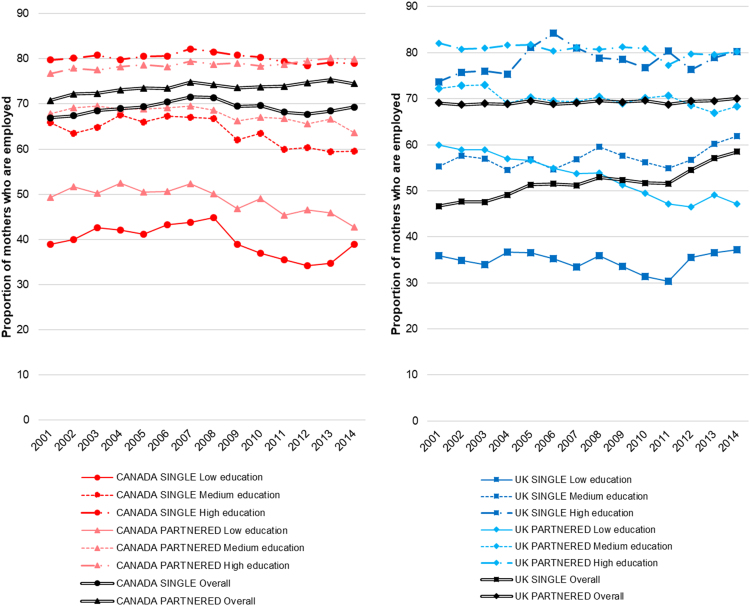
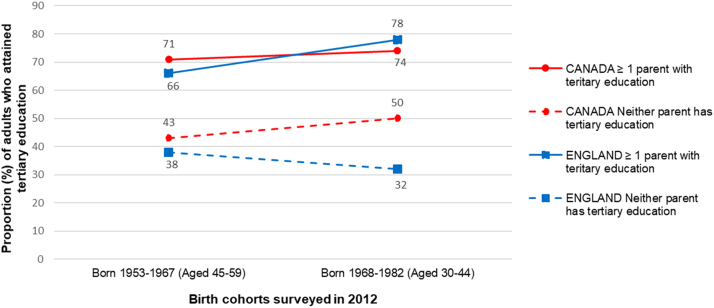
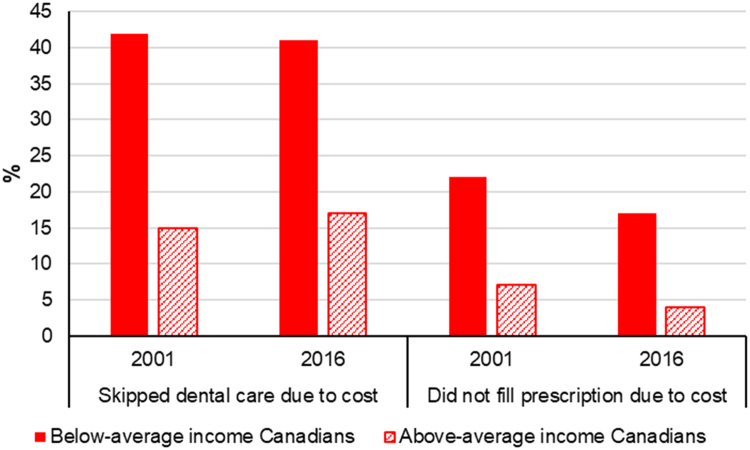
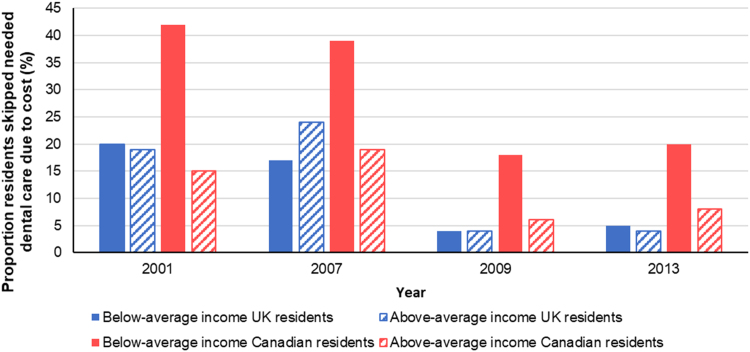
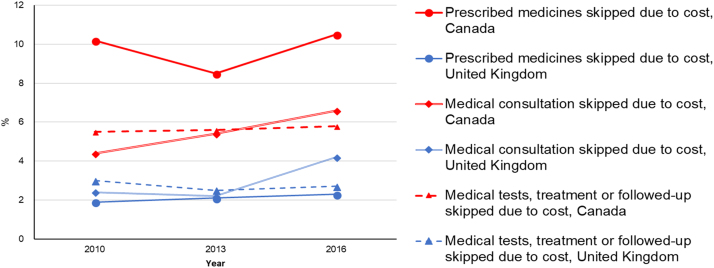
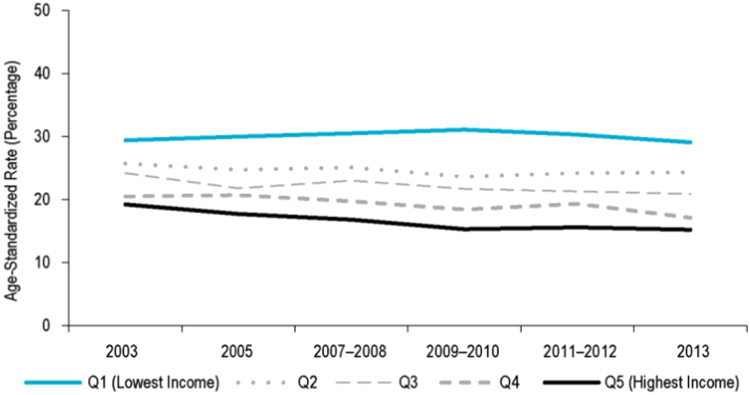
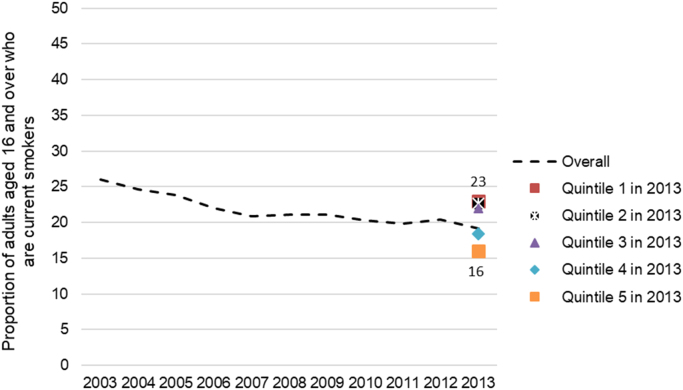
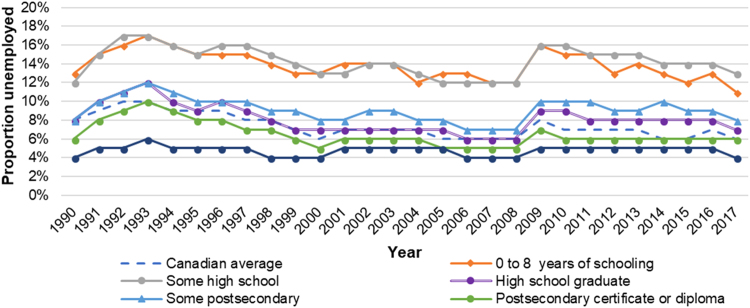
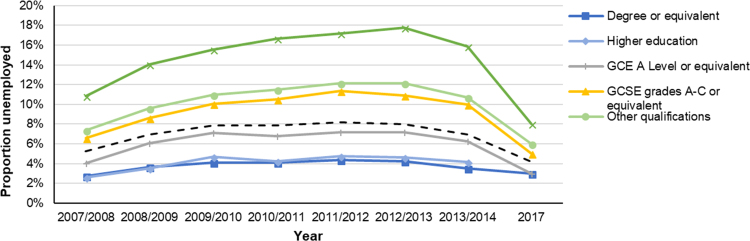
Addressing social determinants of health (SDoH) has been acknowledged as an essential objective for the promotion of both population health and health equity. Extant literature has identified seven potential areas of investment to address SDoH: investments in sexual and reproductive health and family planning, early learning and child care, education, universal health care, as well as investments to reduce child poverty, ensure sustainable economic development, and control health hazards. The aim of this paper is to produce a 'report card' on Canada's success in reducing socioeconomic and health inequities pertaining to these seven policy domains, and to assess how Canadian trends compare to those in the United Kingdom (UK), a country with a similar health and welfare system. Summarising evidence from published studies and national statistics, we found that Canada's best successes were in reducing socioeconomic inequalities in early learning and child care and reproductive health-specifically in improving equity in maternal employment and infant mortality. Comparative data suggest that Canada's outcomes in the latter areas were like those in the UK. In contrast, Canada's least promising equity outcomes were in relation to health hazard control (specifically, tobacco) and child poverty. Though Canada and the UK observed similar inequities in smoking, Canada's slow upward trend in child poverty prevalence is distinct from the UK's small but steady reduction of child poverty. This divergence from the UK's trends indicates that alternative investment types and levels may be needed in Canada to achieve similar outcomes to those in the UK.

Keywords: CANSIM, Canadian Socio-Economic Information Management System; CCS, Canadian Cancer Society; CIHI, Canadian Institute for Health Information; Canada; ECEC, Early childhood education and child care; GDP, Gross domestic product; Health and social policy; Health equity; Lifecourse epidemiology; OECD, Organisation for Economic Co-operation and Development; ONS, Office for National Statistics; Public health; SDoH, Social determinants of health; UK, United Kingdom; United Kingdom; WHO, World Health Organization.


Figures

Fig. 1
Fig. 1
Infant mortality rates, by area-level income quintile, Canada (2001–2011). Image source: CIHI, 2016. Trends in Income-Related Health Inequalities in Canada: Technical Report.
Fig. 2
Fig. 2
Average infant mortality rates between 2008 and 2011 according to local area-level deprivation in England (based on Index of Multiple Deprivation [IMD] scores) and in Canada (based on Pampalon Social and Material Deprivation Index scores). Graph created using data from: ONS (2016) Births and infant deaths in England, ref. 005621; and PHAC (2018) Canadian data from the Key Health Inequalities in Canada: A National Portrait [Annex 1].
Fig. 3
Fig. 3
Percentage of population aged 0–17 years living in households with less than 50% of median household income between 2002 and 2016, in Canada and the United Kingdom. Graph created based on C02.2 Child Poverty OECD data (OECD 2018).
Fig. 4
Fig. 4
(Panel 1) The proportion of children aged 6 months to 5 years in non-parental child care by level of household income in Canada (defined according to the Low-Income Cut-Off (LICO) for each year (1994–2003). Image source: Bushnik, 2006; (Panel 2) The proportion of all children using child care according to household income quintiles in Canada (2011). Data source: Statistics Canada, 2011 (General social survey Cycle 25 – Family, 2011 accessed via ODESI Scholars Portal).
Fig. 5
Fig. 5
Change in the socio-economic gradient of performance scores for Canada and the United Kingdom between 2006 and 2015, measured as the change in the association (linear regression score point difference) between PISA’s index of economic, social and cultural status (ESCS) scores and science performance scores in both years. Graph created using data from Table I.6.17, OECD, 2016b.
Fig. 6
Fig. 6
Employment rate among mothers of at least one child aged 0 to 14 years, in Canada (Panel 1) and the United Kingdom (Panel 2), between 2001 and 2014, according to mothers’ marital status and educational attainment (‘Low’ for pre-primary, primary or lower secondary education; ‘Medium’ for upper secondary and post-secondary non-tertiary education; ‘High’ for tertiary education. Graph created using OECD labour market position of families (LMF) Table 1.3 data from (OECD, 2018b).
Fig. 7
Fig. 7
Tertiary education attainment in Canada and England in 2012 among two birth cohorts, adults aged 30 to 44 years (born between 1968 and 1982) and adults aged 45 to 59 years born (born between 1953–1967) according to parental tertiary attainment (neither parent has attained a tertiary level of education; or one or more parent has achieved tertiary education). Graph created using data from OECD 2018a, accessed via the OCEDstat database' section on Education and Training - Intergenerational Mobility in Education).
Fig. 8
Fig. 8
Proportion of Canadian respondents having not filled a prescription due to cost or having skipped dental care due to cost in 2001 and 2016, by income group. Graph created using data from Blendon (2002) and CIHI (2016a).
Fig. 9
Fig. 9
Proportion of residents of Canada and the United Kingdom reporting having skipped dental care due from 2001 to 2013, by income group. Graph created using data from Blendon (2002), OECD, 2009, OECD, 2011, OECD, 2015.
Fig. 10
Fig. 10
Proportion of residents of Canada and the United Kingdom reporting having skipped filling prescriptions, medical consultations, tests, treatment or follow-up due to costs from 2010 to 2016. Graph created using data from the OECDStat database (2016) section on Health - Health Care Quality Indicators.
Fig. 11
Fig. 11
Age-standardised smoking prevalence rates, by individual-level income quintile in Canada between 2003 and 2013. Image source: CIHI Trends in Income-Related Health Inequalities in Canada, 2016.
Fig. 12
Fig. 12
Cigarette smoking prevalence in England between 2003 and 2013 overall, and by individual-level income quintile in 2013 (only cross-sectionally data were available). Graph created using data from tables 6 and 14, Adult smoking habits in Great Britain 1974–2014 dataset (ONS, 2018).
Fig. 13
Fig. 13
Unemployment rate by educational attainment among individuals aged 15 years and older in Canada, 1990–2017. Graph created using data from Statistics Canada CANSIM Table 282-0004 (Statistics Canada, 2018).
Fig. 14
Fig. 14
Unemployment rate by educational attainment for individuals aged 16–64 years in the United Kingdom (2007–2014) and (2017). Graph created using data from the UK Annual Population survey (Office for National Statistics (ONS), 2015), data from the Labour Force Survey (Office for National Statistics (ONS), 2017).

References

    1. Asbridge M. Public place restrictions on smoking in Canada: Assessing the role of the state, media, science and public health advocacy. Social Science Medicine. 2004;58(1):13–24. - PubMed
    1. Backlund E., Sorlie P.D., Johnson N.J. A comparison of the relationships of education and income with mortality: The national longitudinal mortality study. Social Science Medicine. 1999;49(10):1373–1384. - PubMed
    1. Bartley M. Unemployment and ill health: Understanding the relationship. Journal of Epidemiology Community Health. 1994;48(4):333–337. - PMC - PubMed
    1. Bartley M., Plewis I. Accumulated labour market disadvantage and limiting long-term illness: Data from the 1971–1991 Office for National Statistics' Longitudinal Study. International Journal of Epidemiology. 2002;31(2):336–341. - PubMed
    1. Bevan G., Karanikolos M., Exley J., Nolte E., Connolly S., Mays N. The Health Foundation and Nuffield Trust; London: 2014. The four health systems of the United Kingdom: How do they compare? Summary Report.〈https://www.nuffieldtrust.org.uk/files/2017-01/4-countries-report-web-f... Available at. (ISBN 978-1-905030-78-1)

LinkOut - more resources