. 2019 May;29(3):351-365.
doi: 10.1111/bpa.12661. Epub 2018 Nov 20.

Oxidative stress and inflammation in a spectrum of epileptogenic cortical malformations: molecular insights into their interdependence

Affiliations

Oxidative stress and inflammation in a spectrum of epileptogenic cortical malformations: molecular insights into their interdependence

Andrea Arena et al. Brain Pathol. 2019 May.

Abstract

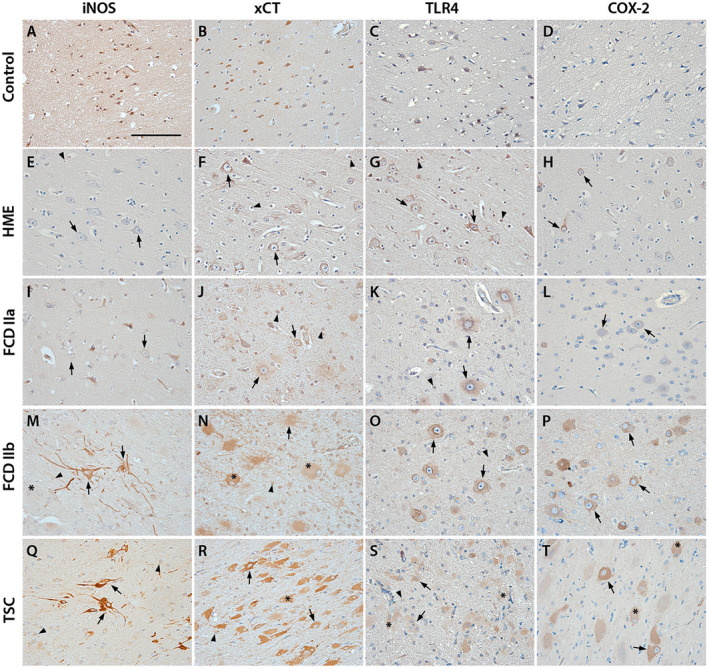
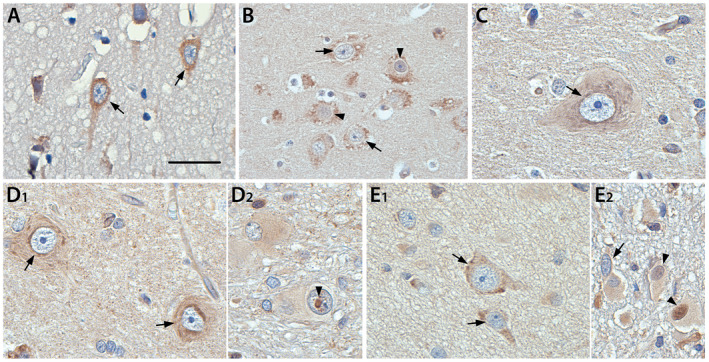
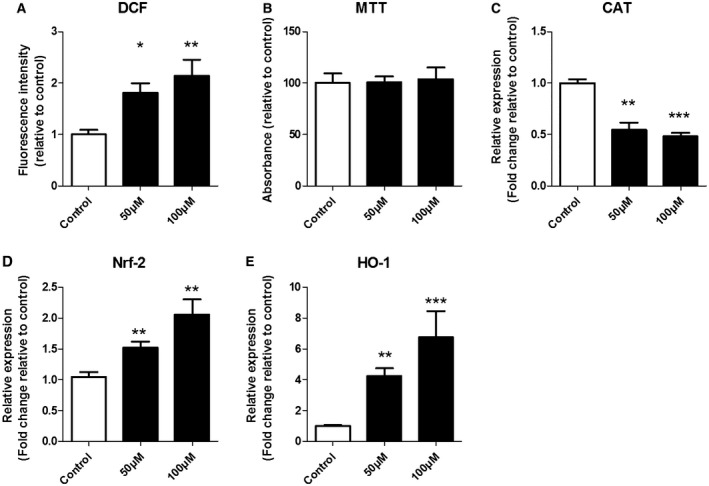
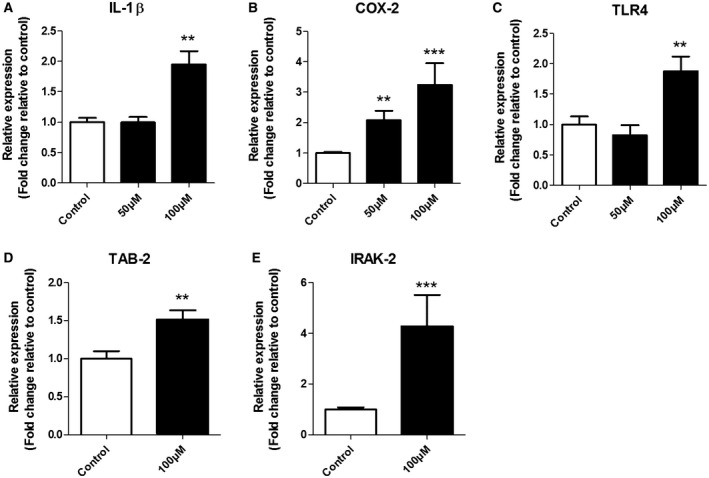
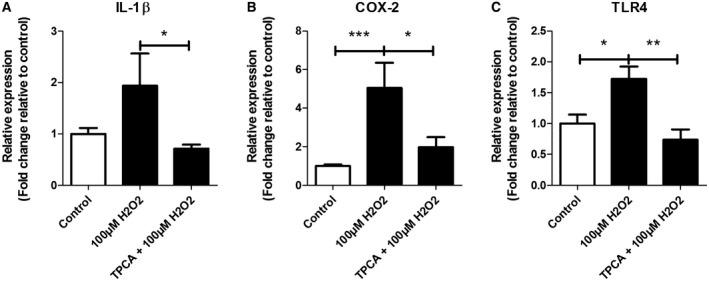
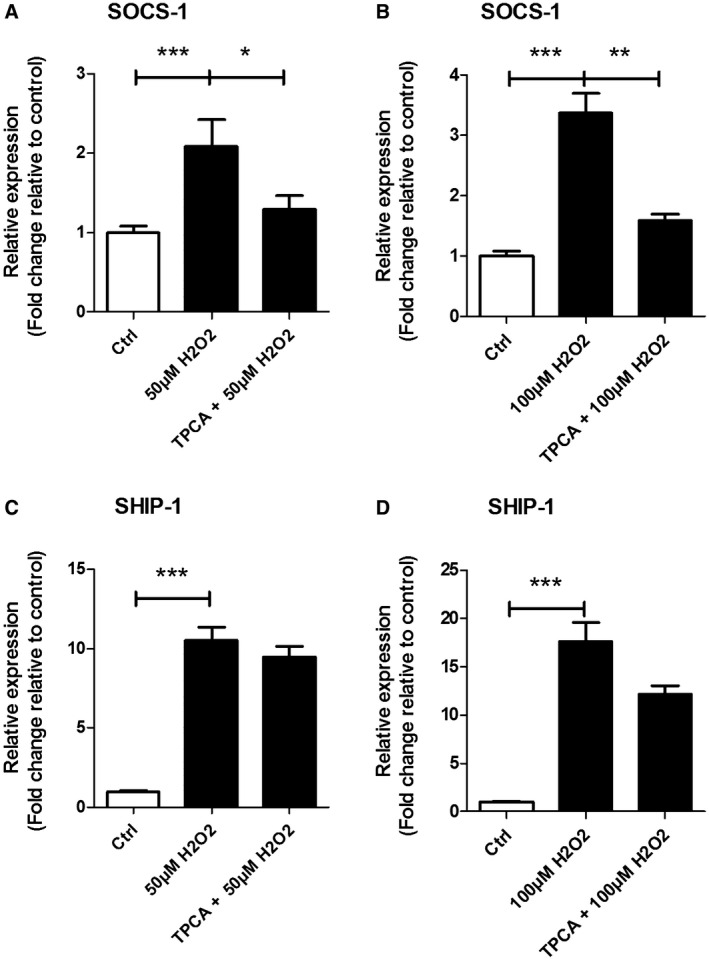
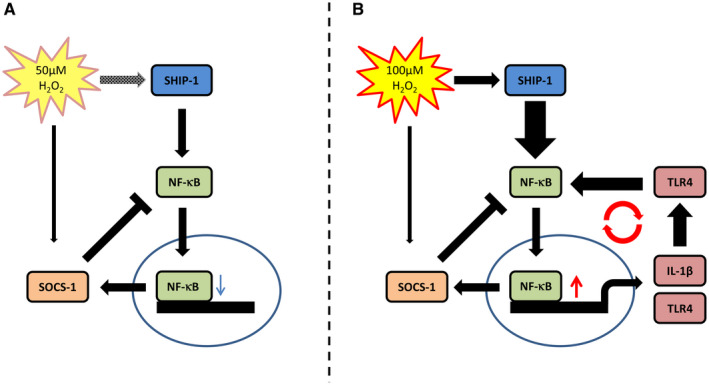
Oxidative stress (OS) occurs in brains of patients with epilepsy and coincides with brain inflammation, and both phenomena contribute to seizure generation in animal models. We investigated whether expression of OS and brain inflammation markers co-occurred also in resected brain tissue of patients with epileptogenic cortical malformations: hemimegalencephaly (HME), focal cortical dysplasia (FCD) and cortical tubers in tuberous sclerosis complex (TSC). Moreover, we studied molecular mechanisms linking OS and inflammation in an in vitro model of neuronal function. Untangling interdependency and underlying molecular mechanisms might pose new therapeutic strategies for treating patients with drug-resistant epilepsy of different etiologies. Immunohistochemistry was performed for specific OS markers xCT and iNOS and brain inflammation markers TLR4, COX-2 and NF-κB in cortical tissue derived from patients with HME, FCD IIa, IIb and TSC. Additionally, we studied gene expression of these markers using the human neuronal cell line SH-SY5Y in which OS was induced using H2 O2 . OS markers were higher in dysmorphic neurons and balloon/giant cells in cortex of patients with FCD IIb or TSC. Expression of OS markers was positively correlated to expression of brain inflammation markers. In vitro, 100 µM, but not 50 µM, of H2 O2 increased expression of TLR4, IL-1β and COX-2. We found that NF-κB signaling was activated only upon stimulation with 100 µM H2 O2 leading to upregulation of TLR4 signaling and IL-1β. The NF-κB inhibitor TPCA-1 completely reversed this effect. Our results show that OS positively correlates with neuroinflammation and is particularly evident in brain tissue of patients with FCD IIb and TSC. In vitro, NF-κB is involved in the switch to an inflammatory state after OS. We propose that the extent of OS can predict the neuroinflammatory state of the brain. Additionally, antioxidant treatments may prevent the switch to inflammation in neurons thus targeting multiple epileptogenic processes at once.

Keywords: epilepsy; focal cortical dysplasia; hemimegalencephaly; inflammation; oxidative stress; tuberous sclerosis complex.


Conflict of interest statement

The authors declare that they have no competing interests.

Figures

Figure 1
Figure 1
Representative images of oxidative stress markers (iNOS, xCT) and inflammatory markers (TLR4, COX‐2) in control and surgical tissue of HME, FCD IIa, FCD IIb and TSC. Panels A–D show expression of all markers in cortical tissue of autopsy controls. TLR4, iNOS and xCT display (very) weak expression in cortical neurons (A–C), COX‐2 staining is absent (D). HME and FCD IIa tissue show very weak staining for iNOS in dysmorphic neurons (E, I). TLR4 and xCT expression in HME and FCD IIa dysmorphic neurons and glia is higher but not different to control tissue (F, G, J, K). COX‐2 in dysmorphic neurons in HME is weak with sparsely distributed cells displaying strong reactivity (H, arrows). Very weak staining for COX‐2 in FCD IIa could only be detected in dysmorphic neurons (L). In FCD IIb iNOS, xCT, TLR4 and COX‐2 were strongly higher compared to control in dysmorphic neurons and glia (M–P). Balloon cells had a very strong expression of all markers. In TSC, a similar pattern was observed: iNOS, xCT, TLR4 and COX‐2 being expressed in dysmorphic neurons and glia (Q–T). Giant cell expression of all markers was strong as for balloon cells in FCD IIb (M–T, asterisks). Sections were counterstained with hematoxylin. Scale bar: 100 µm in A; arrows = dysmorphic neurons, arrowheads = glia, asterisk* = balloon/giant cells
Figure 2
Figure 2
Representative images of cytoplasmic and nuclear expression of NF‐κB p65 in control and surgical tissue of HME, FCD IIa, FCD IIb and TSC. The expression of NF‐κB p65 in cortical neurons of control tissue (A) and dysmorphic neurons in HME and FCD IIa was mainly restricted to the cytoplasm (B, C). Similarly, dysmorphic neurons in FCD IIb and TSC expressed NF‐κB p65 in the cytoplasm (D1, E1). Occasional nuclear staining in dysmorphic neurons could be detected (representative for HME in B, arrowheads). In comparison some balloon cells (D2) and giant cells (E2) displayed nuclear staining, suggesting translocation of NF‐κB p65 from the cytoplasm to the nucleus. Arrows = cytoplasmic staining, arrowheads = nuclear staining. Sections were counterstained with hematoxylin. Scale bar A, C, D1, D2, E1 = 25 µm; Scale bar B, E2 = 50 µm.
Figure 3
Figure 3
The effect of H2O2 on intracellular ROS accumulation, cell viability and gene expression of oxidative stress markers. SH‐SY5Y cells were treated with different amounts of hydrogen peroxide (H2O2, 50 μM or 100 μM) for 3 h. The intracellular accumulation of ROS was assessed by DCF fluorescence intensity (A). Cell viability was determined using MTT assay (B). The mRNA level of catalase was reduced at both concentration, whereas the expression of Nrf‐2 and HO‐1 was increased (C–E). mRNA expression was normalized to the geometric mean of reference genes C1ORF43 and EIF1α. Kruskal–Wallis test followed by the Dunn’s post hoc test. Error bars represent standard error of mean (SEM); *P < 0.05, **P < 0.01, ***P < 0.001. Data are representative of three independent experiments with three replicates for each group.
Figure 4
Figure 4
Expression of IL‐1β, COX‐2 and TLR4 (50 μM or 100 μM) and TAB2 and IRAK2 (100 µM) in response to H2O2 treatment for 3 h. Quantitative real‐time PCR of IL‐1β (A), COX‐2 (B) and TLR4 (C) mRNA after 50 µM and 100 µM H2O2 as well as TAB2 (D) and IRAK2 (E) after 100 µM H2O2. Data are expressed relative to levels observed in control groups; mRNA expression was normalized to the geometric mean of reference genes C1ORF43 and EIF1α. Kruskal–Wallis test followed by the Dunn’s post hoc test. Error bars represent standard error of mean (SEM); **P < 0.01, ***P <0.001. Data are representative of three independent experiments with three replicates for each group.
Figure 5
Figure 5
Expression of IL‐1β, COX‐2 and TLR4 after stimulation with 100 µM H2O2 with or without TPCA‐1‐ pretreatment. Quantitative real‐time PCR of IL‐1β (A), COX‐2 (B) and TLR4 (C) in SH‐SY5Y cells TPCA‐1 pretreated with or without 100 µM H2O2. Data are expressed relative to expression observed in control groups; mRNA expression was normalized to the geometric mean of reference genes C1ORF43 and EF1α. Nonparametric Mann–Whitney U test. Error bars represent standard error of mean (SEM); *P < 0.05, **P < 0.01, ***< 0.001. Data are representative of three independent experiments with three replicates for each group.
Figure 6
Figure 6
Expression of SOCS1 and SHIP1 after stimulation with or without TPCA‐1‐ pretreatment and treated with H2O2. Quantitative real‐time PCR of SOCS1 (A, B) and SHIP1 (C, D) in SH‐SY5Y cells TPCA‐1‐ pretreated and/or H2O2‐treated. Data are expressed relative to expression observed in control groups; mRNA expression was normalized to the geometric mean of reference genes C1ORF43 and EF1α. Nonparametric Mann–Whitney U test. Error bars represent standard error of mean (SEM);* P < 0.05, **< 0.01, ***P < 0.001. Data are representative of three independent experiments with three replicates for each group.
Figure 7
Figure 7
Proposed mechanism of OS‐mediated switch to an inflammatory state. Low OS at 50 µM H2O2 stimulates SHIP‐1 and, mediated via NF‐κB, SOCS‐1 expression alike creating an equilibrium that does not induce expression of inflammatory genes. High OS at 100 µM H2O2 leads to increased SHIP‐1 expression and NF‐κB activation and subsequently increased IL‐1β and TLR4 expression which reinforces NF‐κB signaling further. In this condition SOCS‐1 cannot equilibrate the NF‐κB signal leading to a self‐perpetuating inflammatory signal.

References

    1. Aronica E, Boer K, Baybis M, Yu J, Crino P (2007) Co‐expression of cyclin D1 and phosphorylated ribosomal S6 proteins in hemimegalencephaly. Acta Neuropathol 114:287–293. - PubMed
    1. Aronica E, Crino PB (2011) Inflammation in epilepsy: clinical observations. Epilepsia 52(Suppl. 3):26–32. - PubMed
    1. Aronica E, Muhlebner A (2017) Neuropathology of epilepsy. Handb Clin Neurol 145:193–216. - PubMed
    1. Baybis M, Yu J, Lee A, Golden JA, Weiner H, McKhann G 2nd et al (2004) mTOR cascade activation distinguishes tubers from focal cortical dysplasia. Ann Neurol 56:478–487. - PubMed
    1. Ben‐Menachem E, Kyllerman M, Marklund S (2000) Superoxide dismutase and glutathione peroxidase function in progressive myoclonus epilepsies. Epilepsy Res 40:33–39. - PubMed

Publication types

MeSH terms

Supplementary concepts