. 2018 Dec 1;120(6):3063-3076.
doi: 10.1152/jn.00495.2018. Epub 2018 Oct 10.

Input-specific maturation of NMDAR-mediated transmission onto parvalbumin-expressing interneurons in layers 2/3 of the visual cortex

Affiliations

Input-specific maturation of NMDAR-mediated transmission onto parvalbumin-expressing interneurons in layers 2/3 of the visual cortex

Camilo Ferrer et al. J Neurophysiol. .

Abstract

Parvalbumin-expressing (PV) GABAergic interneurons regulate local circuit dynamics. In terms of the excitation driving PV interneuron activity, the N-methyl-d-aspartate receptor (NMDAR)-mediated component onto PV interneurons tends to be smaller than that onto pyramidal neurons but makes a significant contribution to their physiology and development. In the visual cortex, PV interneurons mature during the critical period. We hypothesize that during the critical period, the NMDAR-mediated signaling and functional properties of glutamatergic synapses onto PV interneurons are developmentally regulated. We therefore compared the α-amino-3-hydroxy-5-methyl-4-isoxazolepropionic acid receptor (AMPAR)- and NMDAR-mediated synaptic responses before (postnatal days 15-20, P15-P20), during (P25-P40), and after (P50-P60) the visual critical period. AMPAR miniature excitatory postsynaptic currents (mEPSCs) showed a developmental decrease in frequency, whereas NMDAR mEPSCs were absent or showed extremely low frequencies throughout development. For evoked responses, we consistently saw a NMDAR-mediated component, suggesting pre- or postsynaptic differences between evoked and spontaneous neurotransmission. Evoked responses showed input-specific developmental changes. For intralaminar inputs, the NMDAR-mediated component significantly decreased with development. This resulted in adult intralaminar inputs almost exclusively mediated by AMPARs, suited for the computation of synaptic inputs with precise timing, and likely having NMDAR-independent forms of plasticity. In contrast, interlaminar inputs maintained a stable NMDAR-mediated component throughout development but had a shift in the AMPAR paired-pulse ratio from depression to facilitation. Adult interlaminar inputs with facilitating AMPAR responses and a substantial NMDAR component would favor temporal integration of synaptic responses and could be modulated by NMDAR-dependent forms of plasticity. NEW & NOTEWORTHY We show for the first time input-specific developmental changes in the N-methyl-d-aspartate receptor component and short-term plasticity of the excitatory drive onto layers 2/3 parvalbumin-expressing (PV) interneurons in the visual cortex during the critical period. These developmental changes would lead to functionally distinct adult intralaminar and interlaminar glutamatergic inputs that would engage PV interneuron-mediated inhibition differently.

Keywords: AMPA receptors; NMDA receptors; PV interneurons.


Figures

Fig. 1.
Fig. 1.
Identification of parvalbumin (PV)-expressing interneurons in primary visual cortex using PV-tdTomato mice. A: PV-expressing interneurons were identified by PV-tdTomato (red) expression. Confocal image (×40 magnification) of a recorded PV interneuron stained with biocytin (white), confirming post hoc its location in layers 2/3 of primary visual cortex. DAPI staining (blue) is shown for reference. Laminar distribution is indicated at left. Scale bar, 100 μm. B: the characteristic fast-spiking phenotype of PV interneurons was confirmed for a subset of recordings in current-clamp configuration. Top: applied current stimulation. The PV interneuron was held at Im = 0 pA, and successive pulses of current injection were applied from −50 pA (bottom gray trace) until rheobase (250 pA; blue trace) was reached and up to 350 pA (top gray trace). Middle: membrane voltage responses to the corresponding current injections in top panel (rheobase in blue). Bottom: phase plots of the action potentials evoked at rheobase. The action potentials displayed the characteristic fast kinetics and strong afterhyperpolarization of PV interneurons (Helm et al. 2013; Tricoire et al. 2011). Vm, membrane potential; dV/dt, change in voltage over time.
Fig. 2.
Fig. 2.
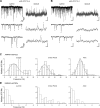
AMPA receptor (AMPAR)- and NMDA receptor (NMDAR)-mediated miniature excitatory postsynaptic currents (mEPSCs) over development. A and B: AMPAR- and NMDAR-mediated mEPSCs from 2 different parvalbumin (PV)-expressing interneurons (INs) recorded from the same animal (postnatal day 28, P28). The neuron in B displays a very low frequency of NMDAR events compared with the one in A. Top left, representative AMPAR-mediated currents (5 s) recorded in voltage clamp (membrane potential = −70 mV) in the presence of extracellular Mg2+, tetrodotoxin, and picrotoxin. Bottom left, segments of the same current trace expanded to show 200 ms of recording. Top right, representative NMDAR-mediated currents (5 s) from the same neuron, recorded at +40 mV with added 6,7-dinitroquinoxaline-2,3-dione and glycine. Bottom right, segments of the same current trace expanded to show 200 ms of recording. Asterisks indicate identified individual events. Frequencies are AMPAR = 19.0 Hz, NMDAR = 2.4 Hz (A) and AMPAR = 18.5 Hz, NMDAR = 0.7 Hz (B). C: histogram distribution of AMPAR-mediated mEPSC frequencies (bin size = 3 Hz) over the 3 developmental stages: juvenile (J), P15–P20; critical period (CP), P25–P30/P35–P40; and adult (A), P50–P60. All the frequency distributions are well fitted to a normal distribution. Anderson-Darling test of normality, P values: J = 0.16, CP = 0.13, A = 0.94. At a 95% confidence level, P values <0.05 indicate a non-normal distribution. D: histogram distribution of NMDAR-mediated mEPSC frequencies (bin size = 0.5 Hz). The event frequencies are very low, and with the exception of juvenile, do not follow a normal distribution. Anderson-Darling test of normality, P values: J = 0.26, CP < 0.05, A < 0.05.
Fig. 3.
Fig. 3.
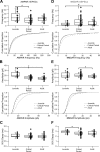
Changes in AMPA receptor (AMPAR)- and NMDA receptor (NMDAR)-mediated miniature excitatory postsynaptic currents (mEPSCs) during the visual critical period. Summary data are shown for mEPSCs grouped by the 3 developmental stages: juvenile (J), P15–P20; critical period (CP), P25–P30/P35–P40; and adult (A), P50–P60. Each dot represents one recorded parvalbumin-expressing interneuron. The box plot indicates the median and interquartile range for each age group. *Significant difference between indicated groups [Kruskal-Wallis (KW), P < 0.05; multiple-comparisons Mann-Whitney (MW) with Bonferroni correction, P < 0.016]. #Significant difference in variance (Levene’s test, P < 0.05). A–C: AMPAR-mediated mEPSC summary plots showing frequency (A), amplitude (B), and decay kinetics (C). A: the frequency of events significantly decreased during the critical period. Top, box-dot plot comparing the 3 age groups (J = 19.9 [12.7] Hz, n = 17 cells, 9 mice; CP = 13.6 [9.9] Hz, n = 56 cells, 20 mice; A = 17.9 [7.9] Hz, n = 26 cells, 10 mice). Bottom, cumulative histograms for the same data displayed at top [CP ≠ J; Kolmogorov-Smirnov (KS) test, P < 0.01). B, top: box-dot plot showing the amplitude decrease during the critical period (J = 19.4 [6.6] pA, n = 17 cells; CP = 16.2 [4.4] pA, n = 56 cells; A = 14.5 [3.9] pA, n = 26 cells; KW P < 0.001; MW P < 0.016). Bottom, cumulative histograms for the same data displayed at top (J ≠ CP ≠ A; KS test, α < 0.01). C: the decay kinetics did not change significantly between any age group (J = 0.98 [0.27] ms, n = 17 cells; CP = 0.97 [0.20] ms, n = 56 cells; A = 0.94 [0.18] ms, n = 26 cells; KW, P = 0.46). D–F: NMDAR-mediated mEPSC summary plots showing frequency (D), amplitude (E), and decay kinetics (F). D, top: the median frequency did not change significantly (J = 0.63 [0.82] Hz; n = 15 cells, 8 mice; CP = 1.2 [2.1] Hz, n = 59 cells, 20 mice; A = 0.65 [1.07] Hz, n = 25 cells, 9 mice; KW, P = 0.1), although the frequency variance was significantly higher during the critical period compared with both juvenile and adult (J = 0.38 Hz2, CP = 2.84 Hz2, A = 0.89 Hz2; Levene’s test, P < 0.05). Bottom, cumulative histograms for the same data displayed at top (CP ≠ J, CP ≠ A; KS test, α < 0.01). E: the amplitude significantly decreased from the critical period to adult stages (J = 11.9 [4.5] pA, n = 14 cells; CP = 12.7 [2.9] pA, n = 55 cells; A = 11.1 [1.8] pA, n = 23 cells; KW P < 0.05; MW P < 0.016). Bottom, cumulative histograms for the same data displayed at top (A ≠ J, A ≠ CP; KS test, α < 0.01). F: decay kinetics decreased during the critical period (J = 2.90 [0.29] ms, n = 14 cells; CP = 2.60 [0.43] ms, n = 55 cells; A = 2.47 [0.46] ms, n = 23 cells; KW P < 0.05, MW P < 0.016).
Fig. 4.
Fig. 4.
The NMDA receptor (NMDAR)-mediated component of intralaminar inputs onto layer 2/3 parvalbumin (PV)-expressing interneurons progressively decreases with development. A: schematic of the intralaminar paired recording configuration used to study evoked glutamatergic connections between pyramidal (Pyr) neurons and PV interneurons in layers 2/3 (II/III) of the primary visual cortex. B: sample traces of a paired recording between a pyramidal neuron and a PV interneuron. Top, 3 action potentials (APs) evoked in a pyramidal neuron at 10 Hz in current clamp. Middle, average AMPA receptor (AMPAR)-mediated excitatory postsynaptic currents (EPSCs; 100 sweeps) recorded at −70 mV in the presence of picrotoxin and extracellular Mg2+. Bottom, average NMDAR-mediated EPSCs (100 sweeps) recorded at +40 mV from the same cell with added 6,7-dinitroquinoxaline-2,3-dione. C–E: summary box-dot plots of intralaminar AMPAR-mediated EPSCs showing amplitude (C), decay kinetics (D), and paired-pulse ratio (PPR; E) grouped by the 3 developmental stages: juvenile (J), P15–P20; critical period (CP), P25–P30/P35–P40; and adult (A), P50–P60. Each dot represents one recorded PV interneuron. The box plot indicates the median and interquartile range for each age group. *Significant difference between indicated groups [Kruskal-Wallis (KW), P < 0.05; multiple-comparisons Mann-Whitney (MW) with Bonferroni correction, P < 0.016]. C: the median amplitude of unitary responses slightly increased over development, but these changes were not statistically significant (J = 26.4 [25.3] pA, n = 25 cells, 16 mice; CP = 29.4 [39.1] pA, n = 27 cells, 19 mice; A = 35.4 [43.7] pA, n = 28 cells, 18 mice; KW P = 0.49). D: the decay kinetics became significantly faster during the critical period with respect to juvenile (J = 4.3 [2.8] ms, n = 24 cells; CP = 2.8 [1.4] ms, n = 27 cells; A = 3.8 [2.1] ms, n = 28 cells; KW P < 0.05, MW P < 0.016). E: the PPR did not change significantly among any age group (J = 0.85 [0.17], n = 25 cells; CP = 0.89 [0.27], n = 27 cells; A = 0.83 [0.14], n = 28 cells; KW P = 0.78). F–H: summary box-dot plots of intralaminar NMDAR-mediated EPSCs showing amplitude (F), decay kinetics (G), and PPR (H). F: the amplitude became progressively smaller with age, but this change did not reach statistical significance (J = 9.5 [15.6] pA, n = 15 cells, 10 mice; CP = 6.0 [8.8] pA, n = 23 cells, 15 mice; A = 4.0 [4.4] pA, n = 14 cells, 11 mice; KW, P = 0.07). G: the decay kinetics did not change significantly over development (J = 49.5 [30.2] ms, n = 15 cells; CP = 50.5 [43.5] ms, n = 21 cells; A = 40.2 [30.4] ms, n = 12 cells; KW, P = 0.51). H: the PPR did not change significantly over development (J = 0.65 [0.33], n = 15 cells; CP = 0.77 [0.22], n = 23 cells; A = 0.77 [0.14], n = 13 cells; KW, P = 0.54). I, left: box-dot plots of NMDAR-to-AMPAR ratios (NMDAR/AMPAR) for intralaminar connections. There is a significant progressive decrease in the relative NMDAR component from juvenile into adulthood (J = 0.30 [0.34], n = 15 cells, 10 mice; CP = 0.17 [0.11], n = 23 cells, 15 mice; KW, P < 0.001, MW P < 0.016). Right, the progressive decrease in NMDAR/AMPAR is evidenced by a negative correlation between age and NMDAR/AMPAR. The P value and R2 of the linear fit are displayed in the graph.
Fig. 5.
Fig. 5.
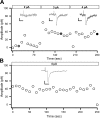
Isolation of minimally evoked glutamatergic responses in layer 2/3 parvalbumin (PV)-expressing interneurons. The extracellular stimulation electrode was placed in layer 5 during recordings from a PV interneuron in layers 2/3. The level of stimulation used was above threshold, adjusted until stable minimal synaptic responses with low failure rates were evoked. A: calibration plot of the stimulation used to evoke minimal responses. Horizontal bars at top represent 3 levels of stimulation used to evoke a postsynaptic response. Inset currents represent examples of responses to each stimulation level, indicated by the filled circles. Scale bars: 10 pA, 5 ms. B: current peak responses on repetitive stimulation at 4 μA. This stimulation level generates stable and reliable synaptic responses, with minimal failures. Inset current shows the average response for all data points displayed in the plot. Scale bars: 10 pA, 5 ms.
Fig. 6.
Fig. 6.
Interlaminar inputs onto layer 2/3 parvalbumin (PV)-expressing interneurons maintain a constant NMDA receptor (NMDAR)-mediated component but show a shift in their short-term plasticity with development. A: schematic of the extracellular stimulation used to assess interlaminar glutamatergic inputs onto layer 2/3 PV interneurons. The stimulation electrode was placed in layer 5 directly underneath a PV interneuron that was patched in layers 2/3 of the primary visual cortex. Pyr, pyramidal neuron. B: sample traces of synaptic responses evoked by extracellular stimulation. Three pulses of stimulation applied at 10 Hz generated putative monosynaptic responses with both AMPA receptor (AMPAR)- and NMDAR-mediated components. Top, average AMPAR-mediated excitatory postsynaptic currents (EPSCs; 30 sweeps) recorded at −70 mV in the presence of picrotoxin and extracellular Mg2+. Bottom, average NMDAR-mediated EPSCs (30 sweeps) recorded at +40 mV from the same cell with added 6,7-dinitroquinoxaline-2,3-dione. C–E: summary box-dot plots of interlaminar AMPAR-mediated EPSCs showing amplitude (C), decay kinetics (D), and paired-pulse ratio (PPR; E) grouped by the 3 developmental stages: juvenile (J), P15–P20; critical period (CP), P25–P30/P35–P40; and adult (A), P50–P60. Each dot represents one recorded PV interneuron. The box plot indicates the median and interquartile range for each age group. *Significant difference between indicated groups [Kruskal-Wallis (KW), P < 0.05; multiple-comparisons Mann-Whitney (MW) with Bonferroni correction, P < 0.016]. C: the median amplitude of the responses showed no statistical differences (J = 52.6 [29.9] pA, n = 15 cells, 7 mice; CP = 65.0 [28.1] pA, n = 28 cells, 17 mice; A = 40.7 [25.7] pA, n = 19 cells, 8 mice; KW, P = 0.054). D: the decay kinetics became faster during the critical period (J = 6.3 [5.0] ms, n = 15 cells; CP = 4.2 [1.5] ms, n = 28 cells; A = 4.4 [2.4] ms, n = 19 cells; KW, P < 0.05; MW, P < 0.016). E: the PPR shifted from depression into facilitation from juvenile into adulthood (J = 0.87 [0.19], n = 15 cells; CP = 0.90 [0.21], n = 28 cells; A = 1.15 [0.36], n = 19 cells; KW, P < 0.05; MW, P < 0.016). F–H: summary box-dot plots of interlaminar NMDAR-mediated EPSCs showing amplitude (F), decay kinetics (G), and PPR (H). F: there was no change in peak currents (J = 15.0 [6.7] pA, n = 9 cells, 7 mice; CP = 13.3 [13.1] pA, n = 14 cells, 11 mice; KW, P = 0.99). G: there was no change in the decay kinetics (J = 58.6 [32.5] ms, n = 9 cells; CP = 45.7 [36.7] ms, n = 14 cells; A = 43.5 [16.5] ms, n = 8 cells; KW, P = 0.28). H: there was no change in the short-term dynamics (J = 0.86 [0.44], n = 9 cells; CP = 0.90 [0.40], n = 14 cells; A = 0.83 [0.41], n = 8 cells; KW, P = 0.65). I, left: box-dot plots of NMDAR-to-AMPAR ratios (NMDAR/AMPAR) for interlaminar connections. There is no change in the relative NMDAR component from juvenile into adulthood (J = 0.19 [0.07], n = 9 cells, 7 mice; CP = 0.23 [0.23], n = 14 cells, 11 mice; A = 0.35 [0.36], n = 8 cells, 6 mice; KW, P = 0.19). Right, the plot between age and NMDAR/AMPAR shows a slight positive correlation. The P value and R2 of the linear fit are displayed in the graph.
Fig. 7.
Fig. 7.
Adult intralaminar and interlaminar inputs differ on their relative NMDAR-mediated component. A–C: summary box-dot plots compare NMDAR-to-AMPAR ratios (N/A) between intralaminar (Intra) and interlaminar (Inter) connections for juvenile (A), critical period (B), and adult (C) developmental stages. Each dot represents one recorded PV interneuron. The box plot indicates the median and interquartile range for each age group. *Significant difference between indicated groups [multiple-comparisons Mann-Whitney (MW) with Bonferroni correction, P < 0.016]. A and B: there is a no significant difference in N/A between the two connections for either juvenile (Intra = 0.30 [0.34], n = 15 cells, 10 mice; Inter = 0.19 [0.07], n = 9 cells, 7 mice; MW, P = 0.11) or critical period (Intra = 0.17 [0.11], n = 23 cells, 15 mice; Inter = 0.23 [0.23], n = 14 cells, 11 mice; MW, P = 0.63). C: in the adult stage, N/A ratio is significantly smaller for intralaminar compared with interlaminar connections (Intra = 0.10 [0.08], n = 14 cells, 11 mice; Inter = 0.35 [0.36], n = 8 cells, 6 mice; MW, P = 0.001).
Fig. 8.
Fig. 8.
Distinct properties of mature intralaminar and interlaminar excitatory inputs. Schematic shows the sources of glutamatergic inputs onto layer 2/3 parvalbumin (PV)-expressing interneurons and their synaptic properties in juvenile and adult stages. Middle, the most prominent sources of glutamatergic drive to layer 2/3 PV interneurons are intralaminar (layers 2/3) and interlaminar (layers 4/5) pyramidal neurons (Pyr). Vertical ticks underneath Pyr neurons represent the rate of action potential firing and the sparse coding of superficial layers compared with deeper layers that accentuates with development. Left, representative normalized AMPA receptor (AMPAR)- and NMDA receptor (NMDAR)-mediated currents for intra- and interlaminar juvenile inputs; both inputs display similar properties and therefore would have similar drive onto PV interneuron activity. Right, representative normalized AMPAR- and NMDAR-mediated currents for intra- and interlaminar adult inputs. A minimal contribution of NMDARs for intralaminar connections would ensure precise timing and engagement of feedback inhibition in the sparsely firing superficial pyramidal neurons. A substantial NMDAR component and facilitating dynamics would ensure temporal integration of interlaminar inputs and efficient recruitment of feedforward inhibition.

Similar articles

Cited by

References

    1. Abrahamsson T, Chou CY, Li SY, Mancino A, Costa RP, Brock JA, Nuro E, Buchanan KA, Elgar D, Blackman AV, Tudor-Jones A, Oyrer J, Farmer WT, Murai KK, Sjöström PJ. Differential regulation of evoked and spontaneous release by presynaptic NMDA receptors. Neuron 96: 839–855.e5, 2017. doi:10.1016/j.neuron.2017.09.030. - DOI - PubMed
    1. Akgul G, Wollmuth LP. Synapse-associated protein 97 regulates the membrane properties of fast-spiking parvalbumin interneurons in the visual cortex. J Neurosci 33: 12739–12750, 2013. doi:10.1523/JNEUROSCI.0040-13.2013. - DOI - PMC - PubMed
    1. Angulo MC, Rossier J, Audinat E. Postsynaptic glutamate receptors and integrative properties of fast-spiking interneurons in the rat neocortex. J Neurophysiol 82: 1295–1302, 1999. doi:10.1152/jn.1999.82.3.1295. - DOI - PubMed
    1. Atasoy D, Ertunc M, Moulder KL, Blackwell J, Chung C, Su J, Kavalali ET. Spontaneous and evoked glutamate release activates two populations of NMDA receptors with limited overlap. J Neurosci 28: 10151–10166, 2008. doi:10.1523/JNEUROSCI.2432-08.2008. - DOI - PMC - PubMed
    1. Belforte JE, Zsiros V, Sklar ER, Jiang Z, Yu G, Li Y, Quinlan EM, Nakazawa K. Postnatal NMDA receptor ablation in corticolimbic interneurons confers schizophrenia-like phenotypes. Nat Neurosci 13: 76–83, 2010. doi:10.1038/nn.2447. - DOI - PMC - PubMed

Publication types

Substances