. 2018 Dec 1;120(6):2988-3000.
doi: 10.1152/jn.00262.2018. Epub 2018 Oct 10.

Cross-modal phonetic encoding facilitates the McGurk illusion and phonemic restoration

Affiliations

Cross-modal phonetic encoding facilitates the McGurk illusion and phonemic restoration

Noelle T Abbott et al. J Neurophysiol. .

Abstract

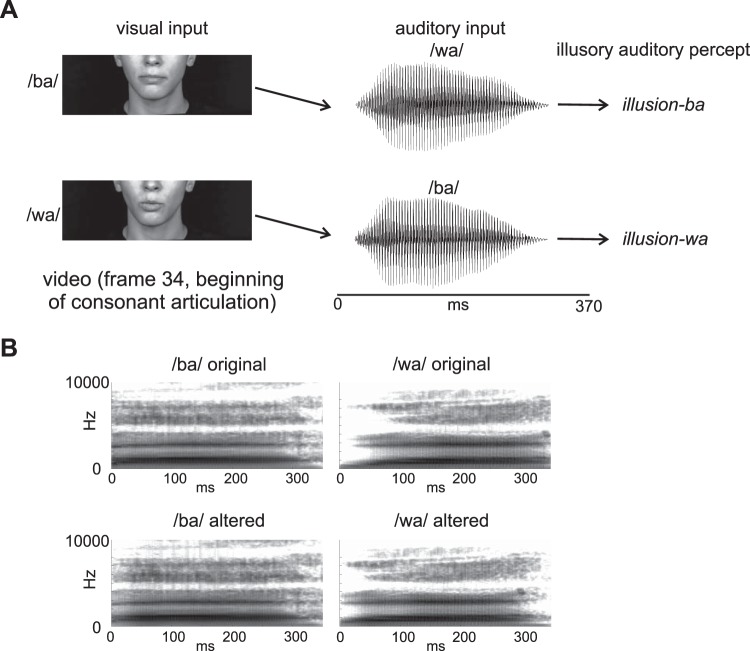
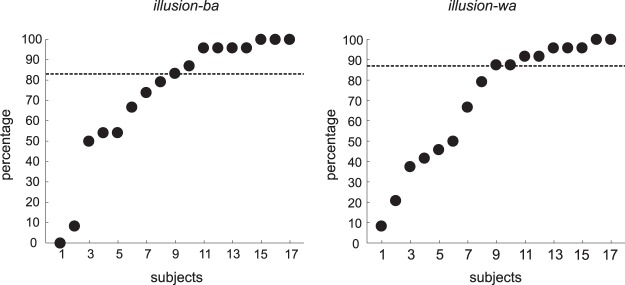
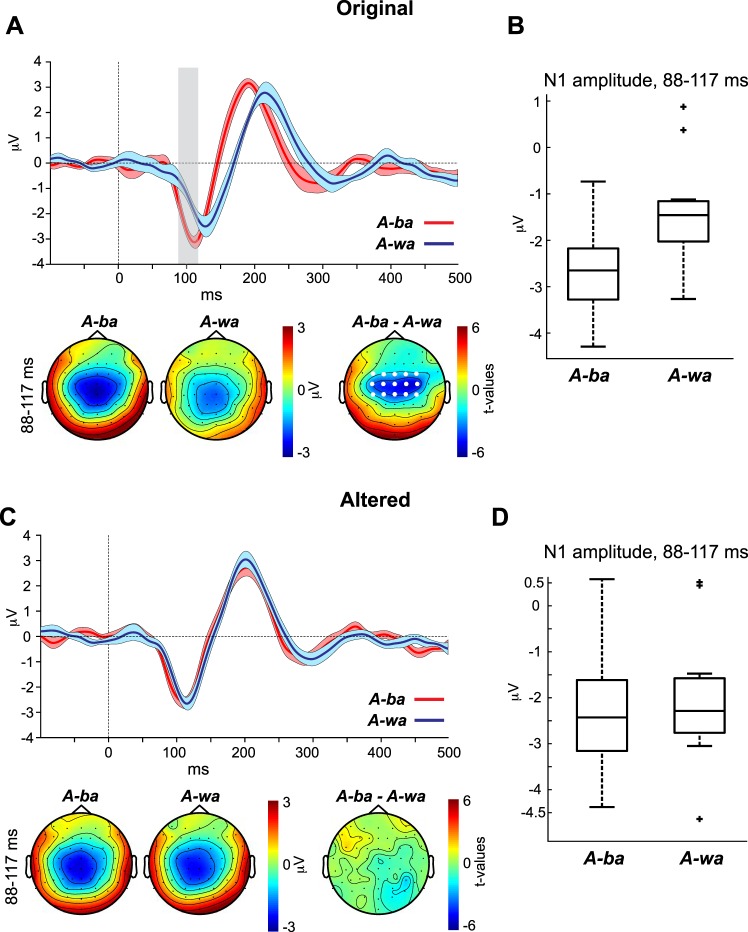
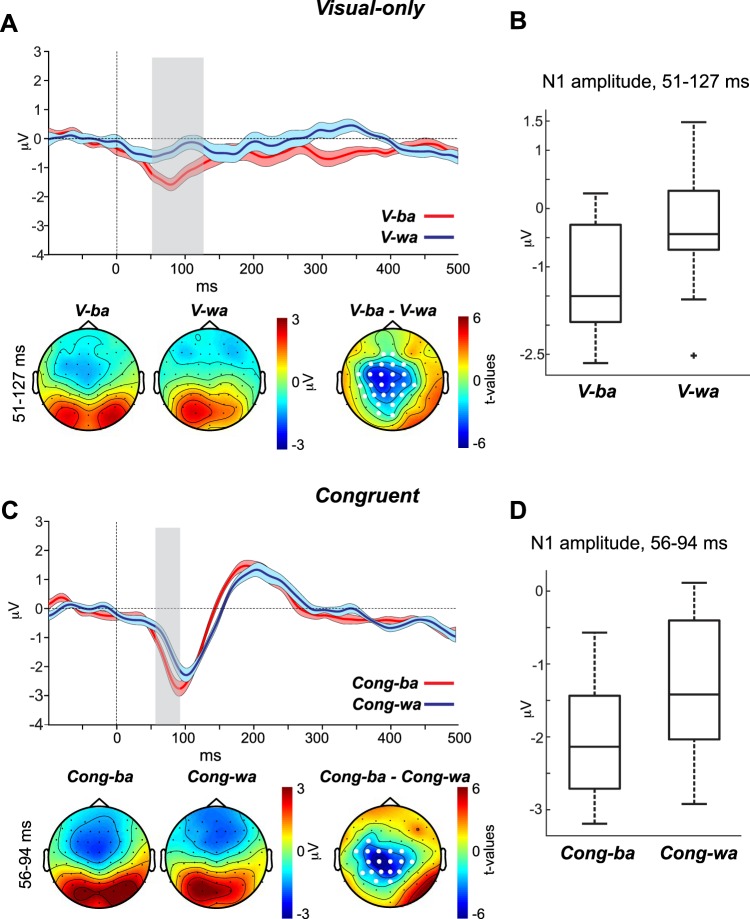
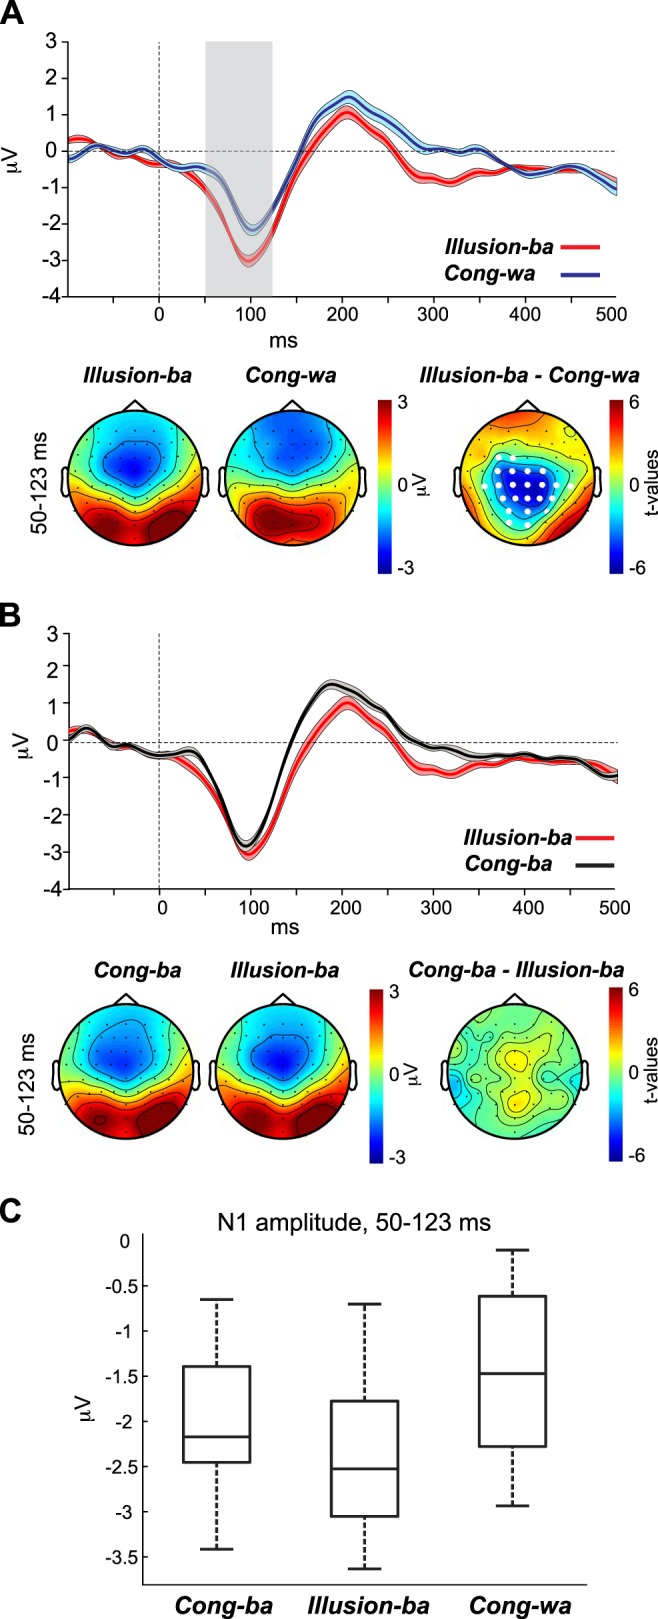
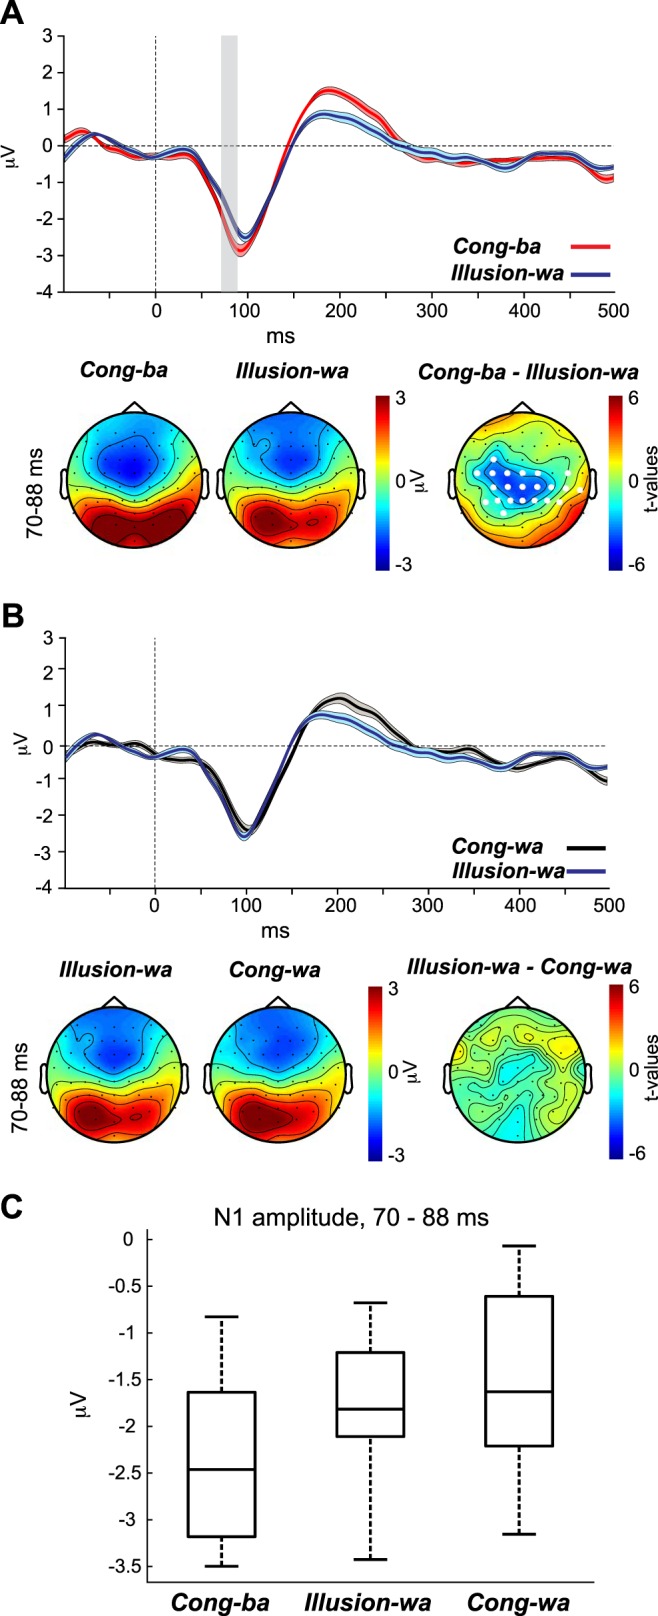
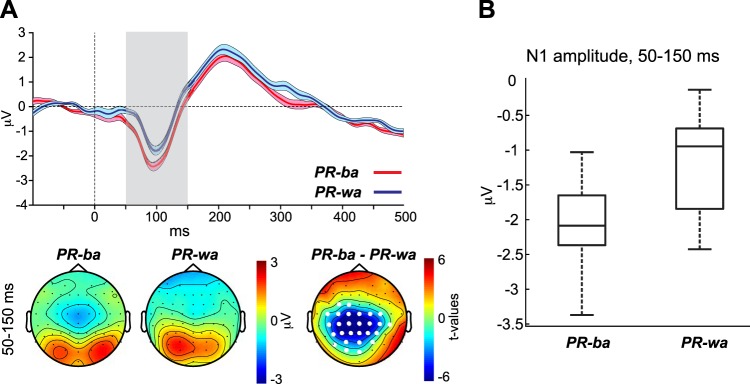
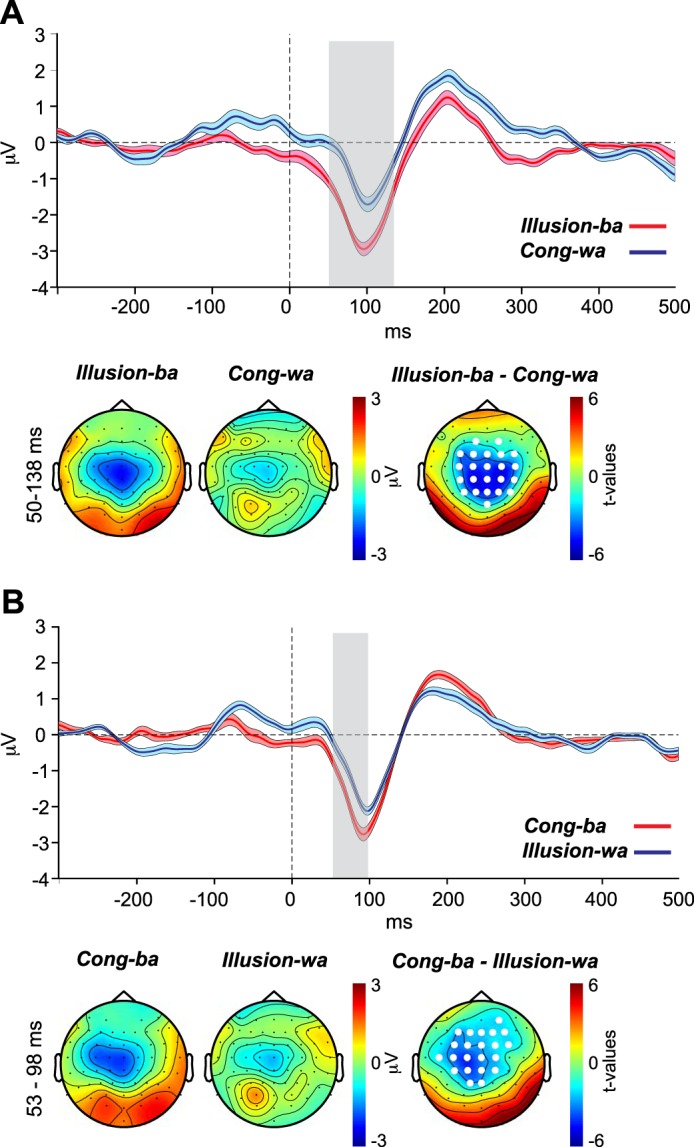
In spoken language, audiovisual (AV) perception occurs when the visual modality influences encoding of acoustic features (e.g., phonetic representations) at the auditory cortex. We examined how visual speech (mouth movements) transforms phonetic representations, indexed by changes to the N1 auditory evoked potential (AEP). EEG was acquired while human subjects watched and listened to videos of a speaker uttering consonant vowel (CV) syllables, /ba/ and /wa/, presented in auditory-only or AV congruent or incongruent contexts or in a context in which the consonants were replaced by white noise (noise replaced). Subjects reported whether they heard "ba" or "wa." We hypothesized that the auditory N1 amplitude during illusory perception (caused by incongruent AV input, as in the McGurk illusion, or white noise-replaced consonants in CV utterances) should shift to reflect the auditory N1 characteristics of the phonemes conveyed visually (by mouth movements) as opposed to acoustically. Indeed, the N1 AEP became larger and occurred earlier when listeners experienced illusory "ba" (video /ba/, audio /wa/, heard as "ba") and vice versa when they experienced illusory "wa" (video /wa/, audio /ba/, heard as "wa"), mirroring the N1 AEP characteristics for /ba/ and /wa/ observed in natural acoustic situations (e.g., auditory-only setting). This visually mediated N1 behavior was also observed for noise-replaced CVs. Taken together, the findings suggest that information relayed by the visual modality modifies phonetic representations at the auditory cortex and that similar neural mechanisms support the McGurk illusion and visually mediated phonemic restoration. NEW & NOTEWORTHY Using a variant of the McGurk illusion experimental design (using the syllables /ba/ and /wa/), we demonstrate that lipreading influences phonetic encoding at the auditory cortex. We show that the N1 auditory evoked potential morphology shifts to resemble the N1 morphology of the syllable conveyed visually. We also show similar N1 shifts when the consonants are replaced by white noise, suggesting that the McGurk illusion and the visually mediated phonemic restoration rely on common mechanisms.

Keywords: McGurk illusion; auditory evoked potential; cross-modal encoding; phonemic restoration.


Figures

Fig. 1.
Fig. 1.
A: depiction of the incongruent stimulus design giving rise to the McGurk illusion. B: spectrograms of the original and altered consonant vowel sounds used in the auditory-only experiment. Only the altered sounds were used in the main experiment.
Fig. 2.
Fig. 2.
Percentages of trials that each individual subject experienced the illusion percept in Illusion-ba (video /ba/, audio /wa/, heard as “ba”/“bwa”) and Illusion-wa (video /wa/, audio /ba/, heard as “wa”/“wba”).
Fig. 3.
Fig. 3.
A and C, top: auditory evoked potential (AEP) waveforms evoked by the original (A) and altered (C) consonant vowel (CV) (/ba/ and /wa/) sounds of the auditory-only condition. Bottom: CV-specific topographies as well as t-statistic maps for the window in which the 2 CV-specific waveforms exhibited significance (vertical gray bar). Here and in subsequent figures, time 0 indexes voice onset. Shaded areas surrounding the waveforms indicate within-subject SE. White dots on the topographies indicate the cluster of channels with significant differences. Vertical gray bars reflect the significant time points distinguishing the waveforms of the 2 conditions. B and D: the corresponding boxplots represent the N1 amplitudes for the original (B) and altered (D) stimuli, averaged across the time points that significantly distinguished the A-ba and A-wa AEP waveforms.
Fig. 4.
Fig. 4.
A and C, top: auditory evoked potential (AEP) waveforms evoked by the visual-only (A) and congruent (C) percept types. Bottom: percept-specific topographies as well as t-statistic maps for the window in which each of the 2 percept types’ waveforms exhibited significant differences. B and D: the corresponding boxplots represent the N1 amplitudes for the visual-only (B) and congruent (D) stimuli, averaged across the time points that significantly distinguished the V-ba/V-wa and Cong-ba/Cong-wa AEP waveforms, respectively.
Fig. 5.
Fig. 5.
A and B, top: auditory evoked potential (AEP) waveforms evoked by the Cong-wa and Illusion-ba (A) and Cong-ba and Illusion-ba (B) percept types. Bottom: percept-specific topographies as well as t-statistic maps for the window in which each of the 2 percept types’ waveforms exhibited significant differences. C: the corresponding boxplot represents the N1 amplitude for Cong-ba, Illusion-ba, and Cong-wa, averaged across the time points that significantly distinguished the Illusion-ba and Cong-wa AEP waveforms.
Fig. 6.
Fig. 6.
A and B, top: auditory evoked potential (AEP) waveforms evoked by the Cong-ba and Illusion-wa (A) and Cong-wa and Illusion-wa (B) percept types. Bottom: percept-specific topographies as well as t-statistic maps for the window in which each of the 2 percept types’ waveforms exhibited significant differences. C: the corresponding boxplot represents the N1 amplitude for Cong-ba, Illusion-wa, and Cong-wa, averaged across the time points that significantly distinguished the Illusion-wa and Cong-ba AEP waveforms.
Fig. 7.
Fig. 7.
A, top: auditory evoked potential (AEP) waveforms evoked by the PR-ba and PR-wa percept types. Bottom: percept-specific topographies as well as t-statistic maps for the window in which the 2 percept types’ waveforms exhibited significant differences. B: the corresponding boxplot represents the N1 amplitudes averaged across the time points that significantly distinguished the PR-ba and PR-wa AEP waveforms.
Fig. 8.
Fig. 8.
The same contrasts depicted in Fig. 5A (A) and Fig. 6A (B), with the data baselined to the −300 to −200 ms (instead of −100 to 0 ms) preacoustic period.

References

    1. Arsenault JS, Buchsbaum BR. Distributed neural representations of phonological features during speech perception. J Neurosci 35: 634–642, 2015. doi:10.1523/JNEUROSCI.2454-14.2015. - DOI - PMC - PubMed
    1. Beauchamp MS, Lee KE, Argall BD, Martin A. Integration of auditory and visual information about objects in superior temporal sulcus. Neuron 41: 809–823, 2004. doi:10.1016/S0896-6273(04)00070-4. - DOI - PubMed
    1. Beauchamp MS, Nath A, Pasalar S. fMRI-Guided transcranial magnetic stimulation reveals that the superior temporal sulcus is a cortical locus of the McGurk effect. J Neurosci 30: 2414–2417, 2010. doi:10.1523/JNEUROSCI.4865-09.2010. - DOI - PMC - PubMed
    1. Benoit MM, Raij T, Lin FH, Jääskeläinen IP, Stufflebeam S. Primary and multisensory cortical activity is correlated with audiovisual percepts. Hum Brain Mapp 31: 526–538, 2010. doi:10.1002/hbm.20884. - DOI - PMC - PubMed
    1. Bernstein LE, Auer ET Jr, Moore JK, Ponton CW, Don M, Singh M. Visual speech perception without primary auditory cortex activation. Neuroreport 13: 311–315, 2002. doi:10.1097/00001756-200203040-00013. - DOI - PubMed

Publication types

LinkOut - more resources