. 2018 Oct 10;13(10):e0200119.
doi: 10.1371/journal.pone.0200119. eCollection 2018.

Atomic force microscopy reveals new biophysical markers for monitoring subcellular changes in oxidative injury: Neuroprotective effects of quercetin at the nanoscale

Affiliations

Atomic force microscopy reveals new biophysical markers for monitoring subcellular changes in oxidative injury: Neuroprotective effects of quercetin at the nanoscale

Maja Jazvinšćak Jembrek et al. PLoS One. .

Erratum in

Abstract

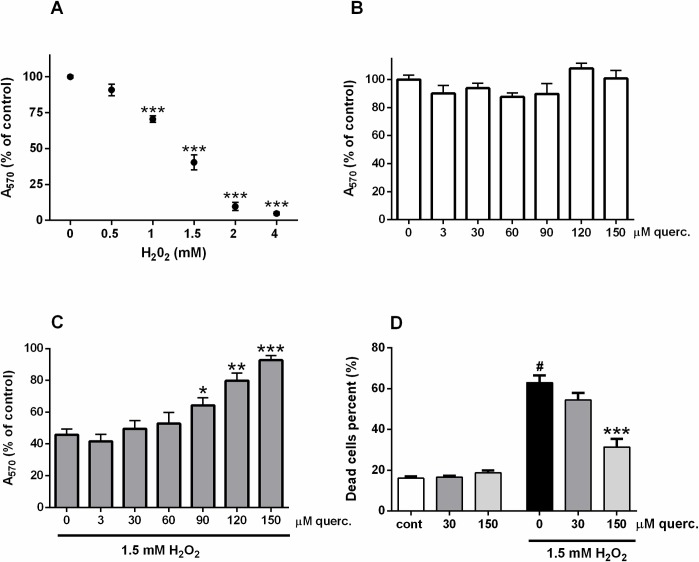
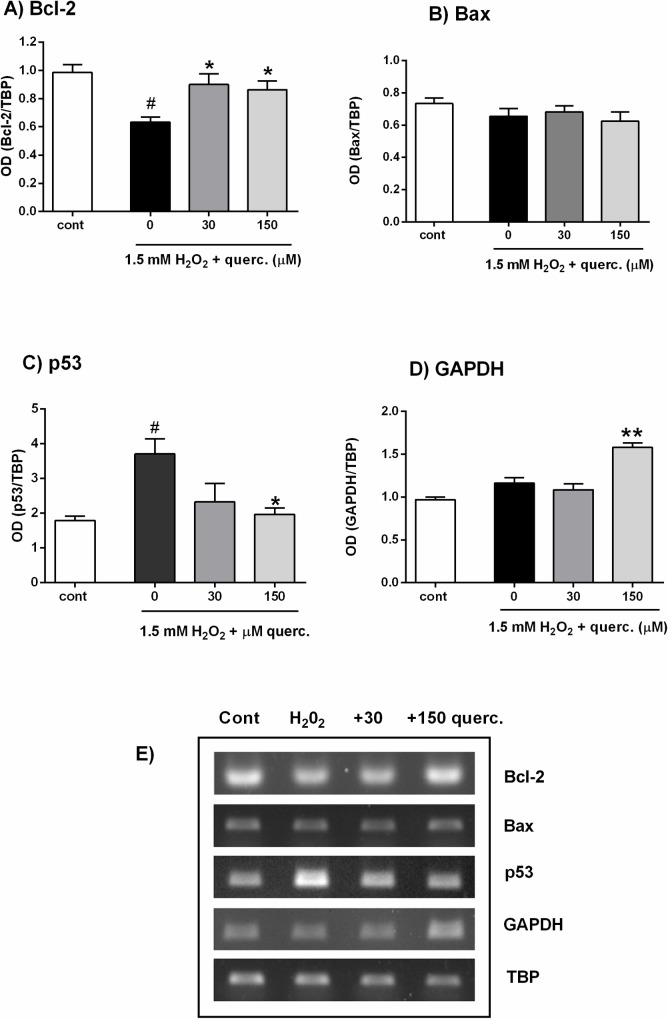
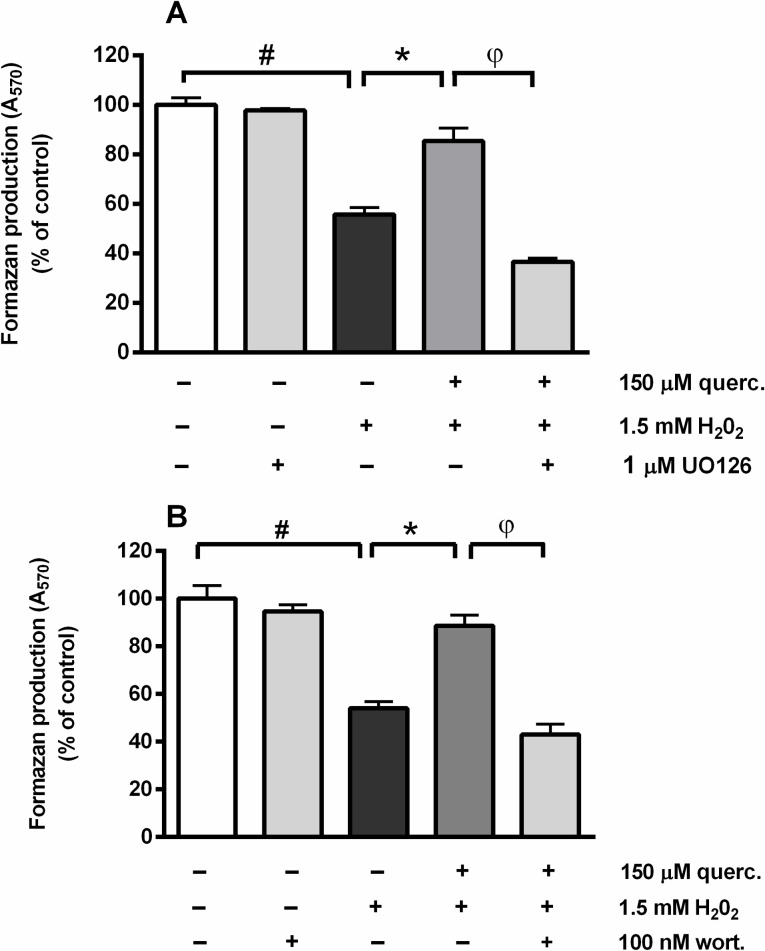
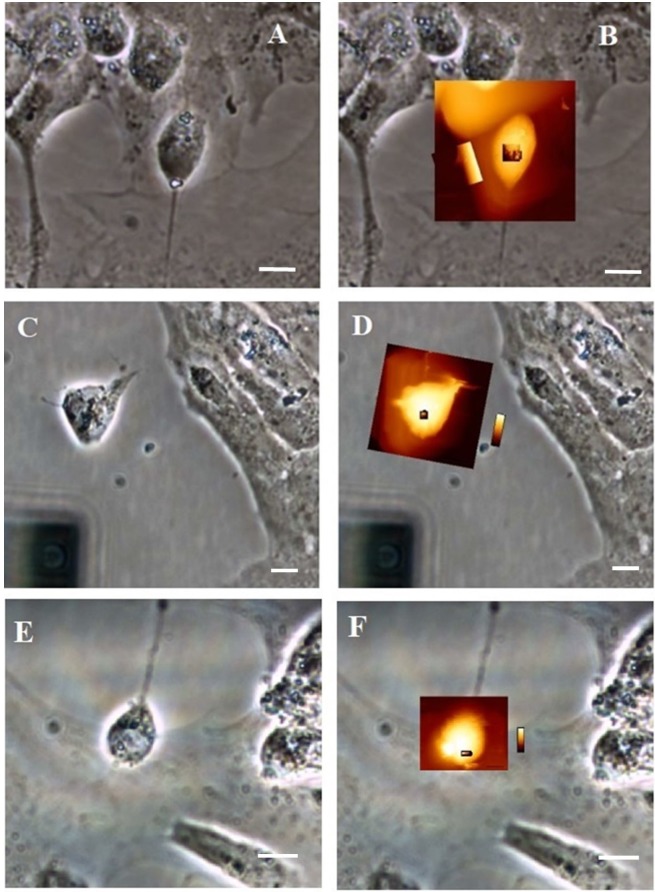
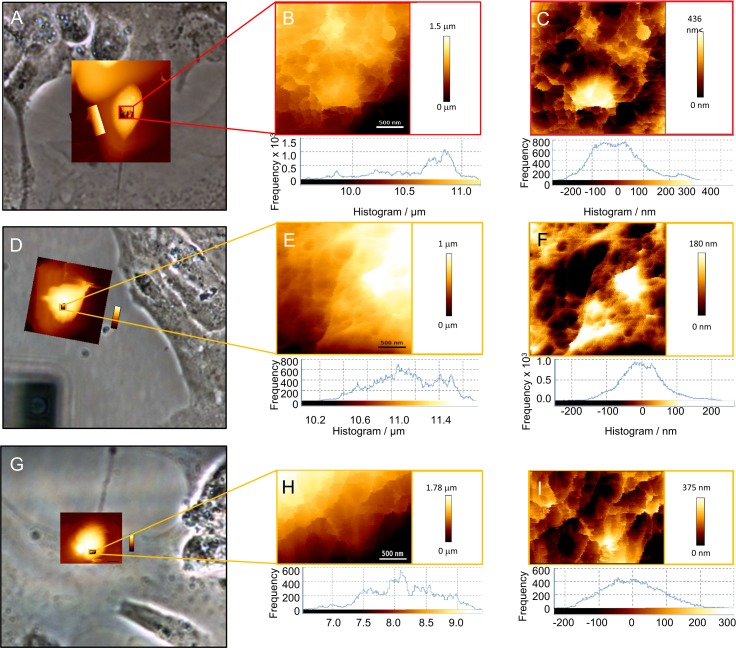
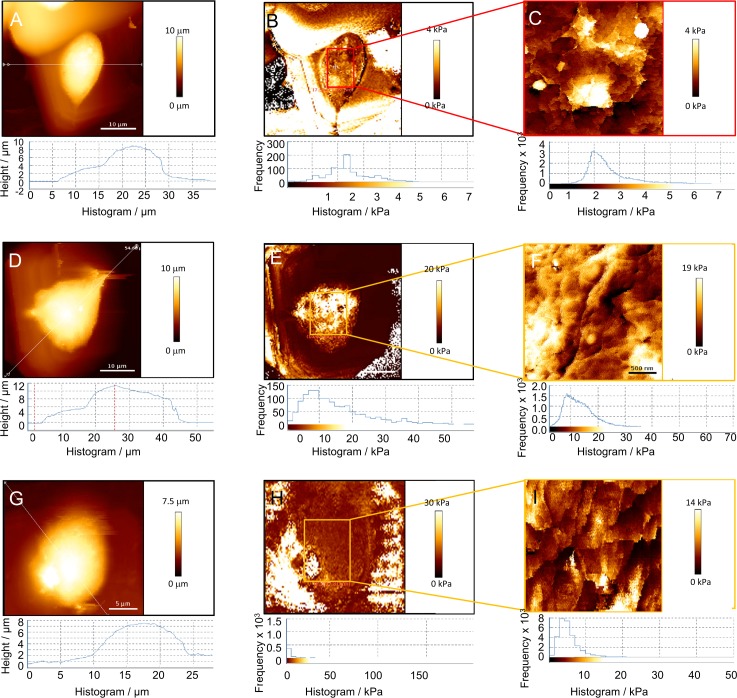
Oxidative stress has been recognised as an important pathological mechanism underlying the development of neurodegenerative diseases. The biomarkers for assessing the degree of oxidative stress have been attracting much interest because of their potential clinical relevance in understanding the cellular effects of free radicals and evaluation of the efficacy of drug treatment. Here, an interdisciplinary approach using atomic force microscopy (AFM) and cellular and biological molecular methods were used to investigate oxidative damage in P19 neurons and to reveal the underlying mechanism of protective action of quercetin. Biological methods demonstrated the oxidative damage of P19 neurons and showed that quercetin improved neuronal survival by preventing H2O2-induced p53 and Bcl-2 down-regulation and modulated Akt and ERK1/2 signalling pathways. For the first time, AFM was employed to evaluate morphologically (roughness, height, Feret dimension) and nanomechanical (elasticity) properties in H2O2-induced neuronal damage. The AFM analysis revealed that quercetin suppressed H2O2-provoked changes in cell membrane elasticity and morphological properties, thus confirming its neuroprotective activity. The obtained results indicate the potential of AFM-measured parameters as a biophysical markers of oxidative stress-induced neurodegeneration. In general, our study suggests that AFM can be used as a highly valuable tool in other biomedical applications aimed at screening and monitoring of drug-induced effects at cellular level.


Conflict of interest statement

The authors have declared that no competing interests exist.

Figures

Fig 1
Fig 1. Quercetin improved viability of P19 neurons exposed to H2O2.
In a dose-dependent manner, H2O2 reduced the viability of P19 neurons (A). Quercetin failed to modify neuronal viability when applied alone up to 150 μM concentration (B). Oxidative injury of P19 neurons was induced by exposure to 1.5 mM H2O2. Cell death of damaged neurons was analysed in the presence of various concentrations of quercetin by MTT assay (C) or trypan blue exclusion assay (D). Data are expressed as means ± SEM from four to five independent experiments. #P < 0.0001 vs. cont; *P < 0.05, **P < 0.001 and ***P < 0.0001 vs. 0 (ONE-way ANOVA followed by Tukey's or Dunnett's multiple comparison test).
Fig 2
Fig 2. Quercetin did not affect an H2O2-induced decrease in content.
At the end of the 24 h treatment, GSH content was depleted in P19 neurons exposed to 1.5 mM H2O2. Presence of quercetin did not modify the intracellular pool of GSH. Values represent the mean ± SEM of three independent experiments performed in triplicate. #P < 0.0001 vs. vehicle-treated group (ONE-way ANOVA followed by Tukey's multiple comparison tests).
Fig 3
Fig 3. Effects of quercetin on Bcl-2, Bax, p53 and GAPDH mRNA expression during severe oxidative injury.
P19 neurons were exposed to 1.5 mM H2O2 alone or in the presence of 30 and 150 μM quercetin. Total RNA was extracted and reverse transcribed into cDNA. The obtained cDNA was further amplified using specific primers. Following densitometric quantification, band intensities were normalized to the expression of housekeeping gene TBP. The data are expressed as means ± SEM from 3 independent RT-PCR analyses. #P < 0.05 vs. cont; *P < 0.05, **P < 0.0001 vs. 0 group (ONE-way ANOVA and post-hoc Tukey’s multiple comparison test). Representative agarose gel electrophoresis is also shown.
Fig 4
Fig 4. UO126 (inhibitor of the ERK1/2 pathway) and wortmannin (Akt/PKB inhibitor) prevented the neuroprotective effect of quercetin against oxidative injury.
P19 neurons were treated with UO126 or wortmannin for 1 h prior to and during 24 h H2O2 treatment. UO126 applied at 1 μM concentration (upper graph), as well as 100 nM wortmannin (bottom graph) diminished survival of P19 neurons exposed simultaneously to 1.5 mM H2O2 and 150 μM quercetin for 24 h. Values are expressed as means ± SEM from three independent experiments performed in quadruplets. *P < 0.001 vs. 1.5 mM H2O2 alone; #P < 0.0001 vs. cont; φP < 0.0001 vs. H2O2 + quercetin (one-way ANOVA followed by post hoc Tukey's test).
Fig 5
Fig 5
Optical images (A, C, E) and overlay of optical and QI images (B, D, F) of control neuronal cells (A, B), H2O2-exposed neurons (C, D) and neurons simultaneously exposed to both quercetin and H2O2 (E, F). Scale bar = 10 μm.
Fig 6
Fig 6
Low-resolution inverted optical microscopic images on neuron soma control system (A), on neuron after the treatment with H2O2 (D) and after the simultaneous exposure to both quercetin and H2O2 (G). The highest region of the soma was zoomed (B, E, H). The relative height differences between individual regions were consistent with data acquired from inverted optical microscopic images and indicated within histograms shown in (C, F, I). Scales are indicated. Frequency histograms of unfiltered normalized cut-off height (B, E, H bottom) and filtered normalized cut-off height (C, F, I bottom) for the line profile of a neuron.
Fig 7
Fig 7
The height topographic image of specific somatic regions in control system (A), H2O2-exposed neurons (D) and in neurons simultaneously exposed to both quercetin and H2O2 (G) determined by nanomechanical measurements using AFM. The nanomechanical mapping and histogram of Young´ modulus of the specific somatic region in control system (B), H2O2-exposed neurons (E) and neurons simultaneously exposed to both quercetin and H2O2 (H). Colour-coded frame lines identified zoomed domain of control system (C) H2O2-exposed neurons (F) and neurons simultaneously exposed to both quercetin and H2O2 (I).

Similar articles

Cited by

References

    1. Gandhi S, Abramov AY. Mechanism of oxidative stress in neurodegeneration. Oxid Med Cell Longev. 2012;2012: 428010 10.1155/2012/428010 - DOI - PMC - PubMed
    1. Wang X, Michaelis EK. Selective neuronal vulnerability to oxidative stress in the brain. Front Aging Neurosci. 2010;2: 12 10.3389/fnagi.2010.00012 - DOI - PMC - PubMed
    1. Bienert GP, Schjoerring JK, Jahn TP. Membrane transport of hydrogen peroxide. Biochim Biophys Acta. 2006;1758: 994–1003. 10.1016/j.bbamem.2006.02.015 - DOI - PubMed
    1. Lennicke C, Rahn J, Lichtenfels R, Wessjohann LA, Seliger B. Hydrogen peroxide—production, fate and role in redox signaling of tumor cells. Cell Commun Signal CCS. 2015;13: 39 10.1186/s12964-015-0118-6 - DOI - PMC - PubMed
    1. Crossthwaite AJ, Hasan S, Williams RJ. Hydrogen peroxide-mediated phosphorylation of ERK1/2, Akt/PKB and JNK in cortical neurones: dependence on Ca(2+) and PI3-kinase. J Neurochem. 2002;80: 24–35. 10.1046/j.0022-3042.2001.00637.x - DOI - PubMed

Publication types

MeSH terms