

Impaired myogenic development, differentiation and function in hESC-derived SMA myoblasts and myotubes
- PMID: 30304024
- PMCID: PMC6179271
- DOI: 10.1371/journal.pone.0205589
Impaired myogenic development, differentiation and function in hESC-derived SMA myoblasts and myotubes
Abstract
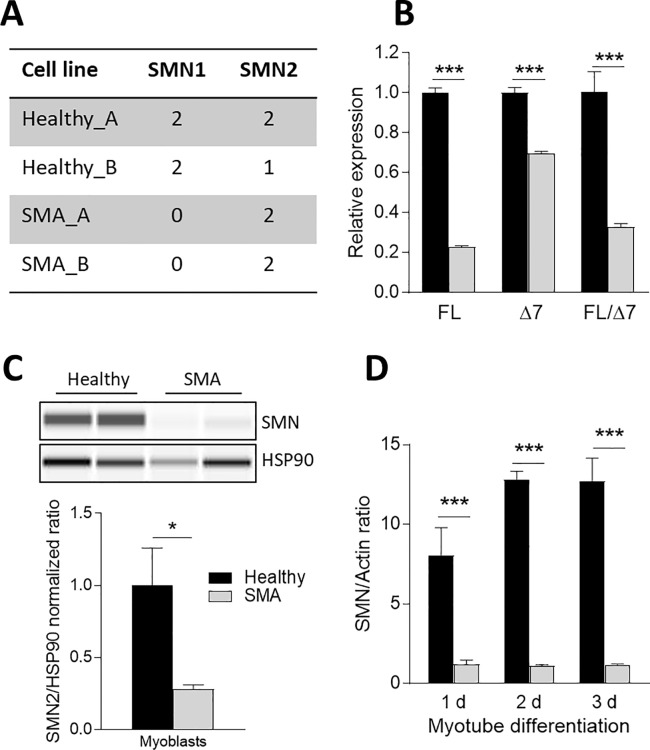
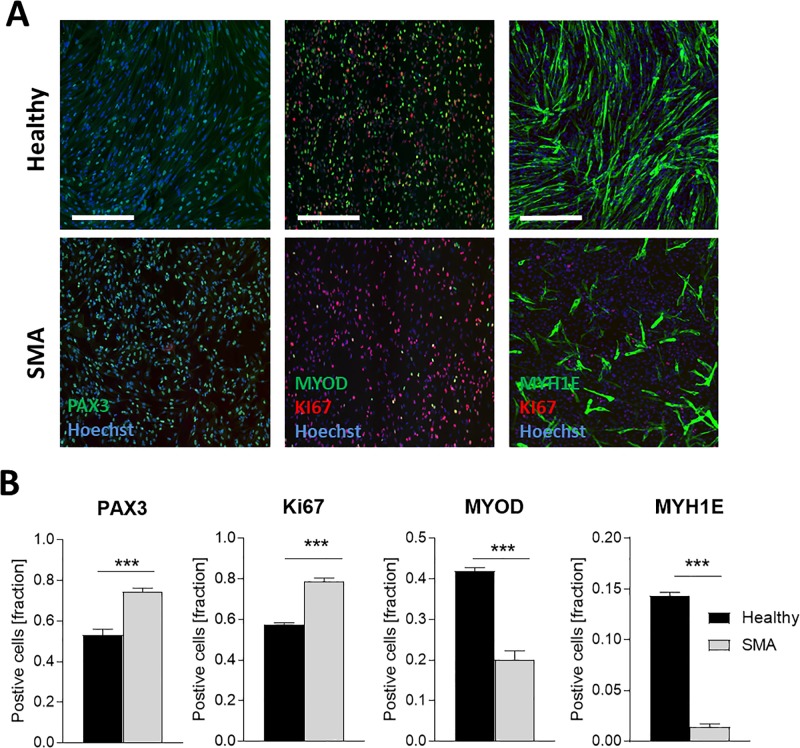
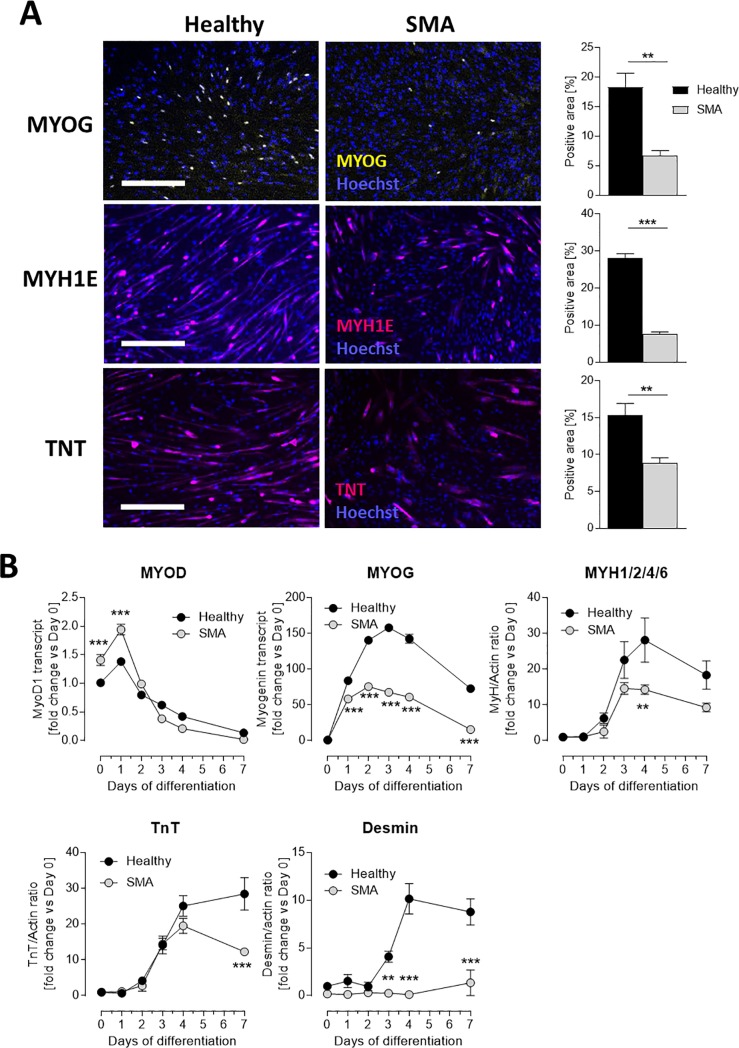
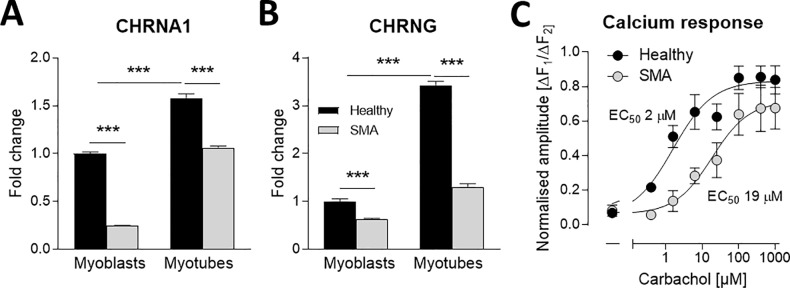
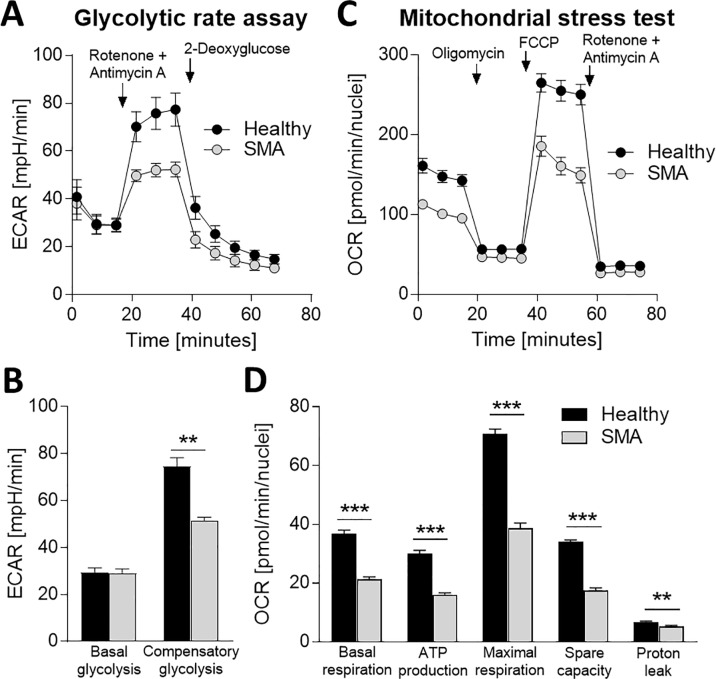
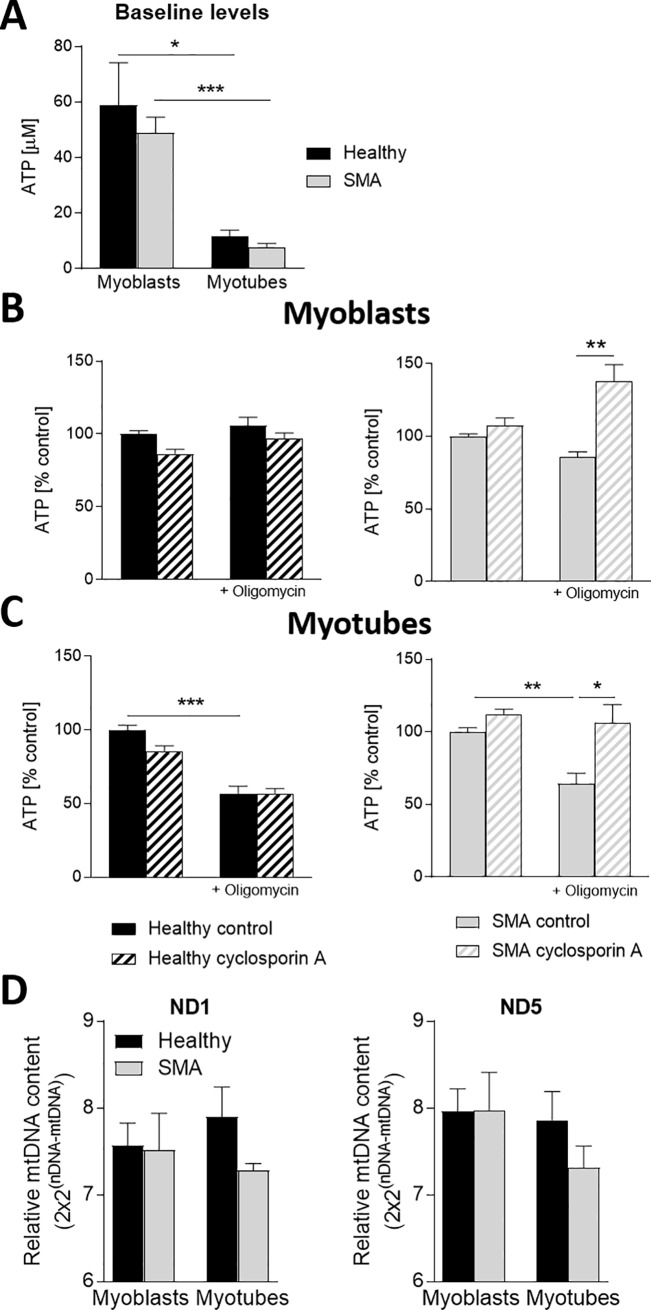
Spinal muscular atrophy (SMA) is a severe genetic disorder that manifests in progressive neuromuscular degeneration. SMA originates from loss-of-function mutations of the SMN1 (Survival of Motor Neuron 1) gene. Recent evidence has implicated peripheral deficits, especially in skeletal muscle, as key contributors to disease progression in SMA. In this study we generated myogenic cells from two SMA-affected human embryonic stem cell (hESC) lines with deletion of SMN1 bearing two copies of the SMN2 gene and recapitulating the molecular phenotype of Type 1 SMA. We characterized myoblasts and myotubes by comparing them to two unaffected, control hESC lines and demonstrate that SMA myoblasts and myotubes showed altered expression of various myogenic markers, which translated into an impaired in vitro myogenic maturation and development process. Additionally, we provide evidence that these SMN1 deficient cells display functional deficits in cholinergic calcium signaling response, glycolysis and oxidative phosphorylation. Our data describe a novel human myogenic SMA model that might be used for interrogating the effect of SMN depletion during skeletal muscle development, and as model to investigate biological mechanisms targeting myogenic differentiation, mitochondrial respiration and calcium signaling processes in SMA muscle cells.
Conflict of interest statement
NH, DH, SS, CT, KM, ME, FM were employed by F. Hoffmann-La Roche while conducting the work on this project and declare no conflict of interest. SP, AS, SL, CP, MHB, US were employed by Genea Biocells while conducting the work on this project and declare no conflict of interest. This does not alter our adherence to PLOS ONE policies on sharing data and materials.
Figures
Similar articles
-
Established Stem Cell Model of Spinal Muscular Atrophy Is Applicable in the Evaluation of the Efficacy of Thyrotropin-Releasing Hormone Analog.Stem Cells Transl Med. 2016 Feb;5(2):152-63. doi: 10.5966/sctm.2015-0059. Epub 2015 Dec 18. Stem Cells Transl Med. 2016. PMID: 26683872 Free PMC article.
-
A cell-autonomous defect in skeletal muscle satellite cells expressing low levels of survival of motor neuron protein.Dev Biol. 2012 Aug 15;368(2):323-34. doi: 10.1016/j.ydbio.2012.05.037. Epub 2012 Jun 15. Dev Biol. 2012. PMID: 22705478 Free PMC article.
-
SAHA ameliorates the SMA phenotype in two mouse models for spinal muscular atrophy.Hum Mol Genet. 2010 Apr 15;19(8):1492-506. doi: 10.1093/hmg/ddq023. Epub 2010 Jan 22. Hum Mol Genet. 2010. PMID: 20097677
-
The Biochemistry of Survival Motor Neuron Protein Is Paving the Way to Novel Therapies for Spinal Muscle Atrophy.Biochemistry. 2020 Apr 14;59(14):1391-1397. doi: 10.1021/acs.biochem.9b01124. Epub 2020 Apr 2. Biochemistry. 2020. PMID: 32227847 Review.
-
Mechanism of Splicing Regulation of Spinal Muscular Atrophy Genes.Adv Neurobiol. 2018;20:31-61. doi: 10.1007/978-3-319-89689-2_2. Adv Neurobiol. 2018. PMID: 29916015 Free PMC article. Review.
Cited by
-
Consequences of epigenetic derepression in facioscapulohumeral muscular dystrophy.Clin Genet. 2020 Jun;97(6):799-814. doi: 10.1111/cge.13726. Epub 2020 Mar 4. Clin Genet. 2020. PMID: 32086799 Free PMC article. Review.
-
How Inflammation Pathways Contribute to Cell Death in Neuro-Muscular Disorders.Biomolecules. 2021 Jul 28;11(8):1109. doi: 10.3390/biom11081109. Biomolecules. 2021. PMID: 34439778 Free PMC article. Review.
-
Characterization of SMA type II skeletal muscle from treated patients shows OXPHOS deficiency and denervation.JCI Insight. 2024 Sep 12;9(20):e180992. doi: 10.1172/jci.insight.180992. JCI Insight. 2024. PMID: 39264856 Free PMC article.
-
Muscle-specific SMN reduction reveals motor neuron-independent disease in spinal muscular atrophy models.J Clin Invest. 2020 Mar 2;130(3):1271-1287. doi: 10.1172/JCI131989. J Clin Invest. 2020. PMID: 32039917 Free PMC article.
-
Survival motor neuron deficiency slows myoblast fusion through reduced myomaker and myomixer expression.J Cachexia Sarcopenia Muscle. 2021 Aug;12(4):1098-1116. doi: 10.1002/jcsm.12740. Epub 2021 Jun 11. J Cachexia Sarcopenia Muscle. 2021. PMID: 34115448 Free PMC article.
References
Publication types
MeSH terms
Substances
Grants and funding
LinkOut - more resources
Full Text Sources
Medical
