Observational Study
. 2018 Oct 10;13(10):e0204105.
doi: 10.1371/journal.pone.0204105. eCollection 2018.

Small intra-individual variability of the pre-ejection period justifies the use of pulse transit time as approximation of the vascular transit

Affiliations
Observational Study

Small intra-individual variability of the pre-ejection period justifies the use of pulse transit time as approximation of the vascular transit

Minke C Kortekaas et al. PLoS One. .

Abstract

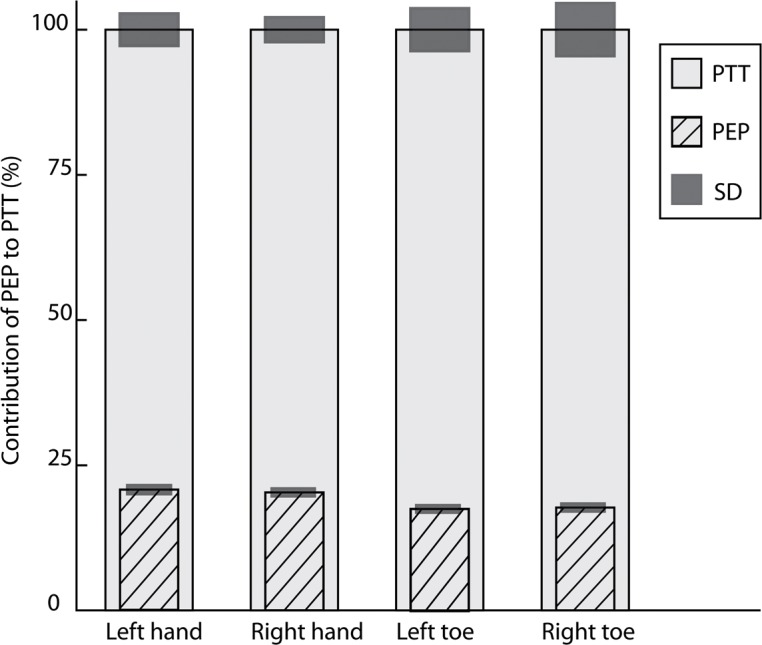
Background: Vascular transit time (VTT) is the propagation time of a pulse wave through an artery; it is a measure for arterial stiffness. Because reliable non-invasive VTT measurements are difficult, as an alternative we measure pulse transit time (PTT). PTT is defined as the time between the R-wave on electrocardiogram and arrival of the resulting pulse wave in a distal location measured with photoplethysmography (PPG). The time between electrical activation of the ventricles and the resulting pulse wave after opening of the aortic valve is called the pre-ejection period (PEP), a component of PTT. The aim of this study was to estimate the variability of PEP at rest, to establish how accurate PTT is as approximation of VTT.

Methods: PTT was measured and PEP was assessed with echocardiography (gold standard) in three groups of 20 volunteers: 1) a control group without cardiovascular disease aged <50 years and 2) aged >50 years, and 3) a group with cardiovascular risk factors, defined as arterial hypertension, dyslipidemia, kidney failure and diabetes mellitus.

Results: Per group, the mean PEP was: 1) 58.5 ± 13.0 ms, 2) 52.4 ± 11.9 ms, and 3) 57.6 ± 11.6 ms. However, per individual the standard deviation was much smaller, i.e. 1) 2.0-5.9 ms, 2) 2.8-5.1 ms, and 3) 1.6-12.0 ms, respectively. There was no significant difference in the mean PEP of the 3 groups (p = 0.236).

Conclusion: In conclusion, the intra-individual variability of PEP is small. A change in PTT in a person at rest is most probably the result of a change in VTT rather than of PEP. Thus, PTT at rest is an easy, non-invasive and accurate approximation of VTT for monitoring arterial stiffness.


Conflict of interest statement

The authors have declared that no competing interests exist.

Figures

Fig 1
Fig 1. Pre-ejection period.
A, electrocardiogram; B, Doppler mode echocardiography signal over the aortic valve; C, photoplethysmographic pulse wave. PEP = pre-ejection period, VTT = vascular transit time, PTT = pulse transit time.
Fig 2
Fig 2. Box plots of the pre-ejection period (PEP) of 10 consecutive heartbeats of the 20 participants and of the total group.
Group 1: control group aged <50 years. Group 2: control group aged >50 years. Group 3: participants with a cardiovascular risk factor. The boxes represent the median with interquartile range. The whiskers represent the minimum and maximum value.
Fig 3
Fig 3. Contribution of the PEP (mean and SD) to the PTT for each sensor of group 1 (control group aged <50 years).
All values are normalized to a percentage (%) of the mean PTT (which is 100%) of the specific sensor. PTTMean% of left hand (n = 19) 100%±3.1%, PTTMean% of right hand (n = 20): 100%±2.4% (p = 0.004). Contribution of PEPMean% for PTT of left versus right hand 22.2%±1.3% versus 21.0%±1.3%. PTTMean% of left big toe (n = 18) 100%±4.7%, PTTMean% right big toe (n = 17) 100%±4.8%. Contribution of PEPMean% for left big toe versus right big toe 16.5%±1.0% versus 16.3%±1.0%.
Fig 4
Fig 4. Contribution of the PEP (mean and SD) to the PTT for each sensor of group 2 (control group aged >50 years).
All values are normalized to a percentage (%) of the mean PTT (which is 100%) of the specific sensor. PTTMean% of left hand (n = 19) 100%±3.5%, PTT of right hand (n = 20) 100%±2.6%. Contribution of PEPMean% for PTT of left versus right hand PEP 18.7%±1.4% versus PEP 19.4%±1.4%. PTTMean% of left big toe (n = 18) 100%±5.9%, PTTMean% right big toe (n = 17) PTT 100%±6.3%. Contribution of PEPMean% for left big toe versus right big toe 4.8%±1.1% versus 5.1%±1.1%.
Fig 5
Fig 5. Columns represent the contribution of the PEP (mean and SD) to the PTT for each sensor of group 3 (participants with a cardiovascular risk factor).
All values are normalized to a percentage (%) of the mean PTT (which is 100%) of the specific sensor. PTTMean% of left hand (n = 19) 100%±5.5%, PTT of right hand (n = 20) 100%±4.2%. Contribution of PEPMean% for PTT of left versus right hand 20.7%±1.5% versus 20.3%±1.4%. PTTMean% of left big toe (n = 15) 100%±7.3%, PTTMean% right big toe (n = 14) 100%±9.1%. Contribution of PEPMean% for left big toe versus right big toe 17.6%±1.3% versus 17.7%±1.4%.

Similar articles

Cited by

References

    1. Nitzan M, Khanokh B, Slovik Y. The difference in pulse transit time to the toe and finger measured by photoplethysmography. Physiol Meas. 2002;23(1):85–93. - PubMed
    1. Suurland J, van der Heijden KB, Huijbregts SCJ, van Goozen SHM, Swaab H. Infant Parasympathetic and Sympathetic Activity during Baseline, Stress and Recovery: Interactions with Prenatal Adversity Predict Physical Aggression in Toddlerhood. J Abnorm Child Psychol. 2017. - PMC - PubMed
    1. Wang A, Tao J, Guo X, Liu X, Luo Y, Liu X, et al. The product of resting heart rate times blood pressure is associated with high brachial-ankle pulse wave velocity. PLoS One. 2014;9(9):e107852 10.1371/journal.pone.0107852 - DOI - PMC - PubMed
    1. Muehlsteff J, Aubert XL, Schuett M. Cuffless estimation of systolic blood pressure for short effort bicycle tests: the prominent role of the pre-ejection period. Conf Proc IEEE Eng Med Biol Soc. 2006;1:5088–92. 10.1109/IEMBS.2006.260275 - DOI - PubMed
    1. Zhang G, Gao M, Xu D, Olivier NB, Mukkamala R. Pulse arrival time is not an adequate surrogate for pulse transit time as a marker of blood pressure. J Appl Physiol. 2011;111(6):1681–6. 10.1152/japplphysiol.00980.2011 - DOI - PubMed

Publication types