. 2018 Nov 1;75(11):1146-1155.
doi: 10.1001/jamapsychiatry.2018.2467.

Mapping the Heterogeneous Phenotype of Schizophrenia and Bipolar Disorder Using Normative Models

Affiliations

Mapping the Heterogeneous Phenotype of Schizophrenia and Bipolar Disorder Using Normative Models

Thomas Wolfers et al. JAMA Psychiatry. .

Abstract

Importance: Schizophrenia and bipolar disorder are severe and complex brain disorders characterized by substantial clinical and biological heterogeneity. However, case-control studies often ignore such heterogeneity through their focus on the average patient, which may be the core reason for a lack of robust biomarkers indicative of an individual's treatment response and outcome.

Objectives: To investigate the degree to which case-control analyses disguise interindividual differences in brain structure among patients with schizophrenia and bipolar disorder and to map the brain alterations linked to these disorders at the level of individual patients.

Design, setting, and participants: This study used cross-sectional, T1-weighted magnetic resonance imaging data from participants recruited for the Thematically Organized Psychosis study from October 27, 2004, to October 17, 2012. Data were reanalyzed in 2017 and 2018. Patients were recruited from inpatient and outpatient clinics in the Oslo area of Norway, and healthy individuals from the same catchment area were drawn from the national population registry.

Main outcomes and measures: Interindividual differences in brain structure among patients with schizophrenia and bipolar disorder. Voxel-based morphometry maps were computed, which were used for normative modeling to map the range of interindividual differences in brain structure.

Results: This study included 218 patients with schizophrenia spectrum disorders (mean [SD] age, 30 [9.3] years; 126 [57.8%] male), of whom 163 had schizophrenia (mean [SD] age, 31 [8.7] years; 105 [64.4%] male) and 190 had bipolar disorder (mean [SD] age, 34 [11.3] years; 79 [41.6%] male), and 256 healthy individuals (mean [SD] age, 34 [9.5] years; 140 [54.7%] male). At the level of the individual, deviations from the normative model were frequent in both disorders but highly heterogeneous. Overlap of more than 2% among patients was observed in only a few loci, primarily in frontal, temporal, and cerebellar regions. The proportion of alterations was associated with diagnosis and cognitive and clinical characteristics within clinical groups. Patients with schizophrenia, on average, had significantly reduced gray matter in frontal regions, cerebellum, and temporal cortex. In patients with bipolar disorder, mean deviations were primarily present in cerebellar regions.

Conclusions and relevance: This study found that group-level differences disguised biological heterogeneity and interindividual differences among patients with the same diagnosis. This finding suggests that the idea of the average patient is a noninformative construct in psychiatry that falls apart when mapping abnormalities at the level of the individual patient. This study presents a workable route toward precision medicine in psychiatry.


Conflict of interest statement

Conflict of Interest Disclosures: Dr Franke reported receiving educational speaking fees from Shire and Medice. Dr Andreassen reported receiving speakers honoraria from Lundbeck and Sunovion. Dr Buitelaar reporting working as a consultant to or advisory board member of and/or speaker for Janssen Cilag BV, Eli Lilly and Company, Medice, Roche, and Servier. Dr Beckmann reported being the director and a shareholder of SBGneuro Ltd. No other disclosures were reported.

Figures

Figure 1.
Figure 1.. Characterization of the Normative Model
Normative model from 20 to 70 years of age. Rate of volume change for women is shown, which was virtually identical to that for men. Scale indicates rate of volume change.
Figure 2.
Figure 2.. Characterization of Mean Group-Level Deviations From the Normative Model
The mean differences were corrected for modalities and multiple comparisons. A-C, In gray matter, healthy individuals had stronger mean negative deviations than individuals with schizophrenia, especially in the frontal, temporal, and cerebellar regions; furthermore, individuals with bipolar disorder had stronger mean negative deviations than healthy individuals in the cerebellum. Patients with bipolar disorder had weaker mean negative deviations than patients with schizophrenia in the frontal and temporal brain regions but not in the cerebellum. D-F, In white matter, the differences were comparable to those observed in gray matter. Healthy individuals had no regions with significant deviations in either gray or white matter. Scale indicates corrected P values.
Figure 3.
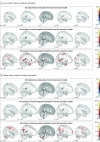
Figure 3.. Characterization of Extreme Deviations From the Normative Model in Healthy Control Individuals
Top panel shows the mean deviations from the normative model, and the bottom 2 panels show the percentage of extreme deviations from the normative model at each brain locus, that is, an extreme value of |z| > 2.6. Healthy individuals did not deviate from the normative model on average.
Figure 4.
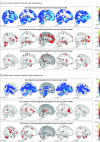
Figure 4.. Characterization of Extreme Deviations From the Normative Model in Patients With Schizophrenia
The top panel shows a map of group-level mean deviations (|z| > 2.6). The bottom 2 panels show the percentage of extreme deviations from the normative model at each brain locus, that is, an extreme value of |z| > 2.6. On average, frontal regions, the cerebellum, and the temporal cortex had negative deviations in schizophrenia. Deviations overlapped little, with only a few brain loci showing extreme deviations in more than 2% of the patients.
Figure 5.
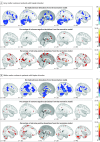
Figure 5.. Characterization of Extreme Deviations From the Normative Model in Patients With Bipolar Disorder
The top panel shows a map of group-level mean deviations (|z| > 2.6). The bottom 2 panels show the percentage of extreme deviations from the normative model at each brain locus, that is, an extreme value of |z| > 2.6. For bipolar disorder, deviations were less pronounced than for schizophrenia and primarily present in cerebellar regions. Deviations overlapped little, with only a few brain loci showing extreme deviations in more than 2% of patients.

Comment in

References

    1. Kalia M. Biomarkers for personalized oncology: recent advances and future challenges. Metabolism. 2015;64(3)(suppl 1):S16-S21. doi:10.1016/j.metabol.2014.10.027 - DOI - PubMed
    1. Abi-Dargham A, Horga G. The search for imaging biomarkers in psychiatric disorders. Nat Med. 2016;22(11):1248-1255. doi:10.1038/nm.4190 - DOI - PubMed
    1. Kapur S, Phillips AG, Insel TR. Why has it taken so long for biological psychiatry to develop clinical tests and what to do about it? Mol Psychiatry. 2012;17(12):1174-1179. doi:10.1038/mp.2012.105 - DOI - PubMed
    1. Insel T, Cuthbert B, Garvey M, et al. . Research domain criteria (RDoC): toward a new classification framework for research on mental disorders. Am J Psychiatry. 2010;167(7):748-751. doi:10.1176/appi.ajp.2010.09091379 - DOI - PubMed
    1. Zhu M, Zhao S. Candidate gene identification approach: progress and challenges. Int J Biol Sci. 2007;3(7):420-427. - PMC - PubMed

Publication types