

Genetic mechanisms underlying spermatic and testicular traits within and among cattle breeds: systematic review and prioritization of GWAS results
- PMID: 30304443
- PMCID: PMC6276581
- DOI: 10.1093/jas/sky382
Genetic mechanisms underlying spermatic and testicular traits within and among cattle breeds: systematic review and prioritization of GWAS results
Abstract
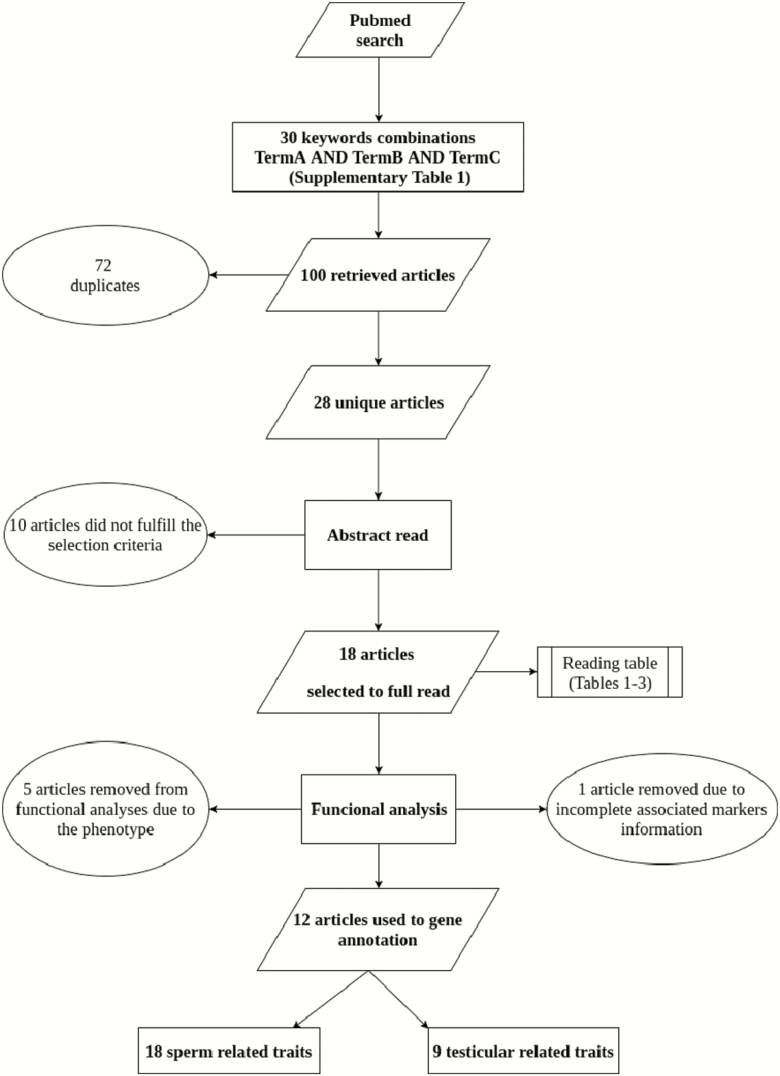
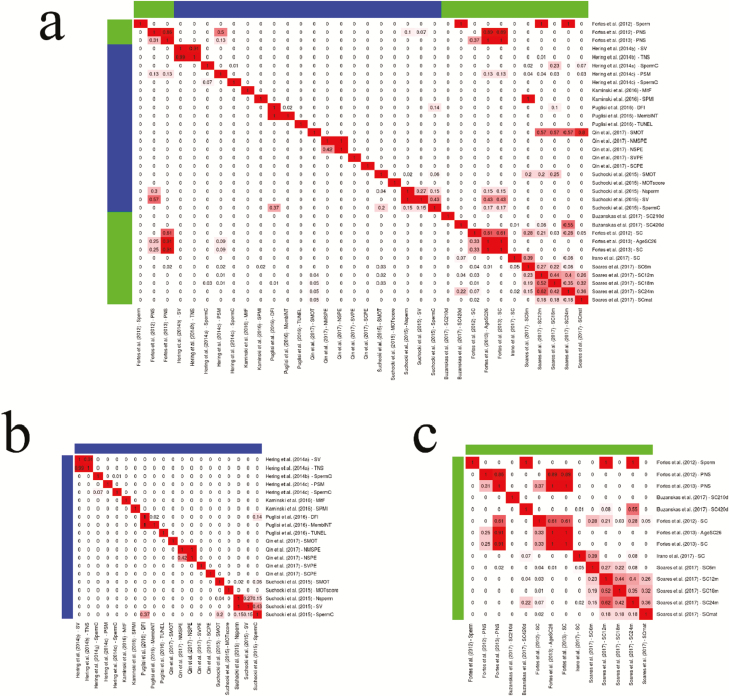
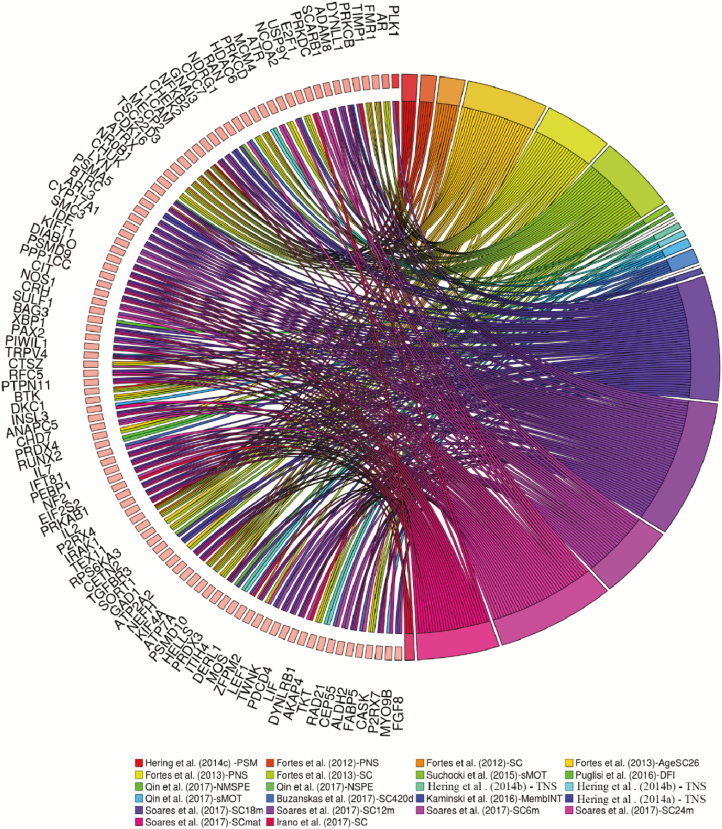
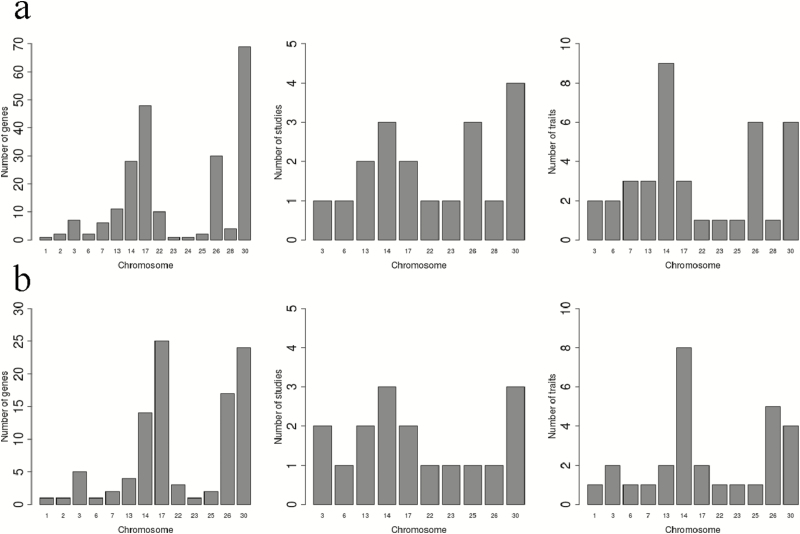
Reduced bull fertility imposes economic losses in bovine herds. Specifically, testicular and spermatic traits are important indicators of reproductive efficiency. Several genome-wide association studies (GWAS) have identified genomic regions associated with these fertility traits. The aims of this study were as follows: 1) to perform a systematic review of GWAS results for spermatic and testicular traits in cattle and 2) to identify key functional candidate genes for these traits. The identification of functional candidate genes was performed using a systems biology approach, where genes shared between traits and studies were evaluated by a guilt by association gene prioritization (GUILDify and ToppGene software) in order to identify the best functional candidates. These candidate genes were integrated and analyzed in order to identify overlapping patterns among traits and breeds. Results showed that GWAS for testicular-related traits have been developed for beef breeds only, whereas the majority of GWAS for spermatic-related traits were conducted using dairy breeds. When comparing traits measured within the same study, the highest number of genes shared between different traits was observed, indicating a high impact of the population genetic structure and environmental effects. Several chromosomal regions were enriched for functional candidate genes associated with fertility traits. Moreover, multiple functional candidate genes were enriched for markers in a species-specific basis, taurine (Bos taurus) or indicine (Bos indicus). For the different candidate regions identified in the GWAS in the literature, functional candidate genes were detected as follows: B. Taurus chromosome X (BTX) (TEX11, IRAK, CDK16, ATP7A, ATRX, HDAC6, FMR1, L1CAM, MECP2, etc.), BTA17 (TRPV4 and DYNLL1), and BTA14 (MOS, FABP5, ZFPM2). These genes are responsible for regulating important metabolic pathways or biological processes associated with fertility, such as progression of spermatogenesis, control of ciliary activity, development of Sertoli cells, DNA integrity in spermatozoa, and homeostasis of testicular cells. This study represents the first systematic review on male fertility traits in cattle using a system biology approach to identify key candidate genes for these traits.
Figures
Similar articles
-
Underlying genetic architecture of resistance to mastitis in dairy cattle: A systematic review and gene prioritization analysis of genome-wide association studies.J Dairy Sci. 2023 Jan;106(1):323-351. doi: 10.3168/jds.2022-21923. Epub 2022 Nov 1. J Dairy Sci. 2023. PMID: 36333139
-
Genome-wide association studies (GWAS) and post-GWAS analyses for technological traits in Assaf and Churra dairy breeds.J Dairy Sci. 2021 Nov;104(11):11850-11866. doi: 10.3168/jds.2021-20510. Epub 2021 Aug 26. J Dairy Sci. 2021. PMID: 34454756
-
Genome-wide association study identifies genomic regions associated with key reproductive traits in Korean Hanwoo cows.BMC Genomics. 2024 May 23;25(1):496. doi: 10.1186/s12864-024-10401-3. BMC Genomics. 2024. PMID: 38778305 Free PMC article.
-
Genomic variants identified from whole-genome resequencing of indicine cattle breeds from Pakistan.PLoS One. 2019 Apr 11;14(4):e0215065. doi: 10.1371/journal.pone.0215065. eCollection 2019. PLoS One. 2019. PMID: 30973947 Free PMC article.
-
Symposium review: Genetics, genome-wide association study, and genetic improvement of dairy fertility traits.J Dairy Sci. 2019 Apr;102(4):3735-3743. doi: 10.3168/jds.2018-15269. Epub 2018 Sep 27. J Dairy Sci. 2019. PMID: 30268602 Review.
Cited by
-
Simultaneous Effects of Single-Nucleotide Polymorphisms on the Estimated Breeding Value of Milk, Fat, and Protein Yield of Holstein Friesian Cows in Hungary.Animals (Basel). 2024 Dec 5;14(23):3518. doi: 10.3390/ani14233518. Animals (Basel). 2024. PMID: 39682483 Free PMC article.
-
Exploration and Enrichment Analysis of the QTLome for Important Traits in Livestock Species.Genes (Basel). 2024 Nov 26;15(12):1513. doi: 10.3390/genes15121513. Genes (Basel). 2024. PMID: 39766781 Free PMC article.
-
Identifying functionally relevant candidate genes for inflexible ethanol intake in mice and humans using a guilt-by-association approach.Brain Behav. 2020 Dec;10(12):e01879. doi: 10.1002/brb3.1879. Epub 2020 Oct 23. Brain Behav. 2020. PMID: 33094916 Free PMC article.
-
Incorporation of Testicular Ultrasonography and Hair Steroid Concentrations in Bull Breeding Soundness Evaluation.Vet Sci. 2023 May 25;10(6):373. doi: 10.3390/vetsci10060373. Vet Sci. 2023. PMID: 37368759 Free PMC article.
-
Integrative pigGTEx resource with GWAS reveals genetic mechanism underlying semen quality in boars.J Anim Sci Biotechnol. 2025 Jul 21;16(1):105. doi: 10.1186/s40104-025-01237-2. J Anim Sci Biotechnol. 2025. PMID: 40685336 Free PMC article.
References
-
- Adham I. M., E. Burkhardt M. Benahmed, and Engel W.. 1993. Cloning of a cdna for a novel insulin-like peptide of the testicular leydig cells. J. Biol. Chem. 268:26668–26672. - PubMed
Publication types
MeSH terms
LinkOut - more resources
Full Text Sources
Research Materials
Miscellaneous
