. 2018 Nov 16;46(20):10697-10708.
doi: 10.1093/nar/gky835.

Regulation of muscle atrophy-related genes by the opposing transcriptional activities of ZEB1/CtBP and FOXO3

Affiliations

Regulation of muscle atrophy-related genes by the opposing transcriptional activities of ZEB1/CtBP and FOXO3

Chiara Ninfali et al. Nucleic Acids Res. .

Abstract

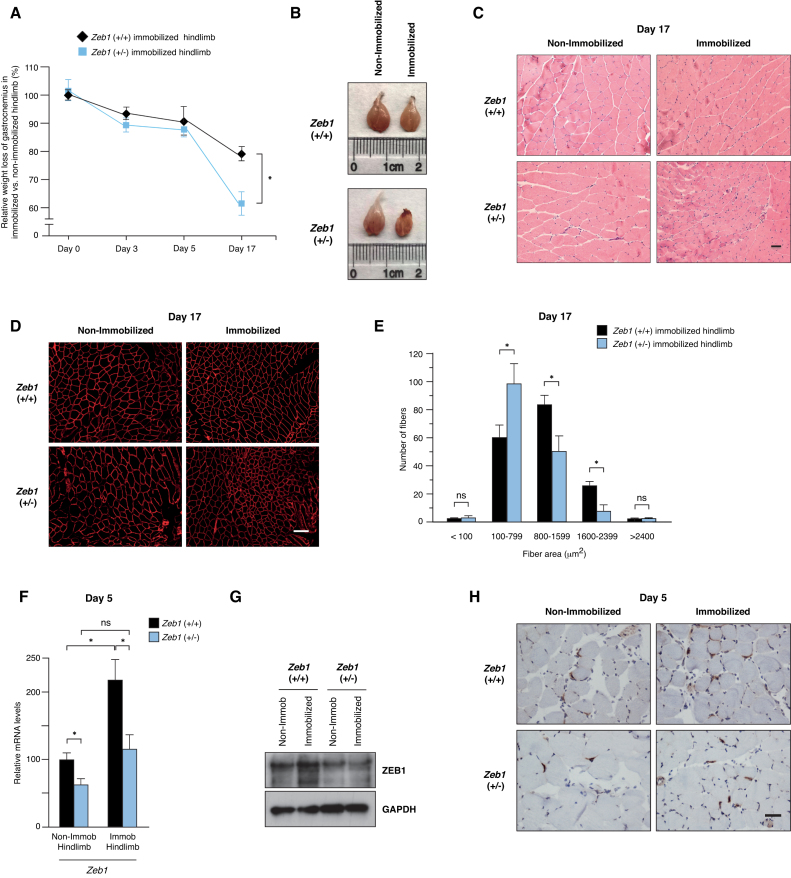
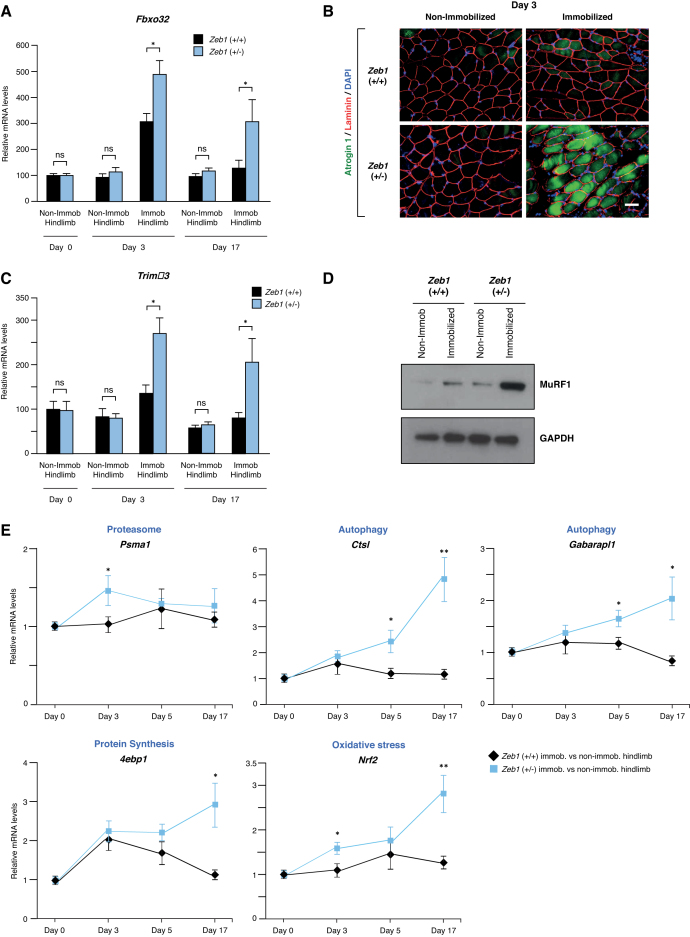
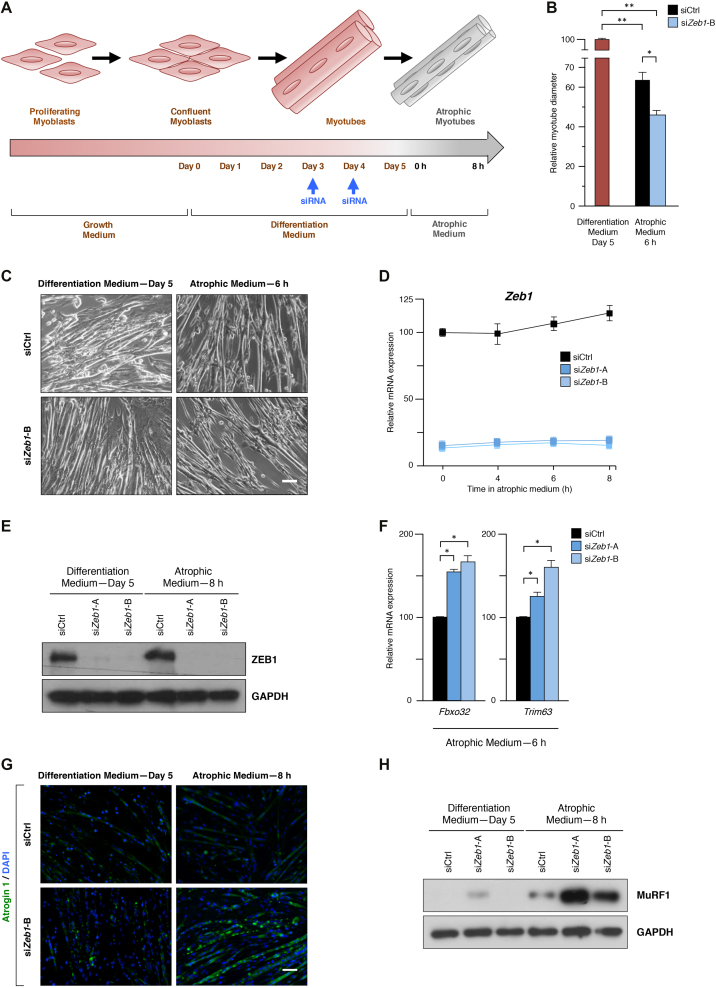
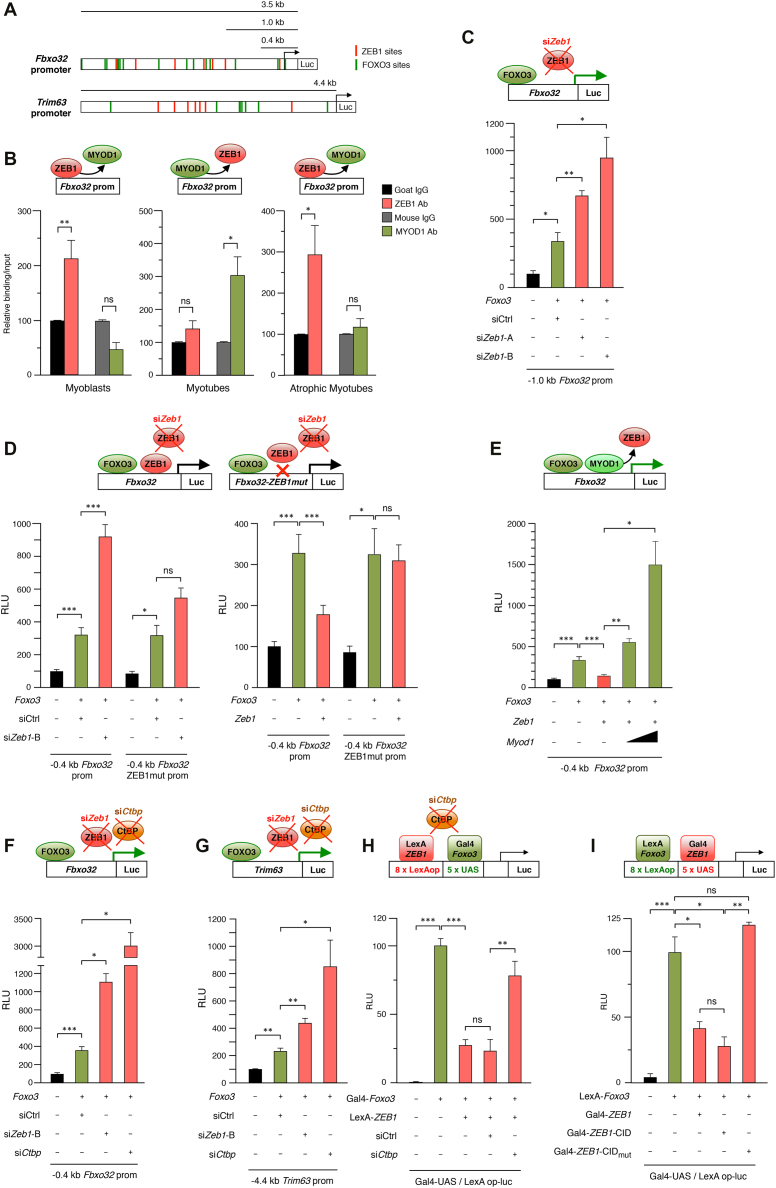
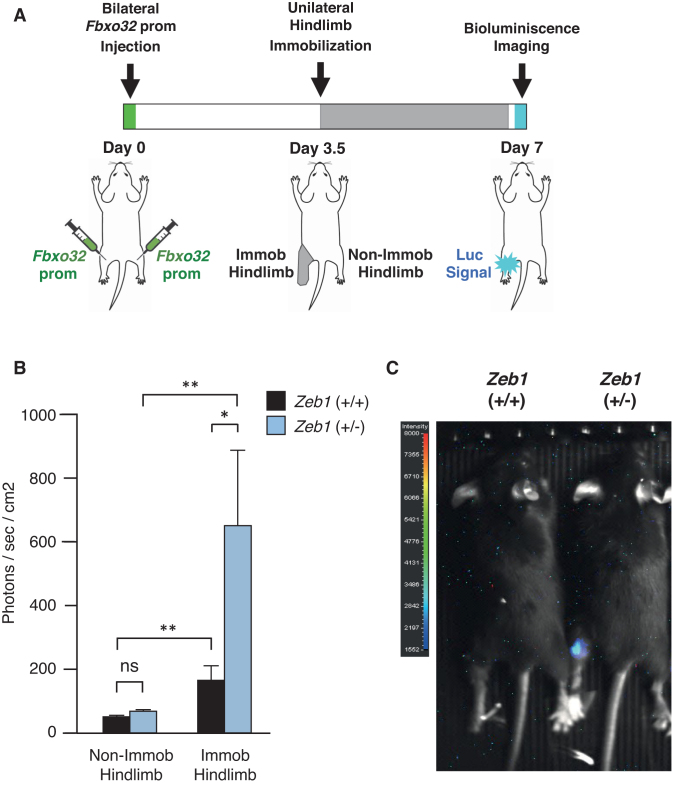
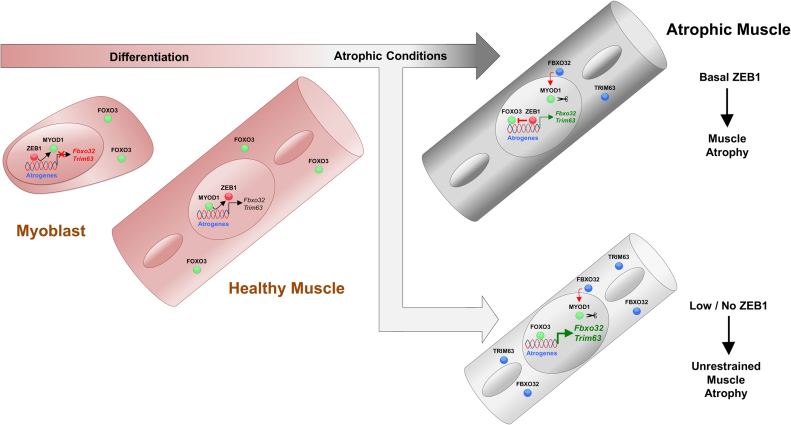
Multiple physiopathological and clinical conditions trigger skeletal muscle atrophy through the induction of a group of proteins (atrogenes) that includes components of the ubiquitin-proteasome and autophagy-lysosomal systems. Atrogenes are induced by FOXO transcription factors, but their regulation is still not fully understood. Here, we showed that the transcription factor ZEB1, best known for promoting tumor progression, inhibits muscle atrophy and atrogene expression by antagonizing FOXO3-mediated induction of atrogenes. Compared to wild-type counterparts, hindlimb immobilization in Zeb1-deficient mice resulted in enhanced muscle atrophy and higher expression of a number of atrogenes, including Atrogin-1/Fbxo32, MuRF1/Trim63, Ctsl, 4ebp1, Gabarapl1, Psma1 and Nrf2. Likewise, in the C2C12 myogenic cell model, ZEB1 knockdown augmented both myotube diameter reduction and atrogene upregulation in response to nutrient deprivation. Mechanistically, ZEB1 directly represses in vitro and in vivo Fbxo32 and Trim63 promoter transcription in a stage-dependent manner and in a reverse pattern with MYOD1. ZEB1 bound to the Fbxo32 promoter in undifferentiated myoblasts and atrophic myotubes, but not in non-atrophic myotubes, where it is displaced by MYOD1. ZEB1 repressed both promoters through CtBP-mediated inhibition of FOXO3 transcriptional activity. These results set ZEB1 as a new target in therapeutic approaches to clinical conditions causing muscle mass loss.


Figures

Figure 1.
Figure 1.
ZEB1 protects skeletal muscle from sparing upon immobilization. (A) Two-to-three-month old wild-type and Zeb1 (+/-) mice were subjected to unilateral hindlimb immobilization for different periods as described in Supplementary Data. At each time point, mice were euthanized and the weight of their immobilized gastrocnemius muscles was assessed with respect to that in the contralateral non-immobilized hindlimb. The weight of the gastrocnemius in the immobilized hindlimb vis-à-vis that in the non-immobilized at the start of the protocol (day 0) was set arbitrarily to 100. At least five mice of each genotype were examined. (B) As in (A), representative images of non-immobilized and immobilized gastrocnemius muscles from wild-type and Zeb1 (+/-) mice at day 17 of the immobilization protocol. (C) Wild-type and Zeb1 (+/-) mice were subjected to unilateral hindlimb immobilization during 17 days as in (A), euthanized and their gastrocnemius muscles stained for hematoxylin/eosin. Scale bar: 50 μm. (D) As in (C), but sections were stained with an antibody against laminin (clone 48H-2). Scale bar: 100 μm. (E) Myofiber cross-sectional analysis in the immobilized gastrocnemius of wild-type and Zeb1 (+/-) mice at day 17 of the immobilization protocol. Myofiber area was assessed as described in Supplementary Data. A total of 160 myofibers were measured from at least eight mice, half from each genotype. (F) Zeb1 expression slightly increases upon immobilization. Wild-type and Zeb1 (+/-) mice were subjected to unilateral hindlimb immobilization during 5 days. At that time, mice were euthanized and Zeb1 messenger RNA (mRNA) levels were assessed in the immobilized and non-immobilized gastrocnemius by qRT-PCR using Gapdh as reference gene. The results are the mean with standard error of at least five mice for each genotype and condition. (G) As in (F), but ZEB1 expression was assessed at the protein level by Western blot. Gastrocnemius muscle lysates were blotted for ZEB1 (clone HPA027524) along with GAPDH (clone 14C10) as loading control. See Supplementary Figure S1E for full unedited blots. The blots shown are a representative of three independent experiments. (H) As in (F), but the ZEB1 expression was assessed by immunohistochemistry (clone H102) at day 5. Captures are representative of at least five mice for each genotype and condition. Scale bar: 40 μm.
Figure 2.
Figure 2.
Zeb1 inhibits the in vivo induction of atrogenes upon immobilization. (A) Wild-type and Zeb1 (+/-) mice were subjected to unilateral hindlimb immobilization during 3 and 17 days and their immobilized and non-immobilized gastrocnemius were then examined for Fbxo32 mRNA expression by qRT-PCR with respect to Gapdh. Fbxo32 mRNA levels in the non-immobilized hindlimb at day 0 were arbitrarily set to 100 with all other data genotypes and conditions referred to them. Data represent the mean of at least five mice for each genotype and condition. (B) The gastrocnemius of mice from both genotypes after 3 days of the unilateral hindlimb immobilization protocol were stained with antibodies against Atrogin-1 (clone AP2041) and laminin (clone 48H-2), and counterstained for 4′,6-diamidino-2-phenylindole (DAPI) for nuclear staining. Captures for single immunostaining are shown in Supplementary Figure S2A. Scale bar: 50 μm. (C) As in (A), but for Trim63. (D) As in (B), but the lysates from gastrocnemius of mice from both genotypes after 3 days of the unilateral hindlimb immobilization protocol were blotted for MuRF1 (clone C11) along with GAPDH (clone 14C10) as loading control. See Supplementary Figure S2B for full unedited blots. The blots shown are representative of three independent experiments. (E) Wild-type and Zeb1 (+/-) mice were subjected to the unilateral hindlimb immobilization protocol for 3, 5 and 17 days. At the end of each time point, they were euthanized and mRNA levels for Psma1, Ctsl, Gabarapl1, 4ebp1 and Nrf2 were assessed by qRT-PCR. For each gene, mRNA levels shown correspond to that in the gastrocnemius of the immobilized with respect to the contralateral non-immobilized hindlimb. The gene expression in the non-immobilized gastrocnemius at days 3, 5 and 17 was similar than that at day 0 shown. At least five mice from each genotype and day were analyzed.
Figure 3.
Figure 3.
ZEB1 inhibits atrogene expression and size reduction in starved C2C12 myotubes. (A) Scheme of the starvation-induced atrophy protocol in C2C12 myotubes. C2C12 myotubes were transfected with siCtrl or any of two siRNA sequences previously validated to specifically knock down Zeb1 (see Supplementary Figure S3B and C) and their differentiation medium was replaced by atrophic medium for up to 8 h. (B) The diameter of C2C12 myotubes subjected to the protocol in (A) was assessed as described in Supplementary Data. Myotube diameter in differentiation medium at day 5 was arbitrarily set at 100. Data represent the average of at least three experiments. (C) As in (B), representative captures of C2C12 myotubes transfected with siCtrl or siZeb1-B following incubation in differentiation medium or atrophy medium. Scale bar: 50 μm. (D) Zeb1 mRNA levels in C2C12 myotubes interfered with siCtrl, siZeb1-A or siZeb1-B and cultured in atrophic medium for the indicated periods were assessed by qRT-PCR with respect to Gapdh. Zeb1 expression in cells interfered with siCtrl at 0 h of atrophic medium was arbitrarily set to 100. Data are representative of four independent experiments. (E) As in (C), lysates from C2C12 non-atrophic and atrophic myotubes were assessed by Western blot for ZEB1 expression (clone HPA027524) along with GAPDH (clone 14C10) as loading control. See Supplementary Figure S3C full unedited blots. The blots shown are a representative of four independent experiments. (F) As in (A), C2C12 myotubes were interfered with siCtrl, siZeb1-A or siZeb1-B and transferred to atrophy medium. Expression of Fbxo32 and Trim63 was assessed by qRT-PCR using Gapdh as reference gene. Data represent the average of at least three independent experiments. (G) As in (C), but C2C12 non-atrophic and atrophic myotubes were stained for Atrogin-1 (clone AP2041) along with DAPI for nuclear staining. See Supplementary Figure S3D for individual staining. Pictures shown are representative of three independent experiments. Scale bar: 50 μm. (H) As in (C), lysates from C2C12 non-atrophic and atrophic myotubes were assessed for MuRF1 expression (clone C11) along with GAPDH (clone 14C10) as loading control. See Supplementary Figure S3E for knockdown of ZEB1 (clone HPA027524) and full unedited blots of the three antibodies. The blots shown are representative of four independent experiments.
Figure 4.
Figure 4.
Stage-dependent inhibition of the Fbxo32 and Trim63 promoters by ZEB1 is mediated by CtBP-dependent repression of FOXO3 transcriptional activity. (A) Schematic representation of the consensus sites for ZEB1 (red boxes) and FOXO3 (green boxes) in the first 3.5 kb and 4.4 kb of the mouse Fbxo32 and Trim63 promoters, respectively. Consensus binding sequences for ZEB1 in the Fbxo32 promoter were identified at –2899 bp, −2584 bp, −1894 bp, −1395 bp, −1254 bp, −1011 bp, and −85 bp. Consensus binding sites for ZEB1 in the Trim63 promoter were identified at −4488 bp, −4444 bp, −3078 bp, −2792 bp, −2566 bp, −2416 bp, −2358 bp, −2254 bp, and –777 bp. Consensus binding sites for FOXO3 in Fbxo32 and Trim63 promoters were previously identified in reference (14) or assessed as described in Supplementary Materials and Methods. (B) ZEB1 binds to the mouse Fbxo32 promoter in myoblasts and atrophic myotubes but not in myotubes. DNA from C2C12 myoblasts, myotubes, or atrophic myotubes was immunoprecipitated with antibodies against ZEB1 (clone E-20X), MYOD1 (clone G-1) or their matched IgG controls (goat and mouse IgG, respectively). Immunoprecipitated DNA was then amplified by qRT-PCR in a region of the Fbxo32 promoter containing a ZEB1 consensus binding site at –85 bp. The condition immunoprecipitated with the IgG control was set to 100. Data represent the average of at least three experiments. (C) Transcription of the Fbxo32 promoter is under negative regulation by endogenous ZEB1. 0.48 μg of a luciferase reporter containing a 1.0 kb fragment of the mouse Fbxo32 promoter (14) was co-transfected in C2C12 cells along with 0.82 μg of an expression vector for FOXO3 (or the corresponding molar amount of the empty expression vector) to induce Fbxo32 transcription. Throughout this Figure, the effect of overexpressing the indicated genes (Foxo3 in this panel) is shown with respect to their corresponding empty vectors. Where indicated, cells were also transfected with 50 nM of either siCtrl, siZeb1-A or siZeb1-B. Transfections and assessment of Relative luciferase units (RLU) were performed as described in Supplementary Information. The first condition was arbitrarily set to 100. Data represent the average of three independent experiments. (D) Left panel: As in (C) but cells were instead transfected with 0.43 μg of either a luciferase reporter containing a 0.4 kb fragment of the mouse Fbxo32 promoter (14) or version of it where only the ZEB1 binding site at -85 bp has been mutated to a sequence known to not bind ZEB1 (see Supplementary Information for details). Right panel: As in the left panel, but 1.88 μg of an expression vector for Zeb1 (or the corresponding molar amount of the empty expression vector) were also transfected. The first condition was arbitrarily set to 100. Data represent the average of three independent experiments. (E) Overexpression of MYOD1 displaces ZEB1 from its binding to the 0.4 kb Fbxo32 luciferase reporter. As in the right panel of (D) but 0.04 μg or 0.13 μg of an expression vector for Myod1 (or the corresponding molar amount of the empty expression vector) were transfected along with Zeb1. The first condition was arbitrarily set to 100. Data shown are the mean of three independent experiments. (F) Transcription of the Fbxo32 promoter is under negative regulation by endogenous CtBP. As in (D) but cells were transfected with a siRNA against Ctbp. The first condition was arbitrarily set to 100. Data represent the average of three independent experiments. (G) As in (F) but cells were instead transfected with 0.77 μg of a luciferase reporter containing a 4.4 kb fragment of the mouse Trim63 promoter. The first condition was arbitrarily set to 100. Data are the average of at least three independent experiments. (H) FOXO3 transcriptional activity is repressed by ZEB1 and CtBP. 293T cells were transfected with 0.50 μg of a reporter containing LexA operon and Gal-UAS sites (L8G5-luc) along with 1.04 μg Gal4-Foxo3 and/or 1.15 μg LexA-ZEB1 (or their corresponding empty vectors). Where indicated, cells were transfected with 10–20 nM of either siCtrl or siCtbp. The condition overexpressing only Gal4-Foxo3 was arbitrarily set to 100. Data represent the average of five independent experiments. (I) ZEB1 represses FOXO3 transcriptional activity through a CtBP-dependent mechanism. As in (H) but the Gal4 and LexA fusion proteins were swapped: ZEB1, ZEB1-CID and ZEB1-CIDmut were fused to Gal4 whereas Foxo3 was fused to LexA. Cells were transfected with 0.50 μg of L8G5-luc, 0.70 μg of LexA-Foxo3, 1.50 μg Gal4-ZEB1, 0.79 μg of Gal4-ZEB1-CID and/or ZEB1-CIDmut. The condition overexpressing only LexA-Foxo3 was arbitrarily set to 100. Data are the average of three independent experiments.
Figure 5.
Figure 5.
In vivo repression of the Fbxo32 promoter by endogenous ZEB1. (A) Graphic representation of the protocol for the in vivo assessment of ZEB1 regulation of the Fbxo32 promoter. Both hindlimbs of wild-type and Zeb1 (+/-) mice were injected with a 3.5 kb fragment of the Fbxo32 promoter fused to luciferase (14). After 3.5 days, mice were subjected to unilateral (left) hindlimb immobilization for 3.5 additional days. At day 7, Fbxo32 promoter activity was assessed in vivo by whole-body bioluminescence imaging. See Supplementary Data for details. (B) ZEB1 inhibits the Fbxo32 promoter in vivo. In both genotypes, the bioluminescence signal emitted by the Fbxo32 promoter is higher in the immobilized hindlimb than in the non-immobilized hindlimb. However, immobilization induced greater bioluminescence signal in Zeb1 (+/−) mice than in wild-type mice. Data represent the average of seven mice of each genotype. (C) Bioluminescence signal rendered by a representative mouse for each genotype at day 7.
Figure 6.
Figure 6.
Summary model: ZEB1 inhibits muscle atrophy and atrogene expression in a stage-dependent manner through CtBP-mediated repression of FOXO3 transcriptional activity. See main text for details.

References

    1. Cohen S., Nathan J.A., Goldberg A.L.. Muscle wasting in disease: molecular mechanisms and promising therapies. Nat. Rev. Drug Discov. 2015; 14:58–74. - PubMed
    1. Bonaldo P., Sandri M.. Cellular and molecular mechanisms of muscle atrophy. Dis. Model Mech. 2013; 6:25–39. - PMC - PubMed
    1. Schiaffino S., Dyar K.A., Ciciliot S., Blaauw B., Sandri M.. Mechanisms regulating skeletal muscle growth and atrophy. FEBS J. 2013; 280:4294–4314. - PubMed
    1. Bodine S.C., Latres E., Baumhueter S., Lai V.K.M., Nunez L., Clarke B.A., Poueymirou W.T., Panaro F.J., Na E., Dharmarajan K. et al. . Identification of ubiquitin ligases required for skeletal muscle atrophy. Science. 2001; 294:1704–1708. - PubMed
    1. Gomes M.D., Lecker S.H., Jagoe R.T., Navon A., Goldberg A.L.. Atrogin-1, a muscle-specific F-box protein highly expressed during muscle atrophy. Proc. Natl. Acad. Sci. U.S.A. 2001; 98:14440–14445. - PMC - PubMed

Publication types

MeSH terms