

Genome-wide mapping reveals conserved and diverged R-loop activities in the unusual genetic landscape of the African trypanosome genome
- PMID: 30304482
- PMCID: PMC6294496
- DOI: 10.1093/nar/gky928
Genome-wide mapping reveals conserved and diverged R-loop activities in the unusual genetic landscape of the African trypanosome genome
Abstract
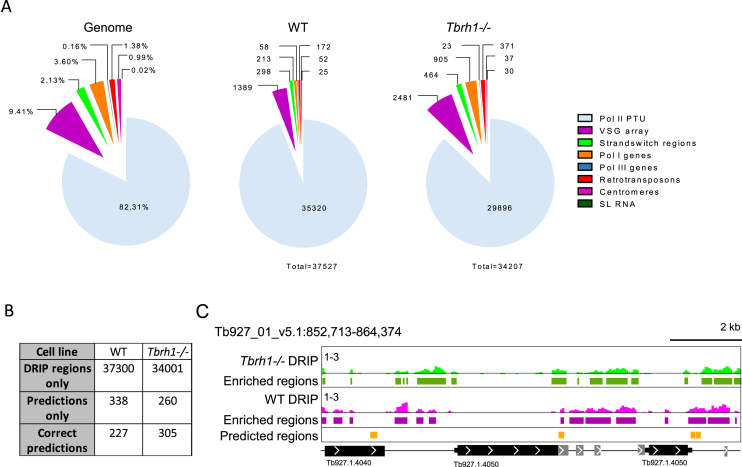
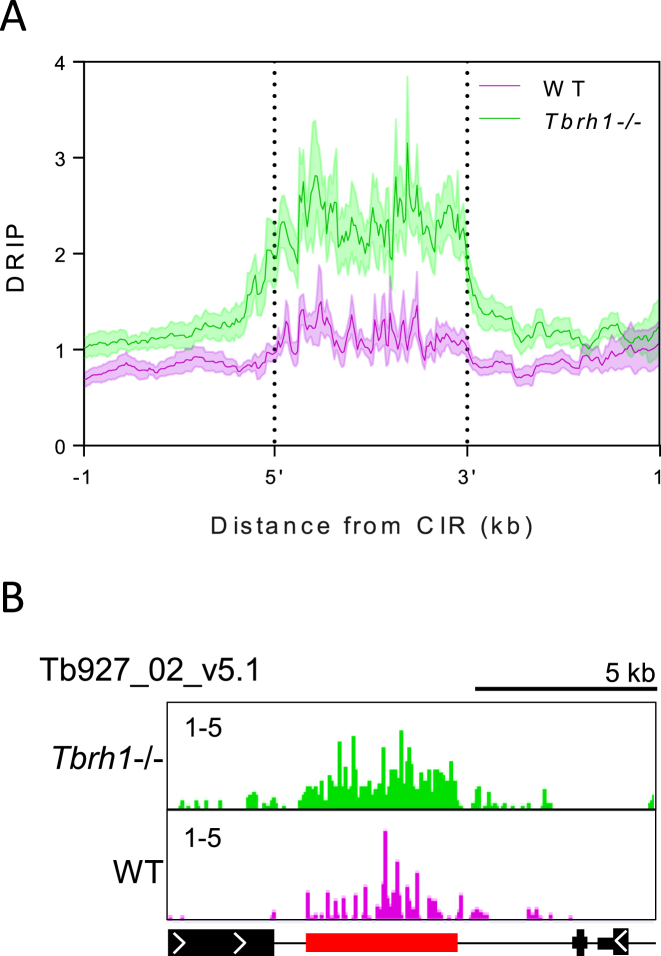
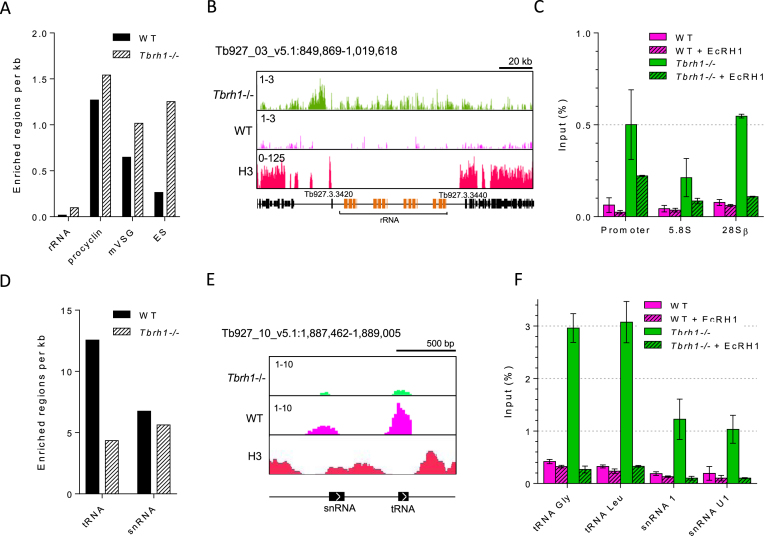
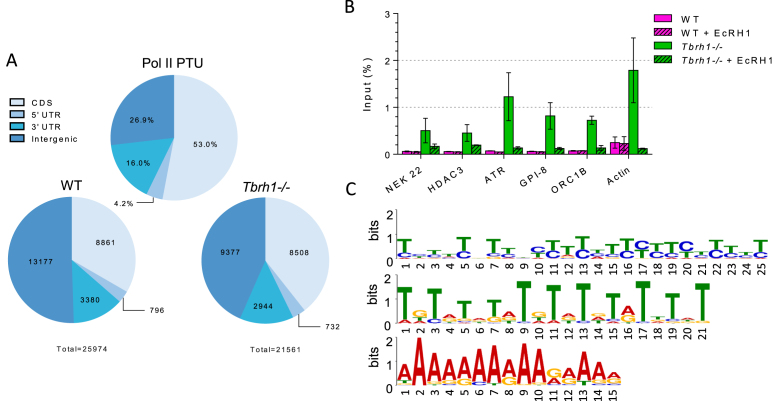
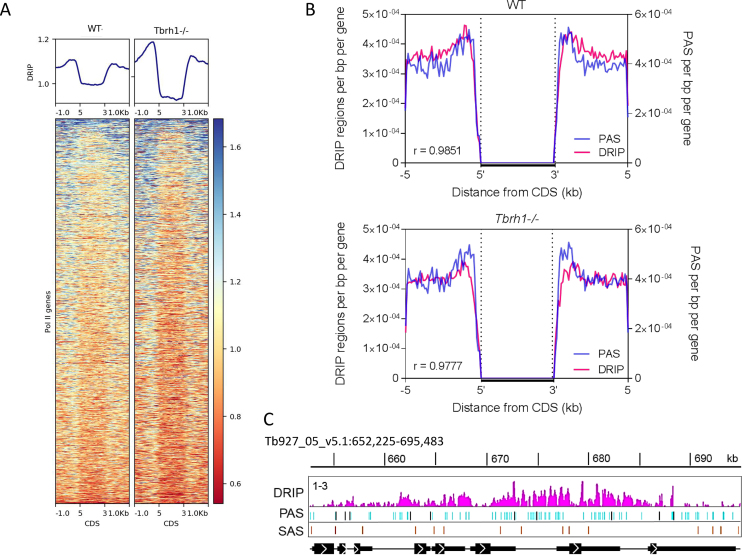
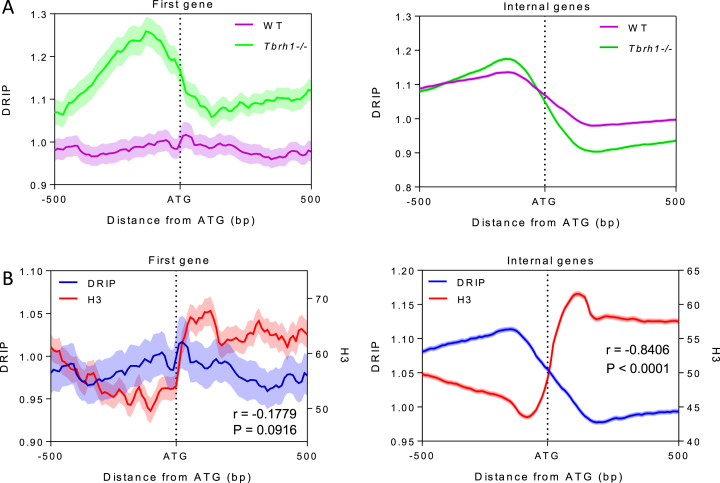
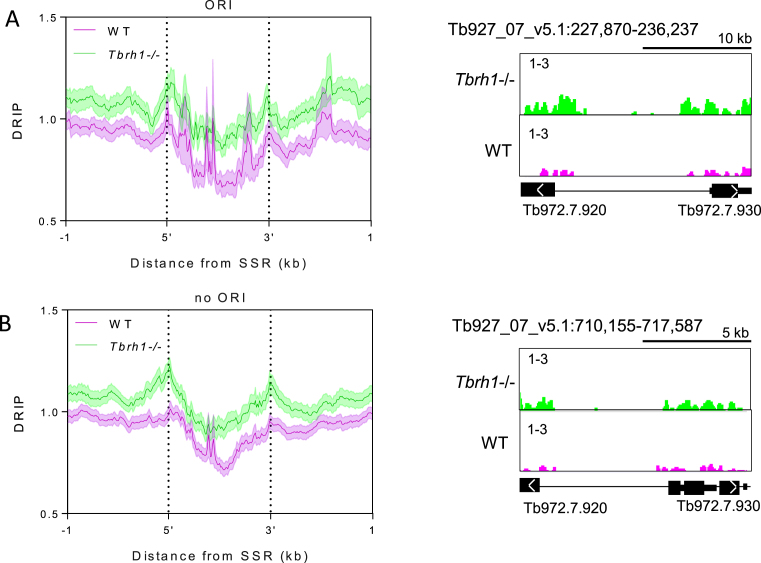
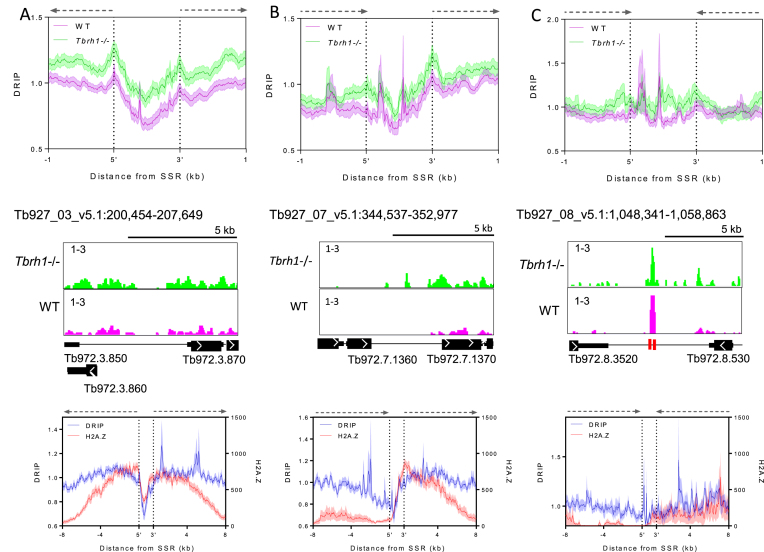
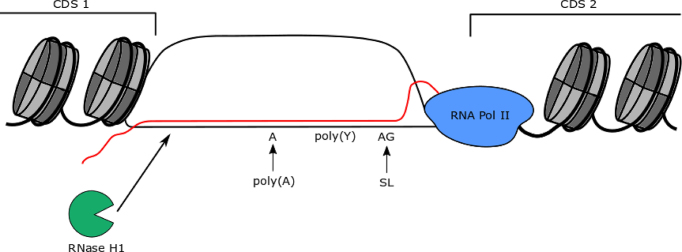
R-loops are stable RNA-DNA hybrids that have been implicated in transcription initiation and termination, as well as in telomere maintenance, chromatin formation, and genome replication and instability. RNA Polymerase (Pol) II transcription in the protozoan parasite Trypanosoma brucei is highly unusual: virtually all genes are co-transcribed from multigene transcription units, with mRNAs generated by linked trans-splicing and polyadenylation, and transcription initiation sites display no conserved promoter motifs. Here, we describe the genome-wide distribution of R-loops in wild type mammal-infective T. brucei and in mutants lacking RNase H1, revealing both conserved and diverged functions. Conserved localization was found at centromeres, rRNA genes and retrotransposon-associated genes. RNA Pol II transcription initiation sites also displayed R-loops, suggesting a broadly conserved role despite the lack of promoter conservation or transcription initiation regulation. However, the most abundant sites of R-loop enrichment were within the regions between coding sequences of the multigene transcription units, where the hybrids coincide with sites of polyadenylation and nucleosome-depletion. Thus, instead of functioning in transcription termination the most widespread localization of R-loops in T. brucei suggests a novel correlation with pre-mRNA processing. Finally, we find little evidence for correlation between R-loop localization and mapped sites of DNA replication initiation.
Figures
Similar articles
-
Well-positioned nucleosomes punctuate polycistronic pol II transcription units and flank silent VSG gene arrays in Trypanosoma brucei.Epigenetics Chromatin. 2017 Mar 20;10:14. doi: 10.1186/s13072-017-0121-9. eCollection 2017. Epigenetics Chromatin. 2017. PMID: 28344657 Free PMC article.
-
Active VSG expression sites in Trypanosoma brucei are depleted of nucleosomes.Eukaryot Cell. 2010 Jan;9(1):136-47. doi: 10.1128/EC.00281-09. Epub 2009 Nov 13. Eukaryot Cell. 2010. PMID: 19915073 Free PMC article.
-
RNA polymerase I transcribes procyclin genes and variant surface glycoprotein gene expression sites in Trypanosoma brucei.Eukaryot Cell. 2003 Jun;2(3):542-51. doi: 10.1128/EC.2.3.542-551.2003. Eukaryot Cell. 2003. PMID: 12796299 Free PMC article.
-
Transcription of protein-coding genes in trypanosomes by RNA polymerase I.Annu Rev Microbiol. 1997;51:463-89. doi: 10.1146/annurev.micro.51.1.463. Annu Rev Microbiol. 1997. PMID: 9343357 Review.
-
Nuclear gene transcription and chromatin in Trypanosoma brucei.Int J Parasitol. 2001 Sep;31(11):1157-65. doi: 10.1016/s0020-7519(01)00264-8. Int J Parasitol. 2001. PMID: 11513885 Review.
Cited by
-
The RNA export factor TbMex67 connects transcription and RNA export in Trypanosoma brucei and sets boundaries for RNA polymerase I.Nucleic Acids Res. 2023 Jun 9;51(10):5177-5192. doi: 10.1093/nar/gkad251. Nucleic Acids Res. 2023. PMID: 37070196 Free PMC article.
-
Unscheduled epigenetic modifications cause genome instability and sterility through aberrant R-loops following starvation.Nucleic Acids Res. 2023 Jan 11;51(1):84-98. doi: 10.1093/nar/gkac1155. Nucleic Acids Res. 2023. PMID: 36504323 Free PMC article.
-
Bromodomain factor 5 is an essential regulator of transcription in Leishmania.Nat Commun. 2022 Jul 13;13(1):4071. doi: 10.1038/s41467-022-31742-1. Nat Commun. 2022. PMID: 35831302 Free PMC article.
-
RAD51-mediated R-loop formation acts to repair transcription-associated DNA breaks driving antigenic variation in Trypanosoma brucei.Proc Natl Acad Sci U S A. 2023 Nov 28;120(48):e2309306120. doi: 10.1073/pnas.2309306120. Epub 2023 Nov 21. Proc Natl Acad Sci U S A. 2023. PMID: 37988471 Free PMC article.
-
Immunoprecipitation of RNA-DNA hybrid interacting proteins in Trypanosoma brucei reveals conserved and novel activities, including in the control of surface antigen expression needed for immune evasion by antigenic variation.Nucleic Acids Res. 2023 Nov 10;51(20):11123-11141. doi: 10.1093/nar/gkad836. Nucleic Acids Res. 2023. PMID: 37843098 Free PMC article.
References
-
- Shaw N.N., Arya D.P.. Recognition of the unique structure of DNA:RNA hybrids. Biochimie. 2008; 90:1026–1039. - PubMed
-
- Roberts R.W., Crothers D.M.. Stability and properties of double and triple helices: dramatic effects of RNA or DNA backbone composition. Science. 1992; 258:1463–1466. - PubMed
-
- Huertas P., Aguilera A.. Cotranscriptionally formed DNA:RNA hybrids mediate transcription elongation impairment and transcription-associated recombination. Mol. Cell. 2003; 12:711–721. - PubMed
-
- Li X., Manley J.L.. Inactivation of the SR protein splicing factor ASF/SF2 results in genomic instability. Cell. 2005; 122:365–378. - PubMed
Publication types
MeSH terms
Substances
Grants and funding
LinkOut - more resources
Full Text Sources
