Review
. 2019 Feb 1;199(3):286-301.
doi: 10.1164/rccm.201807-1351SO.

Imaging Advances in Chronic Obstructive Pulmonary Disease. Insights from the Genetic Epidemiology of Chronic Obstructive Pulmonary Disease (COPDGene) Study

Affiliations
Review

Imaging Advances in Chronic Obstructive Pulmonary Disease. Insights from the Genetic Epidemiology of Chronic Obstructive Pulmonary Disease (COPDGene) Study

Surya P Bhatt et al. Am J Respir Crit Care Med. .

Abstract

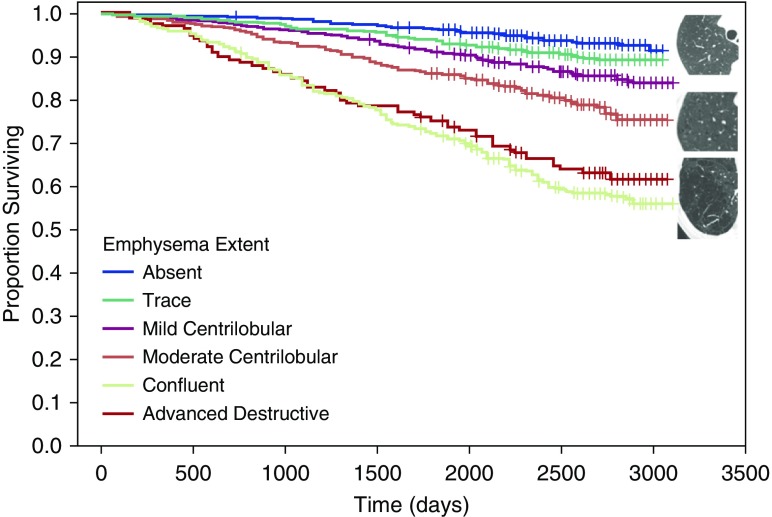
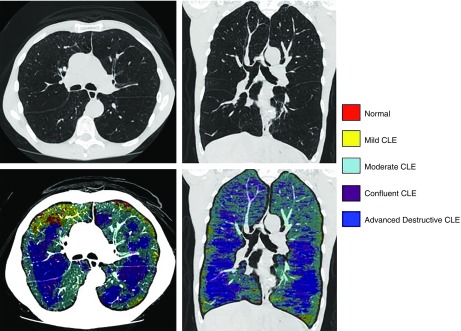
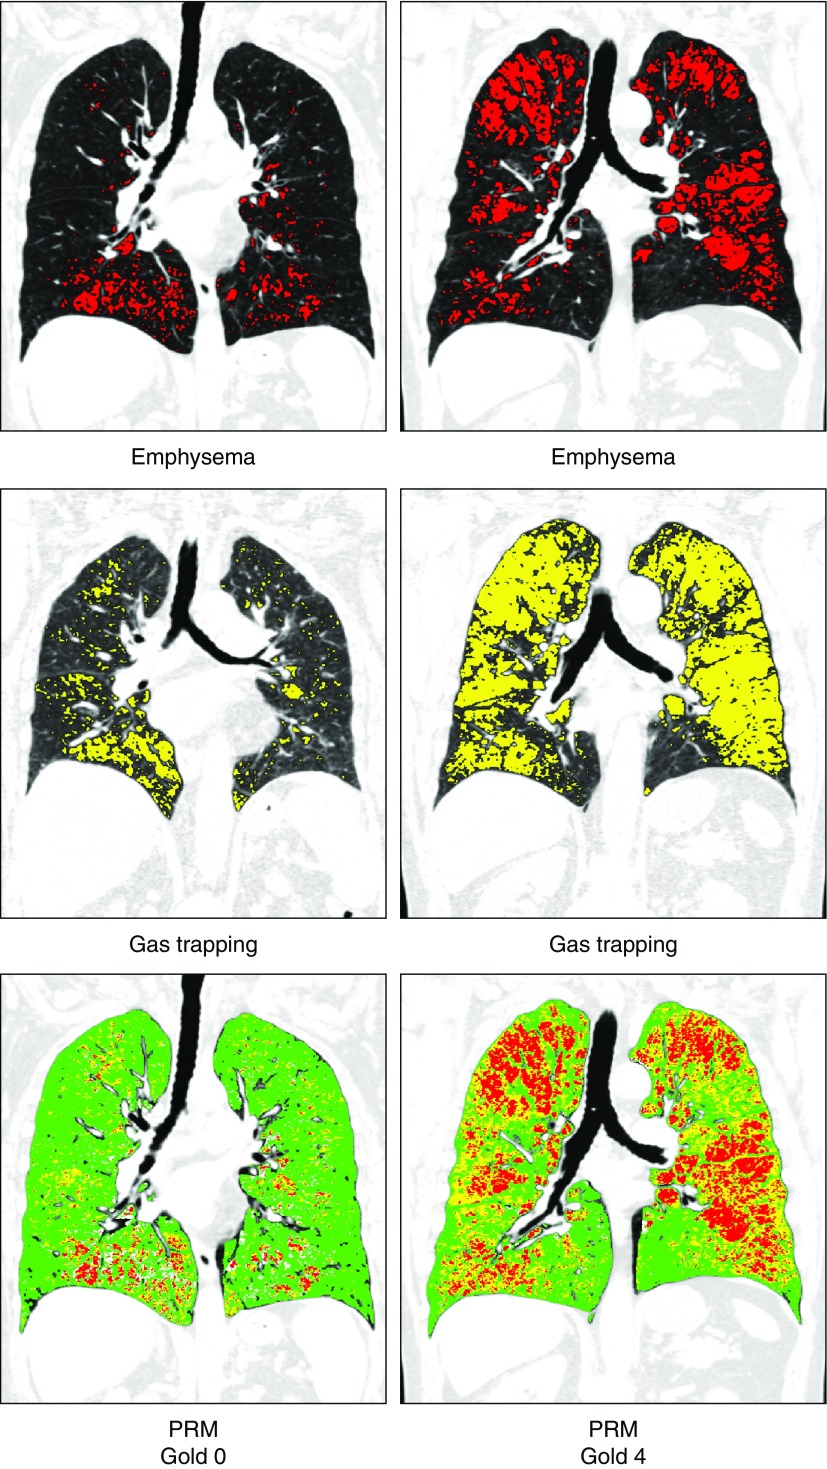
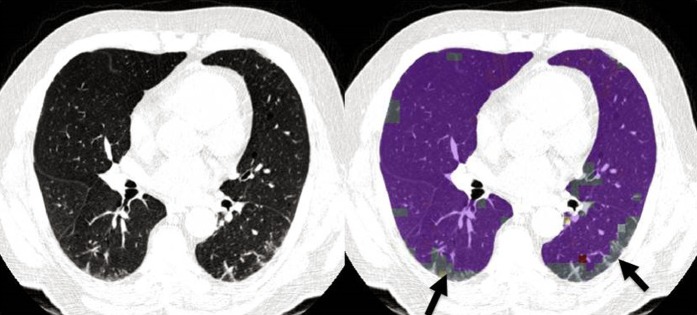
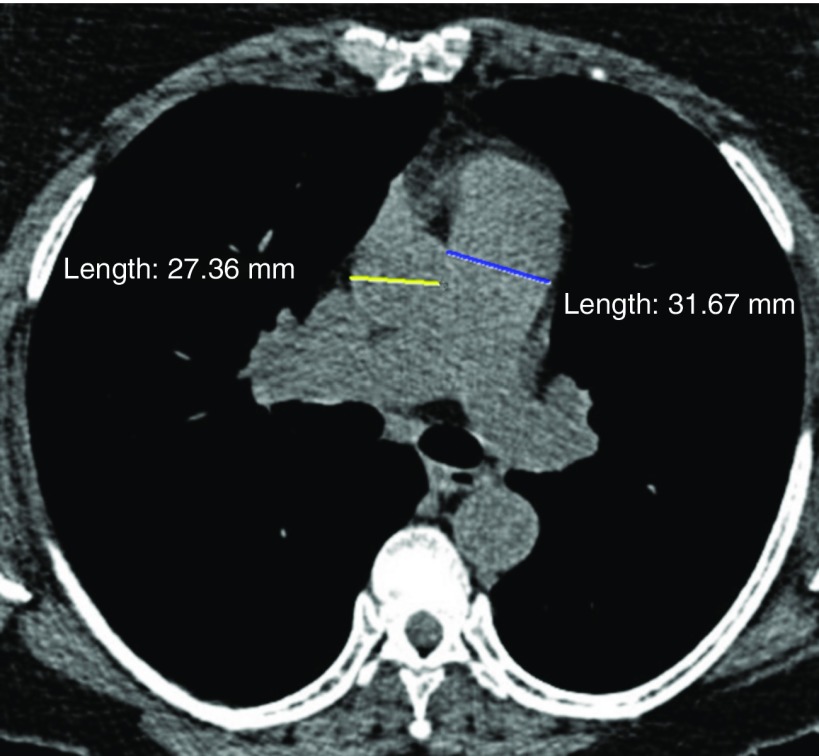
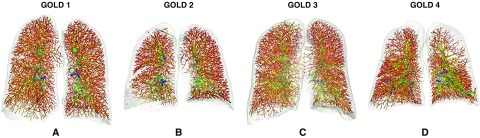
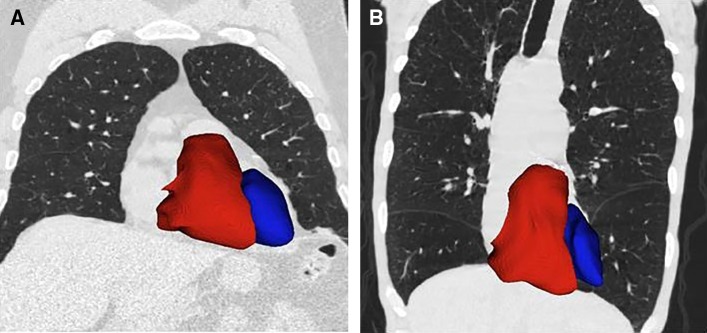
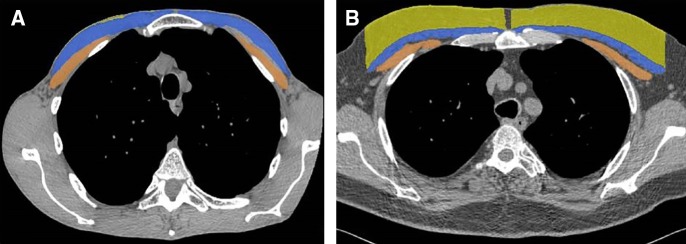
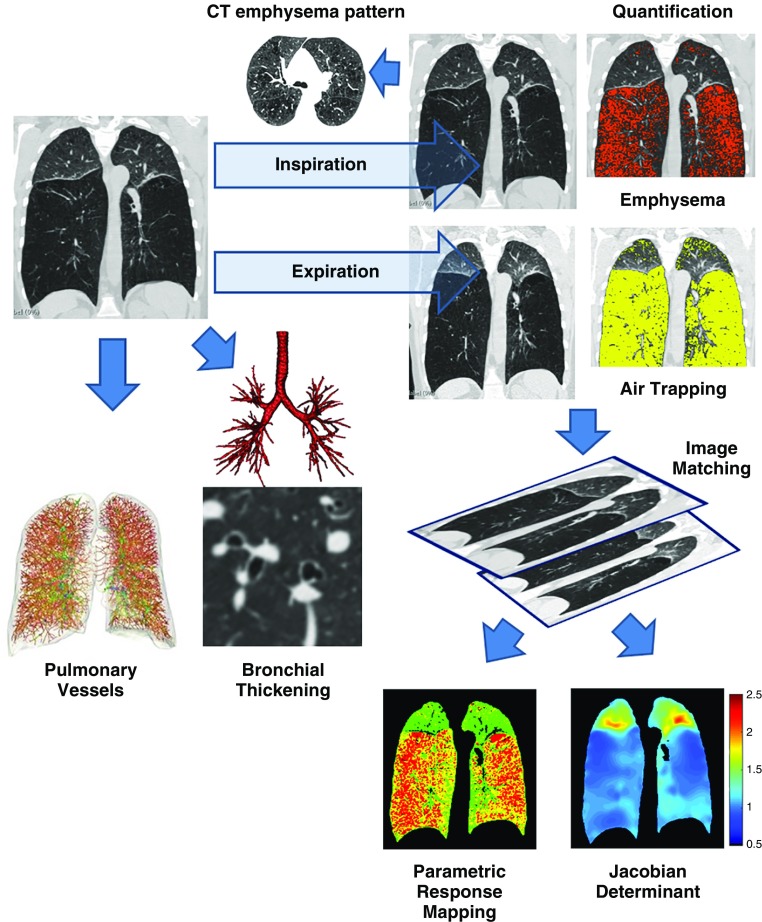
The Genetic Epidemiology of Chronic Obstructive Pulmonary Disease (COPDGene) study, which began in 2007, is an ongoing multicenter observational cohort study of more than 10,000 current and former smokers. The study is aimed at understanding the etiology, progression, and heterogeneity of chronic obstructive pulmonary disease (COPD). In addition to genetic analysis, the participants have been extensively characterized by clinical questionnaires, spirometry, volumetric inspiratory and expiratory computed tomography, and longitudinal follow-up, including follow-up computed tomography at 5 years after enrollment. The purpose of this state-of-the-art review is to summarize the major advances in our understanding of COPD resulting from the imaging findings in the COPDGene study. Imaging features that are associated with adverse clinical outcomes include early interstitial lung abnormalities, visual presence and pattern of emphysema, the ratio of pulmonary artery to ascending aortic diameter, quantitative evaluation of emphysema, airway wall thickness, and expiratory gas trapping. COPD is characterized by the early involvement of the small conducting airways, and the addition of expiratory scans has enabled measurement of small airway disease. Computational advances have enabled indirect measurement of nonemphysematous gas trapping. These metrics have provided insights into the pathogenesis and prognosis of COPD and have aided early identification of disease. Important quantifiable extrapulmonary findings include coronary artery calcification, cardiac morphology, intrathoracic and extrathoracic fat, and osteoporosis. Current active research includes identification of novel quantitative measures for emphysema and airway disease, evaluation of dose reduction techniques, and use of deep learning for phenotyping COPD.

Keywords: chronic obstructive pulmonary disease; computed tomography; lung imaging.


Figures

Figure 1.
Figure 1.
Visual analysis of parenchymal emphysema. Kaplan-Meier survival curves show distinct differences in survival for different emphysema patterns based on the Fleischner Society grading system: the best survival was with absent and trace emphysema (top); those with moderate centrilobular emphysema (center) had intermediate survival; and those with confluent or advanced destructive emphysema (bottom) showed poor survival. These differences persisted after adjustment for potential covariates. Adapted by permission from Reference .
Figure 2.
Figure 2.
Emphysema subtyping with local histogram. Emphysema subtyping using the local histogram approach for a 61-year-old man with advanced emphysema (low-attenuation area percentage, 38.2%), FEV1 percent predicted of 26.7%, and body mass index of 16.6 kg/m2. The top panels show computed tomographic scans for axial and coronal views, and the bottom panels show emphysema subtype labels overlaid on top of the computed tomographic images. Nonemphysematous parenchyma is shown in red, mild centrilobular emphysema (CLE) in yellow, moderate CLE in cyan, confluent CLE in purple, and advanced destructive emphysema in dark blue.
Figure 3.
Figure 3.
Parametric response mapping (PRM). Top panels show areas of emphysema (low-attenuation area percentages less than −950 Hounsfield units at end inspiration) in red; middle panels show areas of gas trapping (low-attenuation area percentages less than −856 Hounsfield units at end expiration) in yellow; and lower panels show PRM with PRM emphysema voxels in red, PRM functional small airway disease (fSAD) voxels in yellow, and PRM normal voxels in green. Representative images are shown for subjects with different stages of disease. The left column shows computed tomographic (CT) images of a 76-year-old woman without airflow obstruction (FEV1 % predicted, 100%; Global Initiative for Chronic Obstructive Lung Disease [GOLD] stage 0). Quantitative CT density analysis showed 6% emphysema and 19% gas trapping. PRM analysis showed that nonemphysematous gas trapping or fSAD was 13%. The right column shows CT images of a 73-year-old man with GOLD stage 4 (FEV1 % predicted, 23%), 19% emphysema, and 54% gas trapping. PRM analysis showed that fSAD was 38%.
Figure 4.
Figure 4.
Interstitial lung abnormalities. Images shown are from a 73-year-old male former smoker with FEV1 percent predicted of 72%, FVC percent predicted of 75%, and no evidence of emphysema by quantitative computed tomographic density analysis (low-attenuation area percentage, 3.2%). Left panel: Computed tomography through the midlungs shows predominantly posterior reticular abnormality. Right panel: Local histogram analysis shows reticular abnormalities outlined in gray (arrows). Purple represents normal lung. Volumetric analysis shows that 11.6% of the lung has reticular abnormalities by the local histogram approach.
Figure 5.
Figure 5.
Pulmonary artery/aorta ratio. A 62-year-old smoker with a high frequency of exacerbations (n = 6/yr). Computed tomography shows enlarged main pulmonary artery (3.2 cm) with ascending aorta diameter of 2.7 cm (pulmonary artery/aorta ratio, 1.2).
Figure 6.
Figure 6.
Pulmonary vascular remodeling. Vascular tree rendering showing vascular pruning across Global Initiative for Chronic Obstructive Lung Disease (GOLD) stages. Panels show anterior views of the vascular tree color coded by vessel diameter from small (red to orange) to medium (yellow to green) to large (green to blue) vessels. (A) A 58-year-old female current smoker with GOLD stage 1 (FEV1 % predicted, 85%) with mild emphysema (low-attenuation area percentage [LAA%], 6.0%). The vascular analysis shows a ratio of blood volume for vessels less than 5 mm2 (BV5) to total blood volume of 0.58 (BV5 was 104.7 ml, and total blood volume was 179.6 ml). (B) A 66-year-old female former smoker with GOLD stage 2 (FEV1 % predicted, 67%) with moderate emphysema (LAA%, 11.3). The vascular analysis shows apparent pruning in the peripheral vasculature with a ratio of BV5 to total blood volume of 0.53 (BV5 was 104.7 ml, and total blood volume was 179.6 ml). (C) A 77-year-old male with GOLD stage 3 (FEV1 % predicted, 30.1%) with mild emphysema (LAA%, 8.5%). The ratio of BV5 to total blood volume is 0.5 (BV5 was 108.8 ml, and total blood volume was 218.2 ml), showing a diffuse vascular pruning. (D) A 46-year-old male with GOLD stage 4 (FEV1 % predicted, 29.3%) with upper lobe emphysema (LAA%, 25.8%). The vascular analysis shows pruning in upper lobes with a ratio of BV5 to total blood volume of 0.46 (BV5 was 104.4 ml, and total blood volume was 227.5 ml).
Figure 7.
Figure 7.
Cardiac remodeling. Computed tomographic images showing left (blue) and right (red) ventricles for two former smokers (anterior view). (A) Image of a 73-year-old man with minimal emphysema (low-attenuation area percentage [LAA%], 3.2%); FEV1 percent predicted of 72.4%; left ventricular (LV) and right ventricular (RV) volumes of 319.1 ml and 183.3 ml, respectively; and RV/LV ratio of 0.57. (B) Image of a 61-year-old man with advanced emphysema (LAA%, 38.2%); FEV1 percent predicted of 26.7%; LV and RV volumes of 208.2 ml and 190.3 ml, respectively; and RV/LV ratio of 0.91.
Figure 8.
Figure 8.
Body composition phenotypes. Manual segmentation of pectoralis muscles (blue = pectoralis major; brown = pectoralis minor) and subcutaneous adipose tissue (yellow) at the level of the aortic arch. (A) Image of a 62-year-old former smoker with body mass index of 16.6 kg/m2, 37% emphysema based on computed tomography, and FEV1 percent predicted of 27%. The cross-sectional area is 3,488 mm2 for the pectoralis muscles and 176 mm2 for the subcutaneous fat. (B) Image of a 61-year-old former smoker with body mass index of 30 kg/m2, 11% emphysema, and FEV1 percent predicted of 78%. The cross-sectional area is 3,545 mm2 for the pectoralis muscles and 7,533 mm2 for subcutaneous fat.
Figure 9.
Figure 9.
Summary of imaging features that can be derived from computed tomography (CT). The figure shows a summary of the main measurements that can be made using inspiratory computed tomographic scans. These include qualitative and semiquantitative determination of emphysema and emphysema subtype, quantitative estimates of emphysema using density histograms, bronchial wall thickness, and pulmonary vasculature. The addition of expiratory scans enables image matching and the computation of functional small airway disease using parametric response mapping, as well as the Jacobian determinant, an estimate of lung mechanics.

Similar articles

Cited by

References

    1. Kirby M, van Beek EJR, Seo JB, Biederer J, Nakano Y, Coxson HO, et al. Management of COPD: is there a role for quantitative imaging? Eur J Radiol. 2017;86:335–342. - PubMed
    1. Labaki WW, Martinez CH, Martinez FJ, Galbán CJ, Ross BD, Washko GR, et al. The role of chest computed tomography in the evaluation and management of the patient with chronic obstructive pulmonary disease. Am J Respir Crit Care Med. 2017;196:1372–1379. - PMC - PubMed
    1. Bodduluri S, Reinhardt JM, Hoffman EA, Newell JD, Jr, Bhatt SP. Recent advances in computed tomography imaging in chronic obstructive pulmonary disease. Ann Am Thorac Soc. 2018;15:281–289. - PMC - PubMed
    1. Regan EA, Hokanson JE, Murphy JR, Make B, Lynch DA, Beaty TH, et al. Genetic Epidemiology of COPD (COPDGene) study design. COPD. 2010;7:32–43. - PMC - PubMed
    1. Stewart JI, Moyle S, Criner GJ, Wilson C, Tanner R, Bowler RP, et al. for the COPDGene Investigators. Automated telecommunication to obtain longitudinal follow-up in a multicenter cross-sectional COPD study. COPD. 2012;9:466–472. - PMC - PubMed

Publication types

MeSH terms