

Review
doi: 10.1056/NEJMra1615014.
Classification, Ontology, and Precision Medicine
Affiliations
- PMID: 30304648
- PMCID: PMC6503847
- DOI: 10.1056/NEJMra1615014
Item in Clipboard
Review
Classification, Ontology, and Precision Medicine
N Engl J Med.
.
No abstract available
Figures
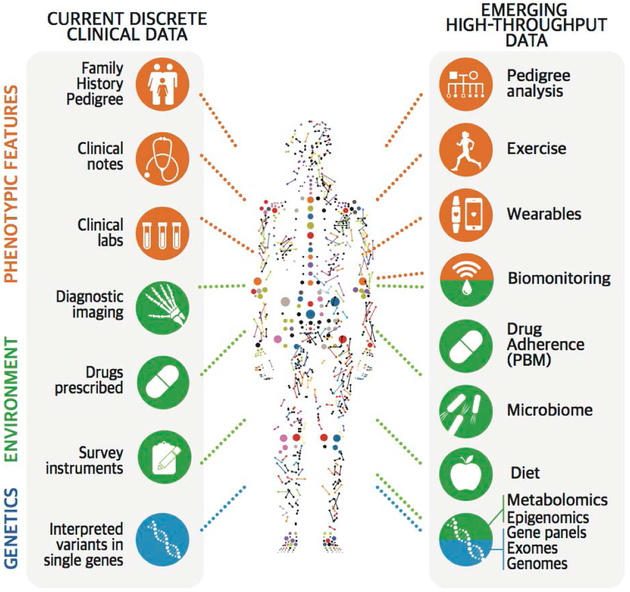
The health trajectory of a person can be measured many times and in many ways, including by examining various aspects of genotypic, phenotypic, and environmental attributes. Clinical data (left side) currently include family history, notes, laboratory reports, imaging, clinical instrument outputs, drugs and drug doses, and interpreted variants in single genes. These features are now being complemented by emerging, high-throughput, dynamic data (right side) that have not yet been fully harnessed to a classification of disease. Sources of such data include wearable devices that track exercise, weight, heart rate, diet, geographic location, adherence to the administration of medications, and so forth, collected over a period of minutes to years. All collected information (except germline sequencing) is a reflection of a discrete point in time in a person’s health trajectory. PBM denotes pharmacy benefit manager.
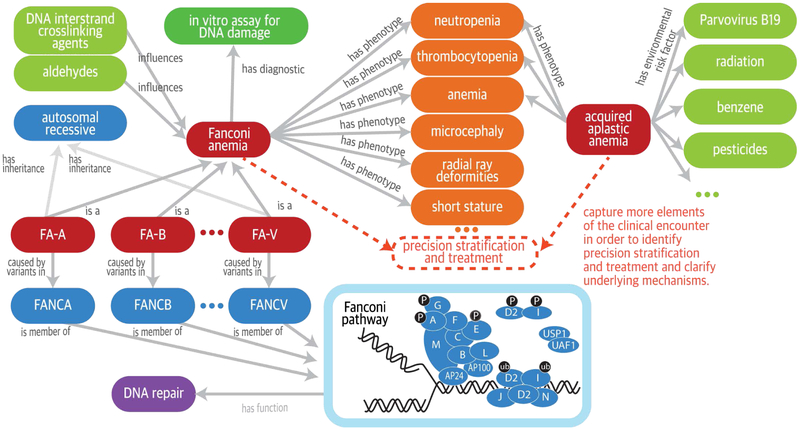
Fanconi anemia and acquired aplastic anemia share several phenotypic features but have very different causal mechanisms. Computable relationships can be represented among diseases, phenotypic features, genes, and environmental exposures by interlinking terms (concepts) from sources including the Orphanet Rare Disease ontology (ORDO) (pink denotes diseases), the Human Phenotype Ontology (HPO) for phenotypic features (orange), the Chemical Entities of Biological Interest ontology for the chemical compounds (green denotes factors such as chemical exposures that can influence severity or trigger development of disease), and the Ontology for Biomedical Investigations for the comet assay (single-cell gel-electrophoresis assay) of DNA breakage (aqua), as well as the Gene Ontology (lavender denotes a biologic pathway) and the Reactome for molecular pathways (blue denotes disease genes and mode of inheritance). Ontologies can be used to support the integrative analysis of these data sources for precision stratification and treatment and to clarify underlying mechanisms, as suggested by the dashed lines. The labeled arrows between concepts represent description-logic definitions that specify the formal relationships between the concepts. FA-A denotes Fanconi anemia, complementation group A; FA-B, complementation group B; and so on. In the diagram of the Fanconi anemia pathway, the blue circles represent the proteins encoded by the Fanconi genes (e.g., A is the protein encoded by FANCA), and the grayish-blue ovals represent other interacting proteins; P denotes phosphorylation, and ub ubiquitination.
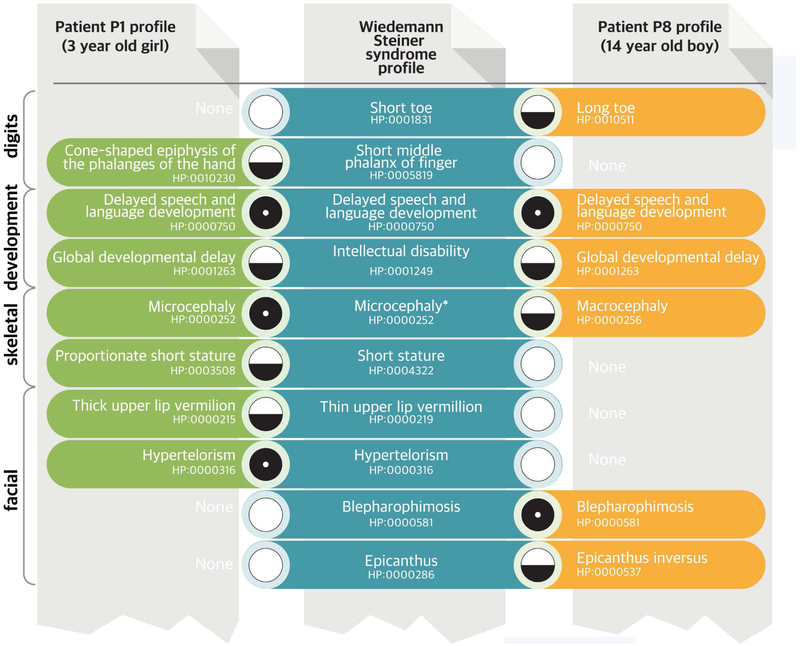
Shown in this example are portions of the HPO profiles (green and brown) of two patients for whom clinical dysmorphologic analysis did not help establish the diagnosis, even though they were seen in the same clinic within weeks of each other. Clinical exome sequencing showed a mutation in KMT2A in both patients, which in combination with the phenotype comparisons led to a diagnosis of the Wiedemann–Steiner syndrome. Each set of HPO terms is compared with all other phenotypic profiles in the HPO database to find the best nonexact (“fuzzy”) match. Each patient has a distinct phenotypic profile that only partially matches the computational model of the Wiedemann–Steiner syndrome derived from the literature (blue). Patient 1 had microcephaly, whereas Patient 2 was found to have macrocephaly; microcephaly had been observed in only one previously described patient. Some of the matches are relatively specific for this syndrome, such as blepharophimosis, and contribute more to the matching score than do features that are common to many diseases, such as intellectual disability. The final matching score can be calculated from the matching score for each query term and represents the proximity of the query term to its best match in the computational disease definition. A perfect match between a phenotypic feature of a patient and a feature of the disease is symbolized here by a black circle and would be assigned a high match score. A nonexact match (a fuzzy match, in which the patient has a feature that is similar to a feature of the disease but is not an exact match) is symbolized by a circle that is half black and half white and would be assigned a lower matching score. A lack of a match (a patient who does not have a feature that characterizes a disease) is symbolized by a white circle and can be penalized by some computational similarity algorithms. Existing algorithms exploit information in the ontology and annotations in many ways; commonly, they take into account the specificity of the term, usually calculated as the information content (not shown).
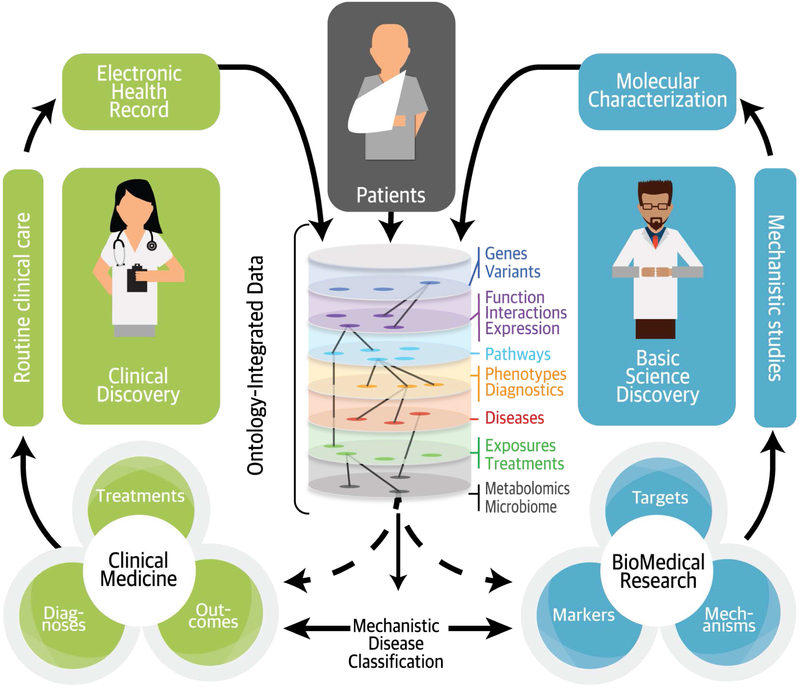
Well-structured clinical data can be readily integrated with discovery research data by using ontologies, which make clinical and basic science observations “computable” in a way that reflects present knowledge and allows new inferences. Integrating the two streams of data enables a mechanistic classification of disease across many data types, making a more refined and dynamic classification of patients possible.
Comment in
-
Undiagnosed and rare diseases: current challenges, perspectives and contribution of oral cavity examination.Oral Surg Oral Med Oral Pathol Oral Radiol. 2020 Aug;130(2):227-228. doi: 10.1016/j.oooo.2020.04.011. Epub 2020 May 31. Oral Surg Oral Med Oral Pathol Oral Radiol. 2020. PMID: 32493682 No abstract available.
References
-
- National Research Council, Committee on a Framework for Developing a New Taxonomy of Disease. Toward precision medicine: building a knowledge network for biomedical research and a new taxonomy of disease. Washington, DC: National Academies Press, 2011. - PubMed
-
- Marx V The DNA of a nation. Nature 2015;524:503–5. - PubMed
-
- Goroll AH. Emerging from EHR purgatory — moving from process to outcomes. N Engl J Med 2017;376:2004–6. - PubMed
Publication types
MeSH terms
Grants and funding
LinkOut - more resources
Full Text Sources
Other Literature Sources