. 2018 Oct 9;10(10):548.
doi: 10.3390/v10100548.

Recombinant GII.P16/GII.4 Sydney 2012 Was the Dominant Norovirus Identified in Australia and New Zealand in 2017

Affiliations

Recombinant GII.P16/GII.4 Sydney 2012 Was the Dominant Norovirus Identified in Australia and New Zealand in 2017

Jennifer H Lun et al. Viruses. .

Abstract

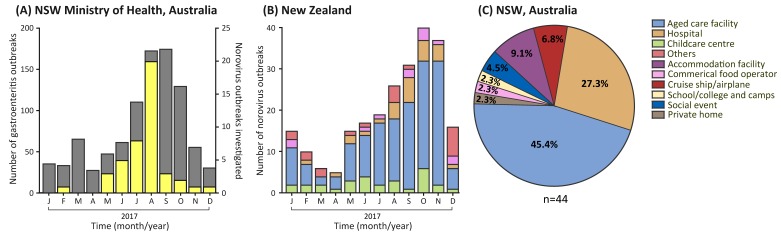
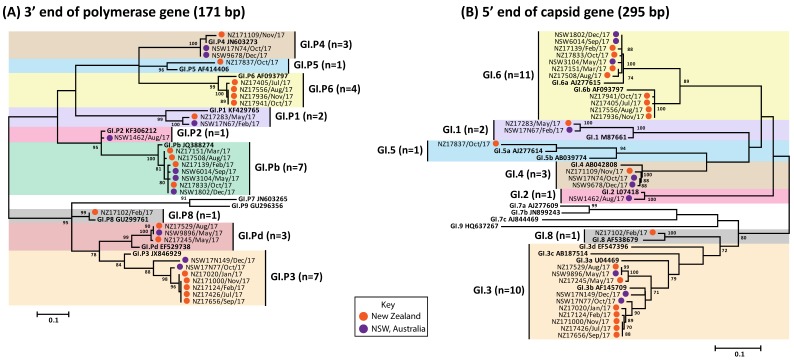
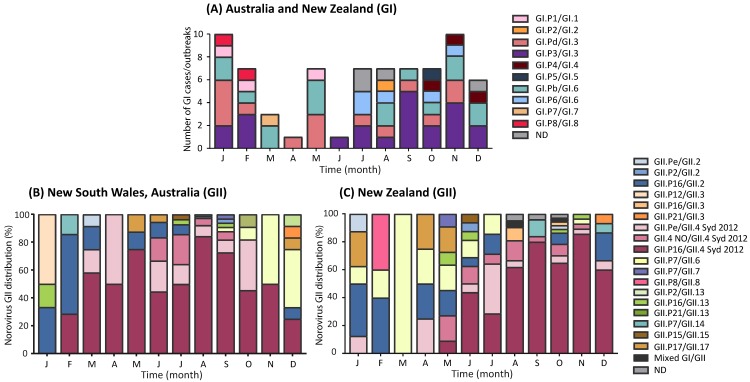
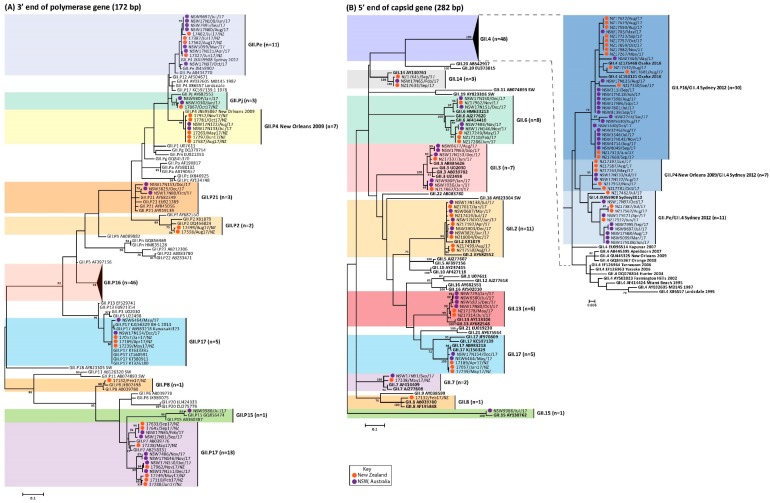
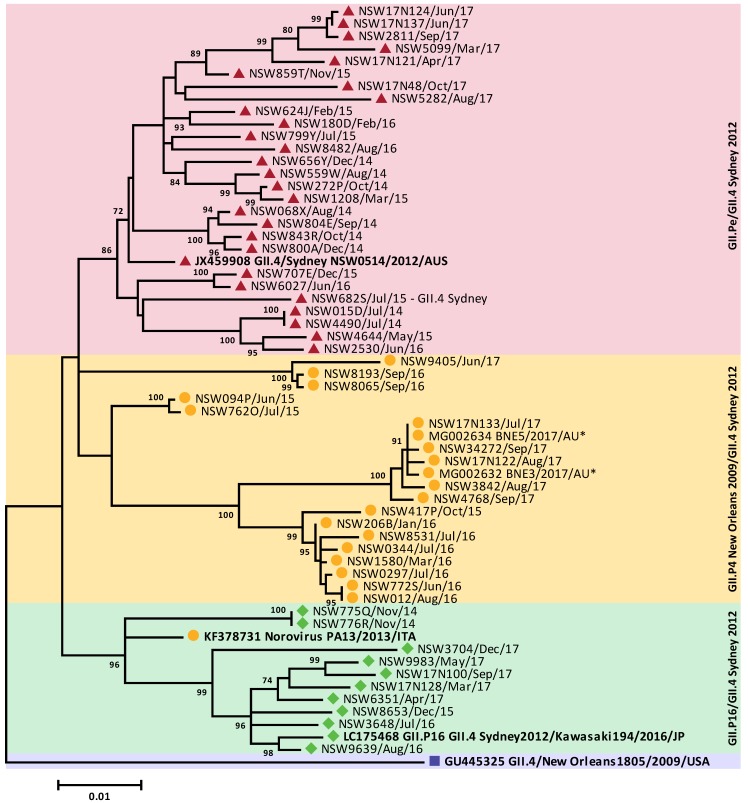
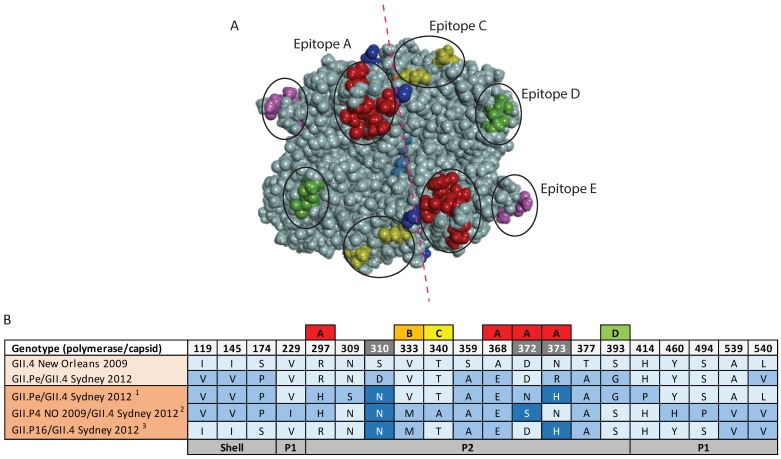
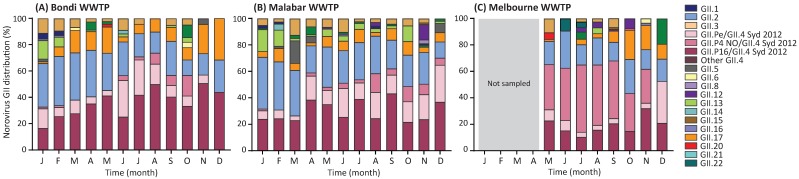
For the past two decades, norovirus pandemic variants have emerged every 3⁻5 years, and dominate until they are replaced by alternate strains. However, this scenario changed in 2016 with the co-circulation of six prevalent viruses, three of which possessed the pandemic GII.4 Sydney 2012 capsid. An increased number of institutional gastroenteritis outbreaks were reported within the Oceania region in mid-2017. This study identified emerging noroviruses circulating in Australia and New Zealand in 2017 to assess the changing dynamics of the virus infection. RT-PCR-based methods, next generation sequencing, and phylogenetic analyses were used to genotype noroviruses from both clinical and wastewater samples. Antigenic changes were observed between the capsid of pandemic Sydney 2012 variant and the two new Sydney recombinant viruses. The combination of these antigenic changes and the acquisition of a new ORF1 through recombination could both facilitate their ongoing persistence in the population. Overall, an increased prevalence of GII.P16/GII.4 Sydney 2012 viruses was observed in 2017, replacing the GII.P16/GII.2 recombinant that dominated in the region at the end of 2016. This shift in strain dominance was also observed in wastewater samples, demonstrating the reliability of wastewater as a molecular surveillance tool.

Keywords: Australia; MiSeq; New Zealand; clinical; genetic diversity; molecular epidemiology; next generation sequencing; norovirus; recombinant; wastewater.


Conflict of interest statement

The authors declare no conflict of interest.

Figures

Figure 1
Figure 1
The number of gastroenteritis and norovirus outbreaks reported in the Oceania region, 2017. (A) The monthly number of institutional gastroenteritis outbreaks reported to the NSW Ministry of Health department in 2017 (highlighted in grey), and the number of norovirus-associated outbreaks investigated in this study (highlighted in yellow); (B) The number of norovirus outbreaks reported to New Zealand Ministry of Health in 2017. The outbreak settings are categorized as indicated by the legend; (C) A total of 44 norovirus outbreaks were identified in NSW, Australia, throughout this study period. The outbreak settings are represented by different colors in the legend.
Figure 2
Figure 2
Phylogenetic analysis of polymerase (RdRp) and capsid (VP1) regions of GI noroviruses. Representative norovirus GI strains isolated in this study (n = 29), from both NSW, Australia and New Zealand, are shown in this phylogenetic analysis. They are denoted with a colored bullet (•), where Australian samples are represented in purple and New Zealand samples in orange. All samples are labelled with their geographical location and time of strain isolation. Reference strains were obtained from the GenBank database, labelled with their genotype and accession number. (A) Maximum likelihood phylogeny derived from partial 3′ end of polymerase gene (171 bp) of GI noroviruses. (B). Maximum phylogeny derived from partial 5′ end of capsid gene (295 bp) of GI noroviruses. Sequence alignments were performed with MUSCLE algorithm. Maximum likelihood phylogenetic trees were produced using MEGA 5 software (https://www.megasoftware.net/) with bootstrapping test of 1000 replicates, based on the Kimura 2-parameter model. The bootstrap percentage values are shown at each branch point for values ≥70%. The number of substitutions per site is indicated by the scale bar.
Figure 3
Figure 3
Monthly distribution of norovirus genotypes identified in the Oceania Region in 2017. (A) The number of GI norovirus genotypes identified in the Oceania region (Australia and New Zealand) during the study period. A total of 73 samples were collected and identified as GI norovirus, 52 cases were linked to outbreaks and the remaining were sporadic cases (n = 21). Both polymerase and capsid regions were sequenced to determine its genotype, with each genotype denoted by different colors as indicated in the legend. The ND represents samples that had incomplete genotyping results where only the capsid or the polymerase region was determined. (B) The monthly genotype distribution of GII noroviruses identified in New South Wales, Australia, throughout the study was examined. A total of 220 GII cases were identified in this study, where 44 were linked to outbreaks and the remaining were considered sporadic cases (n = 176). (C) All samples collected from New Zealand were of outbreak samples and a total of 184 GII outbreaks were investigated in 2017. The monthly genotype distribution of GII noroviruses are shown.
Figure 4
Figure 4
Phylogenetic analysis of polymerase (RdRp) and capsid (VP1) regions of GII norovirus. Representative norovirus GII strains isolated in this study (n = 92) from both NSW, Australia and New Zealand, are shown in this phylogenetic analysis. They are denoted with a colored bullet (•), where Australian samples are represented in purple and New Zealand samples in orange. All samples are labelled with their geographical location and time of strain isolation. Due to the number of sequences grouped within GII.P16 and GII.4, the sequences within those clusters were compressed and represented by the black triangles. Reference strains were obtained from the GenBank database, labelled with their genotype and accession number. (A) Maximum likelihood phylogeny derived from partial 3′ end of polymerase gene (172 bp) of GII noroviruses. (B). Maximum phylogeny derived from partial 5′ end of capsid gene (282 bp) of GII noroviruses. Sequence alignments were performed with MUSCLE algorithm. Maximum likelihood phylogenetic trees were produced using MEGA 5 software with bootstrapping test of 1000 replicates, based on the Kimura 2-parameter model. The bootstrap percentage values are shown at each branch point for values ≥70%. The number of substitutions per site is indicated by the scale bar.
Figure 5
Figure 5
Phylogenetic analysis of GII.4 full length capsid sequences. Representative full-length GII.4 capsid sequences were selected between 2013 to 2017 and compared to prototype GII.4 pandemic variants and GII.4 recombinant viruses. Sample sequences are denoted by the sample location, sample ID and date of collection. Prototype sequences of each GII.4 pandemic variant and GII.4 recombinant viruses are indicated in bold. Reference sequences were obtained from GenBank, labelled with its accession number and country of isolation. The GII.Pe/GII.4 Sydney 2012 sequences are denoted with a red triangle, GII.P4 New Orleans 2009/GII.4 Sydney 2012 with a yellow circle, the GII.P16/GII.4 Sydney 2012 sequences with a green diamond and the prototype GII.4 New Orleans 2009 is denoted by a purple square. The asterisks (*) denote sequences obtained from the Bruggink et al. 2018 study [34]. Sequence alignments were performed with MUSCLE algorithm. Maximum likelihood phylogenetic trees were produced using MEGA 5 software with bootstrapping test of 1000 replicates, based on the Kimura 2-parameter model. The bootstrap percentage values are shown at each branch point for values ≥70%. The scale bar indicates the number of substitutions per site.
Figure 6
Figure 6
Capsid residue variation and antigenic variation within the full-length capsid of GII.4 recombinant viruses. Full-length capsid sequence of novel GII.4 recombinant viruses were collected between July 2014 and December 2017. Consensus sequences of contemporary GII.Pe/GII.4 Sydney 20121 (n = 20), GII.4 New Orleans 2009/GII.4 Sydney 20122 (n = 13) and GII.P16/GII.4 Sydney 20123 (n = 9) were generated and compared to pandemic variants (New Orleans 2009 and Sydney 2012) for the identification of antigenic variations, especially within the P2 protruding domain. (A) Characterized blockade antibody epitopes are highlighted in the different colors; epitope A (red), epitope C (yellow), epitope D (green) and epitope E (purple). The residues within P2 domain, especially those within epitope A, which differed from the pandemic Sydney 2012 variant. The red dotted line shows symmetry. (B) Antigenic variations observed between full length capsid sequences of pandemic Sydney variant and the new Sydney 2012 recombinants. Labelled boxes above the antigenic sites indicate sites within known blockade epitopes A–D that are important determinants of viral antigenicity. The A–D epitopes identified in GII.4 capsid are colored; epitope A (red), epitope B (orange), epitope C (yellow) and epitope D (green). The numbers across the top panel indicate the amino acid position within the VP1 sequence, hypervariable sites with ≥3 amino acids substitutions across all sequences are shaded in grey. Residues that vary from the GII.4 New Orleans 2009 sequence over time are indicated by shades of blue. The bottom panel indicates the positions of the shell, P1 and P2 domains within the VP1 capsid protein. The prototype of each pandemic/recombinant variants are indicated in the lightest shade of orange.
Figure 7
Figure 7
Norovirus GII genotype distribution in wastewater samples collected from Sydney and Melbourne, 2017. The norovirus GII capsid genotypic distribution was determined in wastewater samples by amplicon sequencing using NGS technology. After amplification of the capsid region, a second round PCR was performed for the addition of adapters prior NGS library preparation. Libraries were sequenced on the MiSeq platform and an average of 152,879 reads were generated for each sample. Geneious was used for merging and mapping of the reads to the norovirus GII reference sequences. (A) The monthly genotype distribution of norovirus GII viruses in wastewater samples collected from Bondi WWTP in Sydney, Australia. (B) Norovirus GII genotypic diversity was examined in wastewater samples collected monthly from Malabar WWTP in Sydney, Australia. (C) The monthly norovirus GII genotype diversity was also examined in Melbourne, all samples were collected from western wastewater treatment plant. Samples were not collected between January and April 2017. Norovirus GII capsid genotype and GII.4 recombinants are labelled in different colors as indicated by the legend.

References

    1. Lozano R., Naghavi M., Foreman K., Lim S., Shibuya K., Aboyans V., Abraham J., Adair T., Aggarwal R., Ahn S.Y. Global and regional mortality from 235 causes of death for 20 age groups in 1990 and 2010: A systematic analysis for the Global Burden of Disease Study 2010. Lancet. 2012;380:2095–2128. doi: 10.1016/S0140-6736(12)61728-0. - DOI - PMC - PubMed
    1. Bartsch S.M., Lopman B.A., Ozawa S., Hall A.J., Lee B.Y. Global economic burden of norovirus gastroenteritis. PLoS ONE. 2016;11:e0151219. doi: 10.1371/journal.pone.0151219. - DOI - PMC - PubMed
    1. Siebenga J.J., Vennema H., Zheng D.-P., Vinjé J., Lee B.E., Pang X.-L., Ho E.C., Lim W., Choudekar A., Broor S. Norovirus illness is a global problem: Emergence and spread of norovirus GII. 4 variants, 2001–2007. J. Infect. Dis. 2009;200:802–812. doi: 10.1086/605127. - DOI - PubMed
    1. Teunis P.F., Moe C.L., Liu P., Miller S.E., Lindesmith L., Baric R.S., Le Pendu J., Calderon R.L. Norwalk virus: How infectious is it? J. Med. Virol. 2008;80:1468–1476. doi: 10.1002/jmv.21237. - DOI - PubMed
    1. Kroneman A., Vega E., Vennema H., Vinjé J., White P.A., Hansman G., Green K., Martella V., Katayama K., Koopmans M. Proposal for a unified norovirus nomenclature and genotyping. Arch. Virol. 2013;158:2059–2068. doi: 10.1007/s00705-013-1708-5. - DOI - PMC - PubMed

Publication types