. 2018 Oct 9;10(10):407.
doi: 10.3390/toxins10100407.

Protective Effect of N-Acetylcysteine against Oxidative Stress Induced by Zearalenone via Mitochondrial Apoptosis Pathway in SIEC02 Cells

Affiliations

Protective Effect of N-Acetylcysteine against Oxidative Stress Induced by Zearalenone via Mitochondrial Apoptosis Pathway in SIEC02 Cells

Jingjing Wang et al. Toxins (Basel). .

Abstract

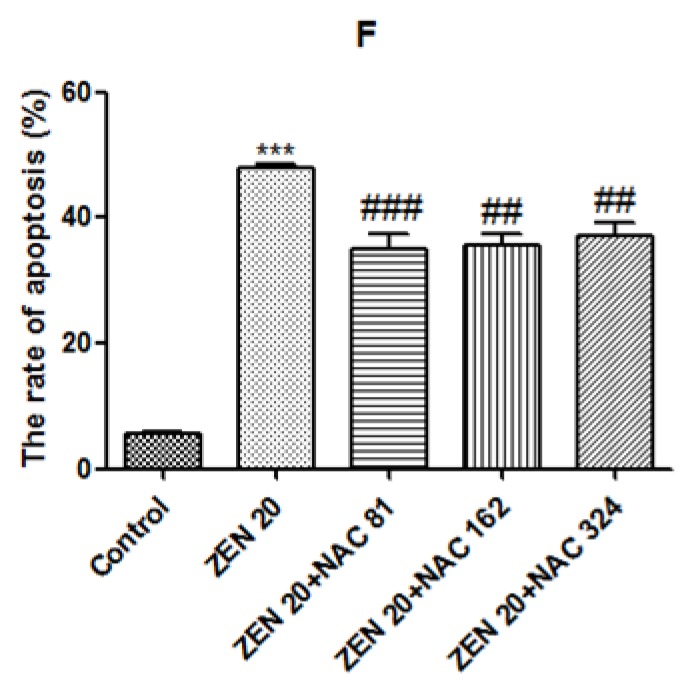
Zearalenone (ZEN), a nonsteroidal estrogen mycotoxin, is widely found in feed and foodstuffs. Intestinal cells may become the primary target of toxin attack after ingesting food containing ZEN. Porcine small intestinal epithelial (SIEC02) cells were selected to assess the effect of ZEN exposure on the intestine. Cells were exposed to ZEN (20 µg/mL) or pretreated with (81, 162, and 324 µg/mL) N-acetylcysteine (NAC) prior to ZEN treatment. Results indicated that the activities of glutathione peroxidase (Gpx) and glutathione reductase (GR) were reduced by ZEN, which induced reactive oxygen species (ROS) and malondialdehyde (MDA) production. Moreover, these activities increased apoptosis and mitochondrial membrane potential (ΔΨm), and regulated the messenger RNA (mRNA) expression of Bax, Bcl-2, caspase-3, caspase-9, and cytochrome c (cyto c). Additionally, NAC pretreatment reduced the oxidative damage and inhibited the apoptosis induced by ZEN. It can be concluded that ZEN-induced oxidative stress and damage may further induce mitochondrial apoptosis, and pretreatment of NAC can degrade this damage to some extent.

Keywords: Mitochondrial apoptosis; N-acetylcysteine; SIEC02 cells; Zearalenone.


Conflict of interest statement

The authors declare no conflict of interest.

Figures

Figure 1
Figure 1
Effects of zearalenone (ZEN) and N-acetylcysteine (NAC) on SIEC02 cells viability. Cells were treated without or with different concentrations of ZEN (0, 5, 10, 15, 20, 25 and 30 µg/mL) for 24 h (A). Cells were pretreated without or with different concentrations of NAC (81, 162 and 324 µg/mL) for 6 h, 12 h, and 24 h (B). Cells survival was measured by Cell Counting Kit-8 (CCK-8) assay. The values are mean ± SD of three independent experiments. *** indicates a significant difference between ZEN and control at P < 0.001. #, ## indicates a significant difference of 12 h between NAC and control, with significant differences at P < 0.05 and P < 0.01. $$, $$$ indicates a significant difference of 24 h between NAC and the control at P < 0.01 and P < 0.001.
Figure 2
Figure 2
Effect of ZEN (20 µg/mL) and NAC (81, 162 and 324 µg/mL) on intracellular glutathione peroxidase (Gpx), glutathione reductase (GR) activity, and malondialdehyde (MDA) levels. Cells were exposed to ZEN for 24 h, including NAC pretreatment for 6 h. The results of Gpx, GR, and MDA were µmol/mg, U/mg, nmol/mg of protein, respectively. Each set of data shows the mean ± SD of three independent experiments. *** indicates a significant difference between ZEN and control P < 0.001. #, ###, indicates a significant difference between ZEN and NAC in mutual treatment at P < 0.05 and P < 0.001. $ indicates a significant difference between three concentrations of NAC at P < 0.05 (AC).
Figure 3
Figure 3
Effect of ZEN (20 µg/mL) and NAC (81, 162 and 324 µg/mL) on intracellular reactive oxygen species (ROS) production. Cells were exposed to ZEN for 24 h, including NAC pretreatment for 6 h. The results are expressed as mean fluorescent intensity (MFI). Each set of data shows the mean ± SD of the three independent experiments. *** indicates a significant difference between ZEN and control at P < 0.001. ##, ### indicates a significant difference between ZEN and NAC in mutual treatment at P < 0.01 and P < 0.001. $ indicates a significant difference between three concentrations of NAC at P < 0.05.
Figure 4
Figure 4
Annexin V-FITC/PI flow cytometry was used to detect SIEC02 cells treated with ZEN (20 µg/mL) and NAC (81, 162 and 324 µg/mL). The Q1, Q2, Q3, and Q4 gates, respectively, represented dead cells, the late stage of cell apoptosis, normal cells, and the early stage of cell apoptosis (A, B, C, D and E are control, ZEN 20 µg/mL, ZEN 20 µg/mL + NAC 81 µg/mL, ZEN 20 µg/mL + NAC 162 µg/mL, and ZEN 20 µg/mL + NAC 324 µg/mL, respectively). Apoptosis results are expressed as the rate of apoptosis. Each set of data shows the mean ± SD of the three independent experiments. *** indicates a significant difference between ZEN and control at P < 0.001. ## indicates a significant difference between ZEN and NAC in mutual treatment at P < 0.01. $ indicates a significant difference between three concentrations of NAC at P < 0.05 (F).
Figure 4
Figure 4
Annexin V-FITC/PI flow cytometry was used to detect SIEC02 cells treated with ZEN (20 µg/mL) and NAC (81, 162 and 324 µg/mL). The Q1, Q2, Q3, and Q4 gates, respectively, represented dead cells, the late stage of cell apoptosis, normal cells, and the early stage of cell apoptosis (A, B, C, D and E are control, ZEN 20 µg/mL, ZEN 20 µg/mL + NAC 81 µg/mL, ZEN 20 µg/mL + NAC 162 µg/mL, and ZEN 20 µg/mL + NAC 324 µg/mL, respectively). Apoptosis results are expressed as the rate of apoptosis. Each set of data shows the mean ± SD of the three independent experiments. *** indicates a significant difference between ZEN and control at P < 0.001. ## indicates a significant difference between ZEN and NAC in mutual treatment at P < 0.01. $ indicates a significant difference between three concentrations of NAC at P < 0.05 (F).
Figure 5
Figure 5
A laser scanning confocal microscope was used to observe the changes of mitochondrial membrane potential (ΔΨm) in SIEC02 cells treated with ZEN and NAC. The scanning pictures were as shown in the figure (AE are control, ZEN 20 µg/mL, ZEN 20 µg/mL + NAC 81 µg/mL, ZEN 20 µg/mL + NAC 162 µg/mL and ZEN 20 µg/mL + NAC 324 µg/mL, respectively). Scale bar: 10 µm. The results are expressed as apoptosis rate (F); each set of data shows the mean ± SD of the three independent experiments. *** indicates a significant difference between ZEN and control at P < 0.001. ##, ### indicates a significant difference between ZEN and NAC in mutual treatment at P < 0.01 and P < 0.001 (F).
Figure 5
Figure 5
A laser scanning confocal microscope was used to observe the changes of mitochondrial membrane potential (ΔΨm) in SIEC02 cells treated with ZEN and NAC. The scanning pictures were as shown in the figure (AE are control, ZEN 20 µg/mL, ZEN 20 µg/mL + NAC 81 µg/mL, ZEN 20 µg/mL + NAC 162 µg/mL and ZEN 20 µg/mL + NAC 324 µg/mL, respectively). Scale bar: 10 µm. The results are expressed as apoptosis rate (F); each set of data shows the mean ± SD of the three independent experiments. *** indicates a significant difference between ZEN and control at P < 0.001. ##, ### indicates a significant difference between ZEN and NAC in mutual treatment at P < 0.01 and P < 0.001 (F).
Figure 6
Figure 6
The results of the ZEN (20 µg/mL) and NAC (81, 162 and 324 µg/mL) expression levels of each apoptotic gene (Bcl-2, Bax, cytochrome c, caspase-9, caspase-3) in the SIEC02 cells. Cells were exposed to ZEN for 24 h, including NAC pretreatment for 6 h. The results are expressed relative to the expression of actin; each set of data shows the mean ± SD of the three independent experiments. *, **, *** indicates a significant difference between ZEN and control at P < 0.05, P < 0.01, and P < 0.001. #, ##, ### indicates a significant difference between ZEN and NAC in mutual treatment at P < 0.05, P < 0.01, and P < 0.001. $$ indicates a significant difference between three concentrations of NAC at P < 0.01 (AE).

References

    1. Rui G., Meng Q., Li J., Min L., Zhang Y., Bi C., Shan A. Modified halloysite nanotubes reduce the toxic effects of zearalenone in gestating sows on growth and muscle development of their offsprings. J. Anim. Sci. Biotechno. 2016;7:570–578. - PMC - PubMed
    1. Gao X., Sun L., Zhang N., Li C., Zhang J., Xiao Z., Qi D. Gestational zearalenone exposure causes reproductive and developmental toxicity in pregnant rats and female offspring. Toxins. 2017;9:21. doi: 10.3390/toxins9010021. - DOI - PMC - PubMed
    1. Wu L., Li J., Li Y., Li T., He Q., Tang Y., Liu H., Su Y., Yin Y., Liao P. Aflatoxin b1, zearalenone and deoxynivalenol in feed ingredients and complete feed from different province in china. J. Anim. Sci. Biotechno. 2016;7:63. doi: 10.1186/s40104-016-0122-8. - DOI - PMC - PubMed
    1. Moretti A., Logrieco A.F., Susca A. Mycotoxins: An underhand food problem. In: Moretti A., Susca A., editors. Mycotoxigenic Fungi. Vol. 1542. Humana Press; New York, NY, USA: 2017. pp. 3–12. - PubMed
    1. Stanciu O., Banc R., Cozma A., Filip L., Miere D., Mañes J., Loghin F. Occurence of fusarium mycotoxins in wheat from europe—a review. Acta. Universitatis. Cibiniensis. 2015;19:35–60. doi: 10.1515/aucft-2015-0005. - DOI

Publication types

MeSH terms