. 2018 Oct 9;10(10):373.
doi: 10.3390/cancers10100373.

Cytoplasmic p21 Mediates 5-Fluorouracil Resistance by Inhibiting Pro-Apoptotic Chk2

Affiliations

Cytoplasmic p21 Mediates 5-Fluorouracil Resistance by Inhibiting Pro-Apoptotic Chk2

Arnatchai Maiuthed et al. Cancers (Basel). .

Abstract

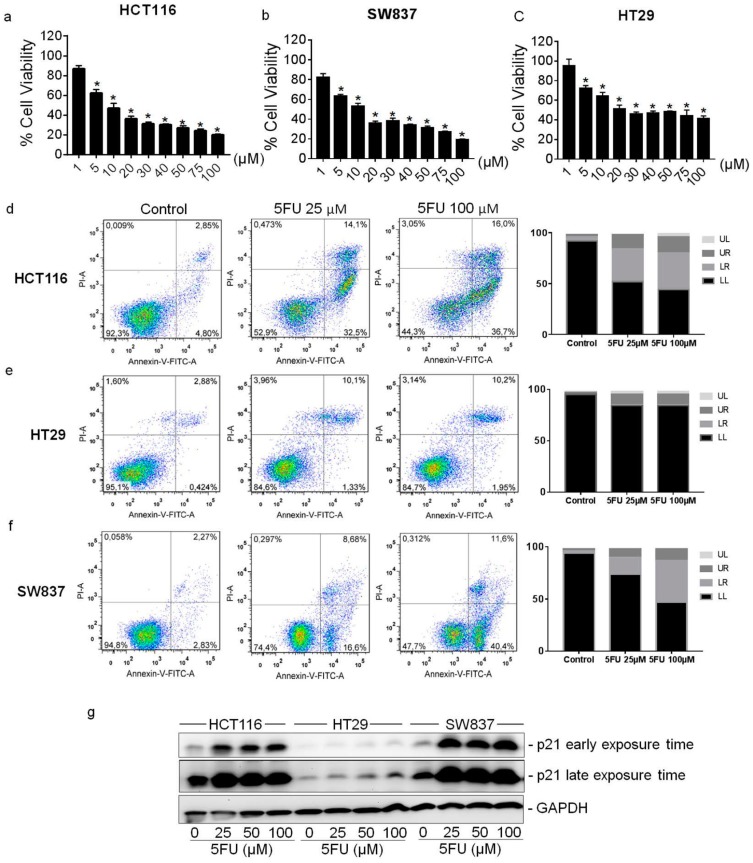
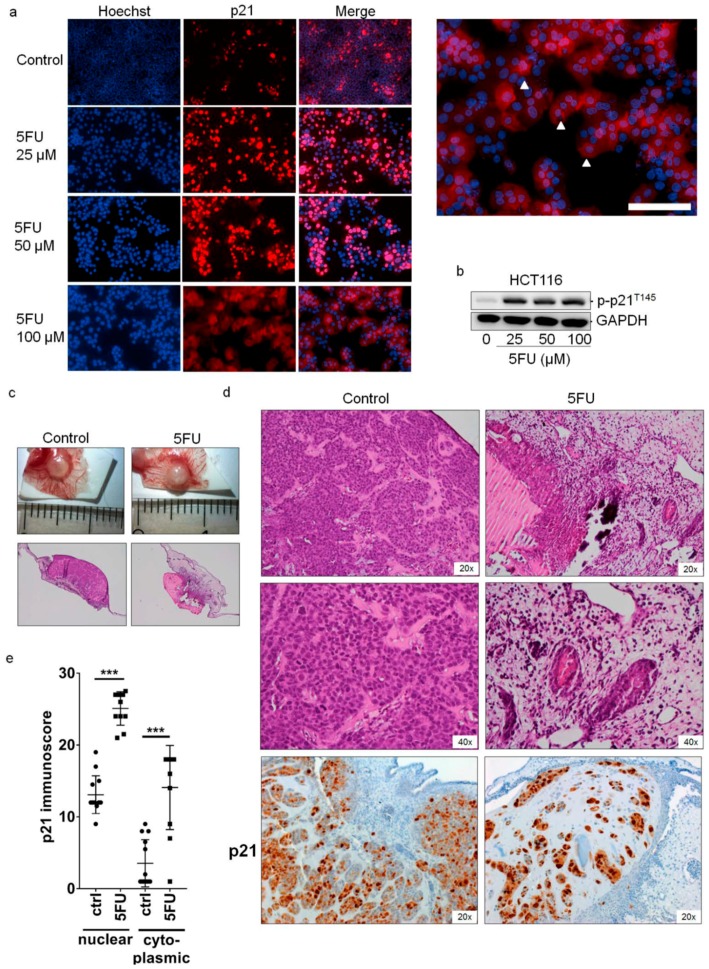
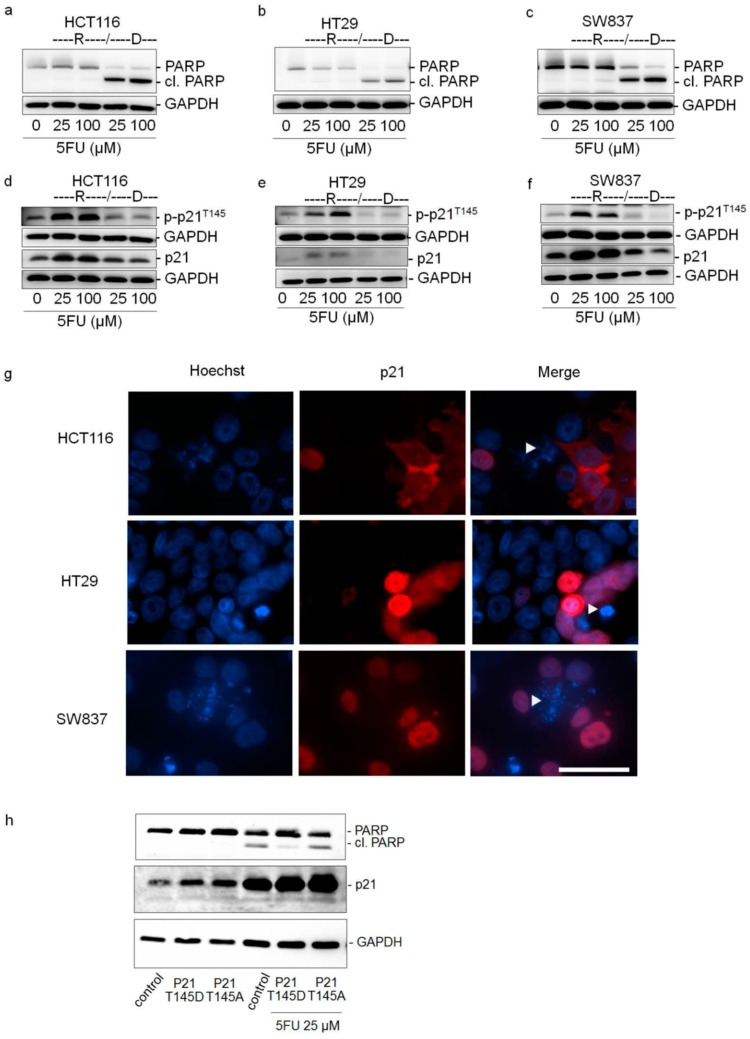
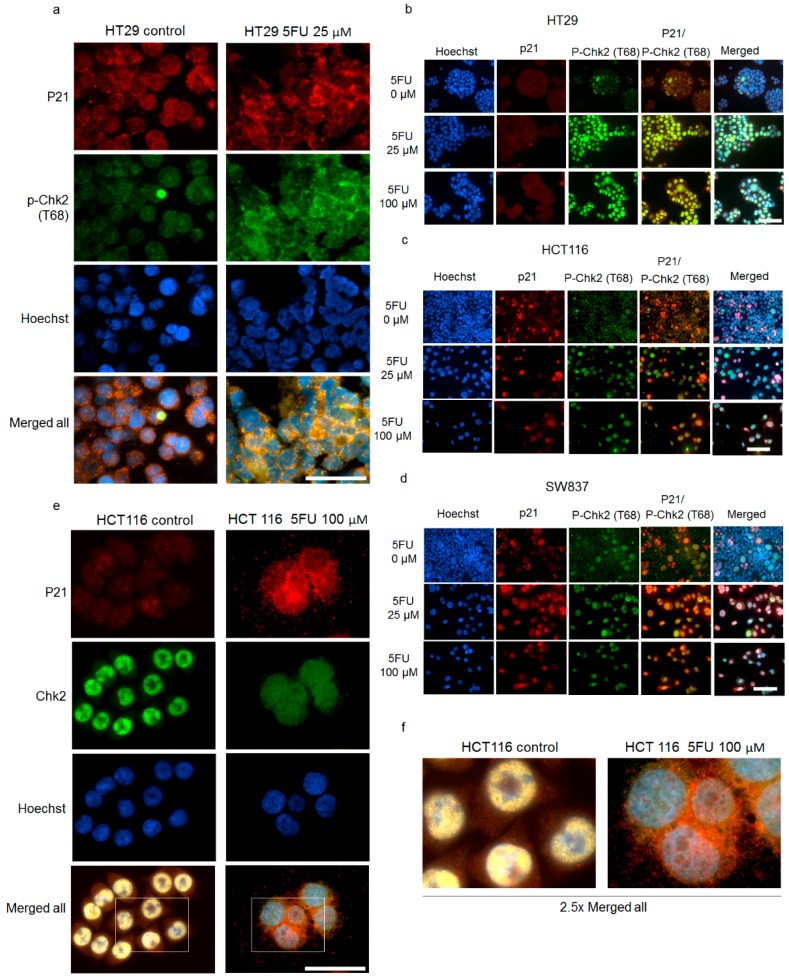
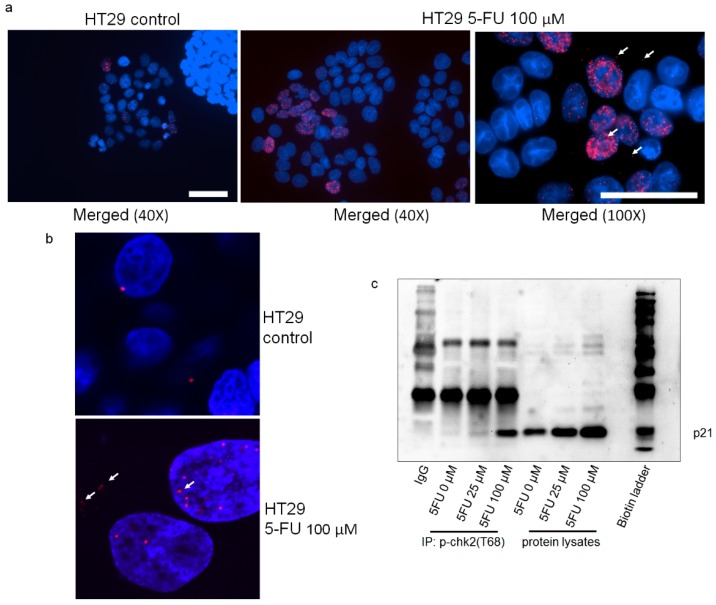
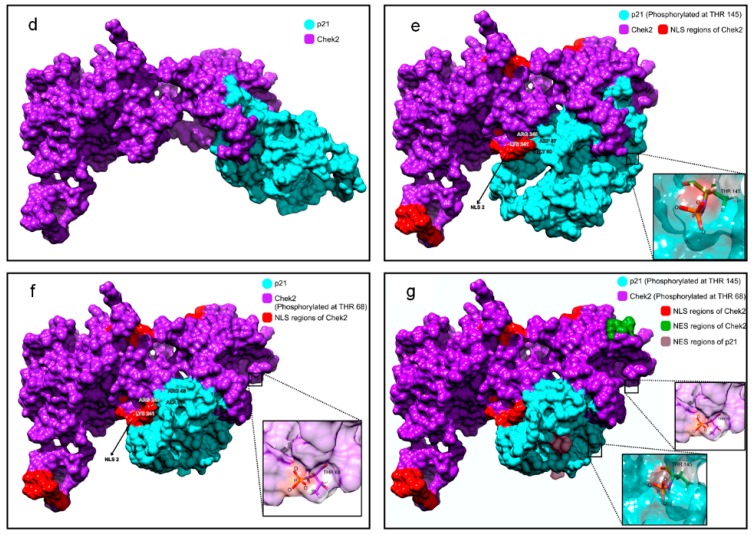
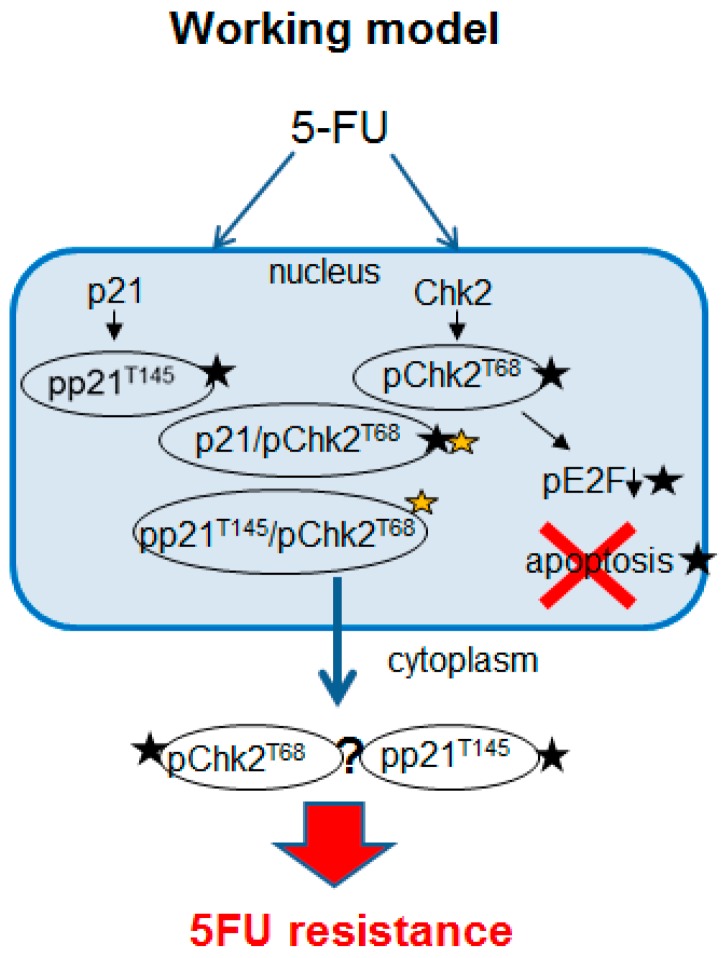
The oncogenic cytoplasmic p21 contributes to cancer aggressiveness and chemotherapeutic failure. However, the molecular mechanisms remain obscure. Here, we show for the first time that cytoplasmic p21 mediates 5-Fluorouracil (5FU) resistance by shuttling p-Chk2 out of the nucleus to protect the tumor cells from its pro-apoptotic functions. We observed that cytoplasmic p21 levels were up-regulated in 5FU-resistant colorectal cancer cells in vitro and the in vivo Chorioallantoic membrane (CAM) model. Kinase array analysis revealed that p-Chk2 is a key target of cytoplasmic p21. Importantly, cytoplasmic form of p21 mediated by p21T145D transfection diminished p-Chk2-mediated activation of E2F1 and apoptosis induction. Co-immunoprecipitation, immunofluorescence, and proximity ligation assay showed that p21 forms a complex with p-Chk2 under 5FU exposure. Using in silico computer modeling, we suggest that the p21/p-Chk2 interaction hindered the nuclear localization signal of p-Chk2, and therefore, the complex is exported out of the nucleus. These findings unravel a novel mechanism regarding an oncogenic role of p21 in regulation of resistance to 5FU-based chemotherapy. We suggest a possible value of cytoplasmic p21 as a prognosis marker and a therapeutic target in colorectal cancer patients.

Keywords: 5-fluorouracil resistance; Chk2; colorectal cancer; cytoplasmic p21; p21; protein interaction.


Conflict of interest statement

The authors declare no conflicts of interest.

Figures

Figure 1
Figure 1
Susceptibility of colorectal cancer cell lines towards 5FU treatment and p21 expression in 5FU-resistant cells. Effects of 5FU on cell viability of (a) HCT116 (b) SW837 and (c) HT29 cells. Cells were treated with various concentrations of 5FU (0–100 μM) for 48 h. The percentage of cell viability was determined by the MTT assay. Values represent means ± SD of three independent experiments. * p < 0.05 versus non-treated control. Effects of 5FU on cell apoptosis of (d) HCT116 (e) HT29 and (f) SW837 cells. Cells were treated with 25 μM or 100 μM of 5FU for 48 h. Apoptotic cell death was determined by Annexin-PI co-staining and fluorescent signals were analyzed by flow cytometry. UL: upper left (necrosis), LL: lower left (vital), LR: lower right (apoptosis), UR: upper right (late apoptosis). (g) The expression level of p21 in 5FU-resistant cells was determined by Western Blot analysis in three colorectal cancer cell lines. Cells were treated with various concentrations of 5FU for 48 h. After incubation, dead cells were discarded by washing the plates 3 times with PBS, and the remaining resistant cells were collected to prepare protein lysates as mentioned in the Material and Methods section. The blots were re-probed with GAPDH to confirm equal loading of the samples.
Figure 2
Figure 2
Localization of p21 in 5FU-resistant HCT116 cells. (a) HCT116 cells were treated with various concentrations of 5FU for 48 h and the expression of p21 was determined by immunofluorescence staining using mouse anti-p21 monoclonal antibodies followed by an Alexa Fluor 555-labeled secondary antibody to visualize p21 expression (red) and the nuclei (Hoechst 33342, blue). Scale bar: 50 μm. (b) The expression level of phosphorylated-p21 (p-p21T145) in 5FU-resistant HCT116 cells was determined by Western Blot analysis. Cells were treated with various concentrations of 5FU for 48 h. After incubation, dead cells were discarded by washing the plates 3 times with PBS and the remaining resistant cells were collected to prepare protein lysates as mentioned in the Material and Methods section. The blots were re-probed with GAPDH to confirm equal loading of the samples. (c) Ex ovo images and overviews of H&E-stained sections of CAM micro-tumors. For this, HCT116 cells were treated with 15 μM of 5FU for 48 h. Then the 5FU-resistant HCT116 cells were subjected to the CAM. After 5 days, tumor tissues were collected, tumor size was measured, and xenografts were subjected to standard histological and immunohistochemical procedures. (d) H&E staining and immunohistochemical staining of p21 protein in vital areas of tumor slices. (e) Immunoscore of p21 regarding its cytoplasmic and nuclear localization in xenografts of 5FU-treated HCT116 and control cells. *** p < 0.001 versus non-treated control.
Figure 3
Figure 3
Cytoplasmic p21 mediates 5FU resistance in colorectal cancer cells. (af) The expression levels of PARP, cleaved PARP (cl. PARP), phosphorylated-p21 (p-p21T145) and p21 in resistant cells (R) and dead cells (D) were determined by Western Blot analysis after 48 h of treatment with 5FU. For this, HCT116, HT29, and SW837 cells were treated with various concentrations of 5FU. After 48 h, resistant cells (R) and dead cells (D) were collected separately and protein lysates were prepared. The blots were re-probed with GAPDH to confirm equal loading of the samples. (g) Expression of p21 in viable and dead cells after 48 h of 5FU treatment. HCT116, HT29, and SW837 cells were treated with various concentrations of 5FU for 48 h and the expression levels of p21 were determined by immunofluorescence staining for p21 (red) and the cell nuclei (Hoechst 33342, blue). White arrow indicates apoptotic cells having condensed chromatin and/or fragmented nuclei. Scale bar: 50 μm. (h) 5FU susceptibility of HCT116 cells transfected with hyperphosphorylated p21T145D and unphosphorylatable p21T145A. After 24 h of transfection, cells were treated with 5FU (25 μM) for further 48 h. Untreated cells were used as controls. The expression levels of PARP, cleaved PARP (cl. PARP), and p21 were determined by Western Blot analysis. The blots were re-probed with GAPDH to confirm equal loading of the samples.
Figure 4
Figure 4
Susceptibility of HCT116 wild-type (HCT116) and HCT116 p21 knockout (p21−/−) colorectal cancer cell lines towards 5FU treatment. (a) Effects of 5FU (10 μM) on the induction of apoptosis and necrosis in HCT116 and p21−/− cells after 48 h of incubation as assessed by the Annexin-PI assay. The experiment was carried out in technical and biological duplicate. One representative experiment is shown. (b) Fractions of live, early-apoptotic, late-apoptotic and necrotic cells in 5FU-treated and control HCT116 and p21−/− cell populations as determined from the Annexin-PI assay after 48 h of incubation. Values of one representative experiment are shown. (c) Cell viability of HCT116 and p21−/− cells after treatment with 5FU (10 μM) for 24 h and 48 h with respect to DMSO controls. Values represent means ± SD of three independent experiments. ** p < 0.01.
Figure 5
Figure 5
p21 inhibits pro-apoptotic effect of Chk2. (a,b) Expression levels of phospho-proteins in transfected cells. HCT116 cells were transfected with hyperphosphorylated p21T145D. After 48 h of transfection, cells lysates were prepared and subjected to the Human Phospho-Kinase Array Kit (R&D systems). The expression levels of phosphorylated Chk2 (p-Chk2T68) and Chk2 in 5FU-resistant HCT116 (c), HT29 (d), and SW837 (e) cells were determined by Western Blot. (The same lysates were loaded on two different membranes for Chk2 and pChk2 detection). For this, cells were treated with various concentrations of 5FU for 48 h. Dead cells were removed by washing with PBS and the remaining viable cells were collected to prepare protein lysates as mentioned in the Material and Methods sections. The blots were re-probed with GAPDH to confirm equal loading of the samples. (f) The expression levels of phosphorylated Chk2 (p-Chk2T68), Chk2, and p-E2F1 in HCT116 cells transfected with hyperphosphorylated p21T145D and unphosphorylatable p21T145A in response to 5FU treatment were determined by Western Blot analysis. After 24 h transfection, cells were left untreated or were treated with 5FU (25 μM) for further 48 h. Dead cells were removed by washing with PBS and the remaining viable cells were collected to prepare protein lysates. The expression of p-E2F1, p-Chk2T68 and Chk2 were determined and the blots were re-probed with GAPDH to confirm equal loading of the samples. Immunohistochemical staining of p-chk2T68 in CAM xenografts formed by HCT116 control (g) and HCT116 5FU-treated (h) cells. (i) p-chk2T68 immunoscore in cytoplasmic and nuclear localizations in tumors of the HCT116 5FU-treated and untreated groups. * p < 0.05 versus non-treated control.
Figure 6
Figure 6
Co-localization of p21 and p-Chk2T68/Chk2 in 5FU-resistant cells. (a,b) HT29, (c) HCT116 and (d) SW837 cells were treated with various concentrations of 5FU for 48 h and the expression of p21 and p-Chk2T68 was examined by immunofluorescence staining using mouse anti-p21 monoclonal antibodies followed by an Alexa Fluor 555-labeled secondary antibody to visualize p21 expression (red), rabbit anti-p-Chk2T68 monoclonal antibodies followed by an Alexa Fluor 488-labeled secondary antibody to visualize p-Chk2T68 expression (green) and cell nuclei (Hoechst 33342, blue). (a) Enlarged images of p21 and p-Chk2T68 co-localization in 5FU-resistant HT29 cells. Scale bar: 50 μm; (e) HCT116 cells were treated with 100 μM 5FU for 48 h and the expression of p21 and Chk2 was examined by immunofluorescence staining using mouse anti-p21 monoclonal antibodies followed by an Alexa Fluor 555-labeled secondary antibody to visualize p21 expression (red), rabbit anti-Chk2 monoclonal antibodies followed by an Alexa Fluor 488-labeled secondary antibody to visualize Chk2 expression (green) and cell nuclei (Hoechst 33342, blue). Scale bar: 50 μm; and (f) 2.5-fold computer-enlarged images from merge images in (e).
Figure 7
Figure 7
Interaction between p21 and Chk2 proteins. Cells were treated with 100 μM 5FU for 48 h and the protein–protein interaction of p21-p-Chk2T68 was analyzed by proximity ligation assay (HT29) (red signals indicate the protein–protein interaction between p21 and p-Chk2T68. (a) Fluorescence images of untreated control HT29 cells (40× magnification) and 5FU-treated HT29 cells (40× and 100× magnification) (scale bar: 50 μm); (b) confocal images. (c) 5FU-treated HCT116 cell lysates were prepared and immunoprecipitated with an anti-p-chk2T68 antibody. The resulting immune complexes were then analyzed for p21 by Western Blot using an anti-p21 antibody. (d) Complex of p21 and Chk2 obtained by structural modelling; p21 (cyan) was modelled using two PDB structures 4I58 and 5EOU as templates using MODELLER [39]. Chk2 (magenta) was obtained from its crystal structure 2WTC after removing the coordinates of the inhibitor. The structures were energy-minimized and docked using ClusPro [40] and rendered using Chimera [40]. (e) Complex of phosphorylated p21 and Chek2: the energy-minimized stable structure of p21 (cyan) was phosphorylated at Threonine residue at position 145 using Chimera [41] and was docked with the structural model of Chek2 (magenta) using ClusPro [40]. The nuclear localization signal (NLS) region of Chk2 is shown in red. The insert shows the phosphorylation of T145 of p21 in the model. The interactions between the proteins were identified using the Protein Interaction Calculator (PIC) [42]. (f) Complex of p21 and phosphorylated Chk2: the energy-minimized stable structure of Chk2 (magenta) was phosphorylated at Threonine residue at position 68 using Chimera [41] and was docked with the structural model of p21 (cyan) using ClusPro [40]. The NLS region of Chk2 is shown in red and the residues around and in the NLS are labelled. The insert shows the phosphorylation of T68 of Chk2 in the model. The interactions between the proteins were identified using the PIC [42]. (g) Complex of phosphorylated p21 (T145) and phosphorylated Chek2 (T68): individual structural models of p21 phosphorylated at T145 and Chek2 phosphorylated at T68 were docked using ClusPro [40] and rendered using Chimera [41]. The NLS of Chek2 is shown in red and the nuclear export signal (NES) is shown in green. The interaction profile of the p-p21/p-Chk2 complex identified by the PIC [42] shows that no amino acid in the NES region of p21 interacts with p-Chk2, hence showing that the NES is free from any interactions facilitating export of the complex to the cytoplasm.
Figure 7
Figure 7
Interaction between p21 and Chk2 proteins. Cells were treated with 100 μM 5FU for 48 h and the protein–protein interaction of p21-p-Chk2T68 was analyzed by proximity ligation assay (HT29) (red signals indicate the protein–protein interaction between p21 and p-Chk2T68. (a) Fluorescence images of untreated control HT29 cells (40× magnification) and 5FU-treated HT29 cells (40× and 100× magnification) (scale bar: 50 μm); (b) confocal images. (c) 5FU-treated HCT116 cell lysates were prepared and immunoprecipitated with an anti-p-chk2T68 antibody. The resulting immune complexes were then analyzed for p21 by Western Blot using an anti-p21 antibody. (d) Complex of p21 and Chk2 obtained by structural modelling; p21 (cyan) was modelled using two PDB structures 4I58 and 5EOU as templates using MODELLER [39]. Chk2 (magenta) was obtained from its crystal structure 2WTC after removing the coordinates of the inhibitor. The structures were energy-minimized and docked using ClusPro [40] and rendered using Chimera [40]. (e) Complex of phosphorylated p21 and Chek2: the energy-minimized stable structure of p21 (cyan) was phosphorylated at Threonine residue at position 145 using Chimera [41] and was docked with the structural model of Chek2 (magenta) using ClusPro [40]. The nuclear localization signal (NLS) region of Chk2 is shown in red. The insert shows the phosphorylation of T145 of p21 in the model. The interactions between the proteins were identified using the Protein Interaction Calculator (PIC) [42]. (f) Complex of p21 and phosphorylated Chk2: the energy-minimized stable structure of Chk2 (magenta) was phosphorylated at Threonine residue at position 68 using Chimera [41] and was docked with the structural model of p21 (cyan) using ClusPro [40]. The NLS region of Chk2 is shown in red and the residues around and in the NLS are labelled. The insert shows the phosphorylation of T68 of Chk2 in the model. The interactions between the proteins were identified using the PIC [42]. (g) Complex of phosphorylated p21 (T145) and phosphorylated Chek2 (T68): individual structural models of p21 phosphorylated at T145 and Chek2 phosphorylated at T68 were docked using ClusPro [40] and rendered using Chimera [41]. The NLS of Chek2 is shown in red and the nuclear export signal (NES) is shown in green. The interaction profile of the p-p21/p-Chk2 complex identified by the PIC [42] shows that no amino acid in the NES region of p21 interacts with p-Chk2, hence showing that the NES is free from any interactions facilitating export of the complex to the cytoplasm.
Figure 8
Figure 8
Schematic model of p21/Chk2-mediated 5FU resistance. Black stars mark where experimental evidence is given, and orange star marks in silico analysis. The fate of p-Chk2 in the cytoplasm after detachment of the complex is unclear.

Similar articles

Cited by

References

    1. Longley D.B., Harkin D.P., Johnston P.G. 5-fluorouracil: Mechanisms of action and clinical strategies. Nat. Rev. Cancer. 2003;3:330–338. doi: 10.1038/nrc1074. - DOI - PubMed
    1. Efficacy of adjuvant fluorouracil and folinic acid in colon cancer International Multicentre Pooled Analysis of Colon Cancer Trials (IMPACT) investigators. Lancet. 1995;345:939–944. - PubMed
    1. Zhang N., Yin Y., Xu S.J., Chen W.S. 5-Fluorouracil: Mechanisms of resistance and reversal strategies. Molecules. 2008;13:1551–1569. doi: 10.3390/molecules13081551. - DOI - PMC - PubMed
    1. Abbas T., Dutta A. p21 in cancer: Intricate networks and multiple activities. Nat. Rev. Cancer. 2009;9:400–414. doi: 10.1038/nrc2657. - DOI - PMC - PubMed
    1. Zhang S., Hu B., You Y., Yang Z., Liu L., Tang H., Bao W., Guan Y., Shen X. Sorting nexin 10 acts as a tumor suppressor in tumorigenesis and progression of colorectal cancer through regulating chaperone mediated autophagy degradation of p21(Cip1/WAF1) Cancer Lett. 2018;419:116–127. doi: 10.1016/j.canlet.2018.01.045. - DOI - PubMed

LinkOut - more resources