. 2018 Oct 9;9(10):486.
doi: 10.3390/genes9100486.

De Novo Assembly of Two Swedish Genomes Reveals Missing Segments from the Human GRCh38 Reference and Improves Variant Calling of Population-Scale Sequencing Data

Affiliations

De Novo Assembly of Two Swedish Genomes Reveals Missing Segments from the Human GRCh38 Reference and Improves Variant Calling of Population-Scale Sequencing Data

Adam Ameur et al. Genes (Basel). .

Abstract

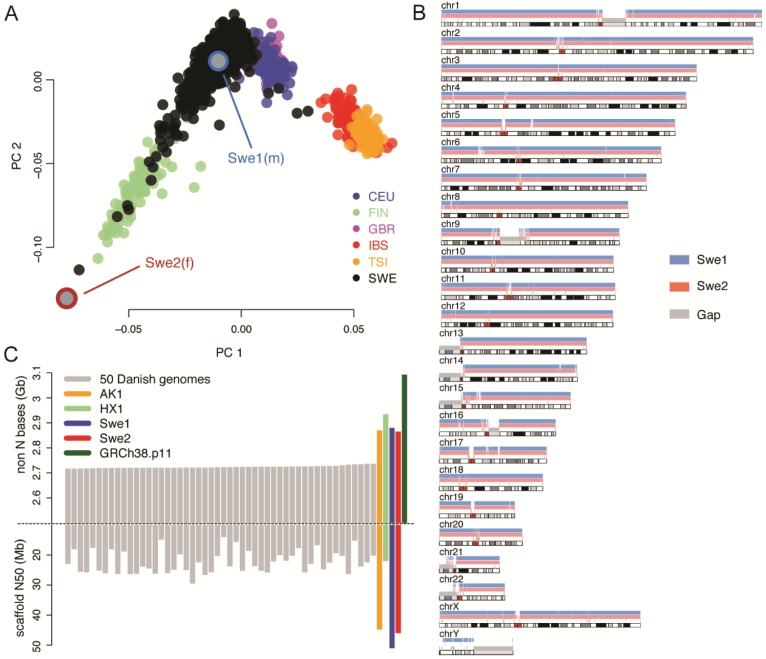
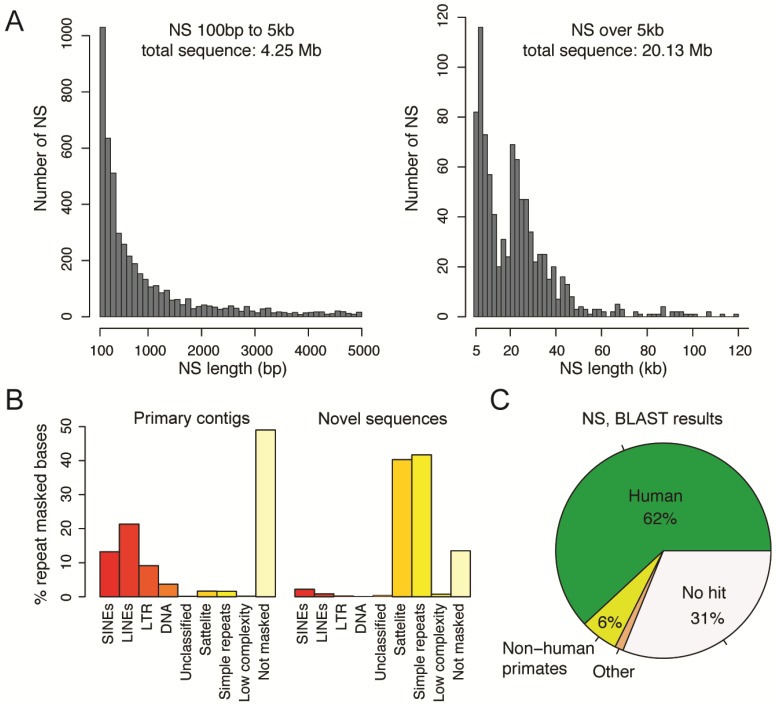
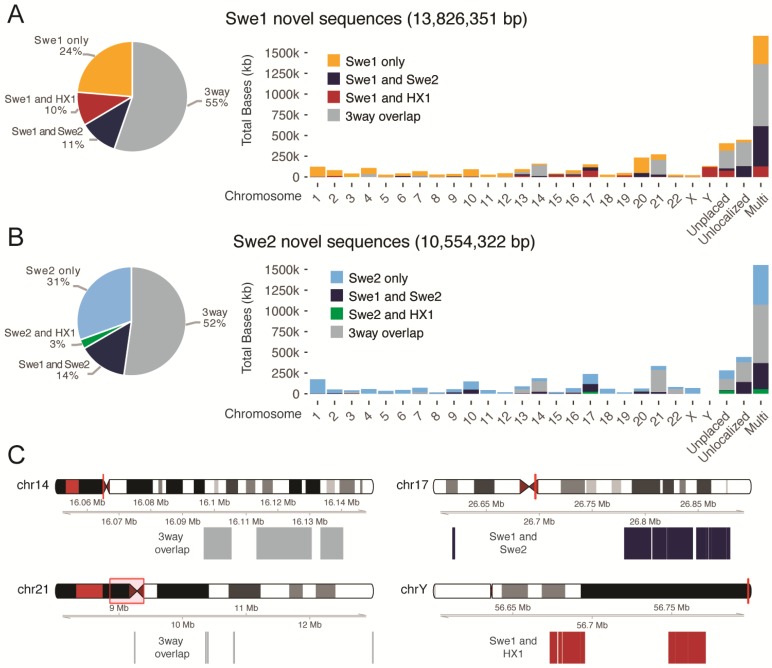
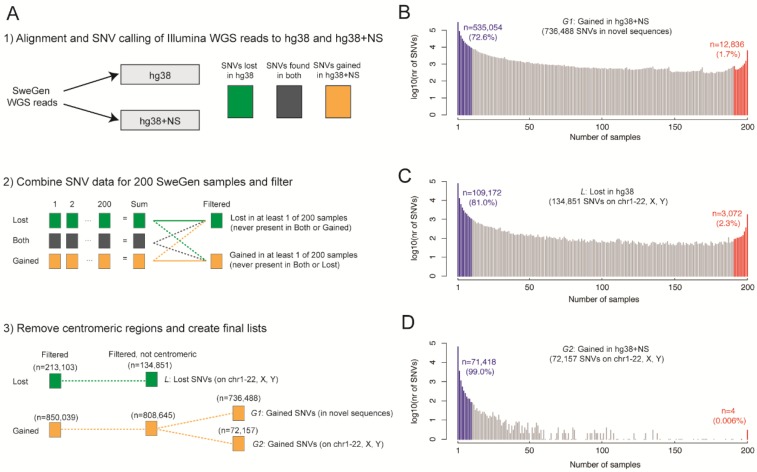
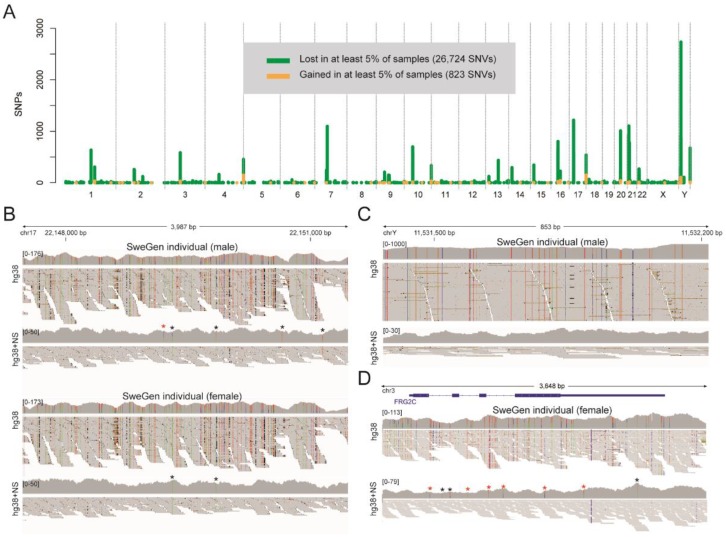
The current human reference sequence (GRCh38) is a foundation for large-scale sequencing projects. However, recent studies have suggested that GRCh38 may be incomplete and give a suboptimal representation of specific population groups. Here, we performed a de novo assembly of two Swedish genomes that revealed over 10 Mb of sequences absent from the human GRCh38 reference in each individual. Around 6 Mb of these novel sequences (NS) are shared with a Chinese personal genome. The NS are highly repetitive, have an elevated GC-content, and are primarily located in centromeric or telomeric regions. Up to 1 Mb of NS can be assigned to chromosome Y, and large segments are also missing from GRCh38 at chromosomes 14, 17, and 21. Inclusion of NS into the GRCh38 reference radically improves the alignment and variant calling from short-read whole-genome sequencing data at several genomic loci. A re-analysis of a Swedish population-scale sequencing project yields > 75,000 putative novel single nucleotide variants (SNVs) and removes > 10,000 false positive SNV calls per individual, some of which are located in protein coding regions. Our results highlight that the GRCh38 reference is not yet complete and demonstrate that personal genome assemblies from local populations can improve the analysis of short-read whole-genome sequencing data.

Keywords: GRCh38; SMRT sequencing; Swedish population; de novo assembly; human reference genome; human whole-genome sequencing; population sequencing.


Conflict of interest statement

The authors declare that they have no competing interests

Figures

Figure 1
Figure 1
Selection of individuals and de novo assembly results. (A) Results of principal component analysis (PCA) of whole genome sequencing (WGS) data from the SweGen project [1], compared to the European 1000 Genomes data [27] (CEU: Utah Residents with Northern and Western Ancestry, FIN: Finnish in Finland, GBR: British in England and Scotland, IBS: Iberian Population in Spain, TSI: Toscani in Italia). The black dots indicate 942 samples from the Swedish Twin Registry (STR), which were sequenced within the SweGen project and represent a cross-section of the Swedish population. Swe1 and Swe2 are the individuals selected for de novo sequencing. (B) Alignment of contigs for Swe1 (blue) and Swe2 (red) to the human GRCh38 reference. A total of 6812 contigs could be aligned for Swe1 and 6924 for Swe2. Only the male Swe1 sample has extensive coverage of the Y chromosome. (C) The bars show the total number of non-N bases (top) and scaffold N50 values (bottom) for Swe1, Swe2, and a selection of other human de novo assemblies. The grey bars represent the top 50 genomes with the highest number of non-N bases from an Illumina mate-pair assembly of 150 individuals [10]. The Korean (AK1) and Chinese (HX1) genomes were assembled by a combination of single-molecule real-time (SMRT) sequencing and optical mapping. Scaffold N50 is not shown for GRCh38 (in green) since it is much higher than for the personal genomes and difficult to fit into the same plot.
Figure 2
Figure 2
Characterization of novel sequences (NS) found in Swe1 and Swe2. (A) The histograms show the length distribution of all NS found in Swe1 and Swe2. Shorter NS are displayed in the left panel (100 bp to 5 kb), and longer NS are shown in the right panel (>5 kb). The longer NS comprise the majority of the NS in Swe1 and Swe2. (B) Results of repeat masking in primary contigs (left) and NS (right). Within the primary contigs, 51% of the bases are found to be repetitive using the repeat masker software, while 86% of the bases are repetitive within the NS. Satellite and simple repeats make up 82% of the bases in the NS. (C) Results of matching the 5645 NS in Swe1 and Swe2 to the NCBI database using BLAST [23]. Each piece of the pie chart represents the number of NS that were assigned to a particular species as the top hit. The No hit category (in white) contains NS where no E-value reached 10−50 or lower. A total of 72 of the NS are in the Other category, which includes matches to a number of parasitic worms (both for Swe1 and Swe2) and a complete human papilloma virus 35 (HPV35) genome (only for Swe2).
Figure 3
Figure 3
Anchoring of Swe1 and Swe2 NS to the hg38 reference. (A) The pie chart to the left shows the proportion of Swe1 NS (in total 13.8 Mb) that are also found in Swe2 or in the Chinese HX1. The category 3way (grey) represents NS that are found in all three individuals. The bars to the right show the amount of NS that can be anchored to the hg38 genome. The category unplaced represents sequences in hg38 that are not associated with any chromosome, and unlocalized corresponds to sequences that are associated with a specific chromosome but have not been assigned an orientation and position. The multi category furthest to the right represents NS that are mapping to multiple chromosomes. (B) Similar results for NS detected in Swe2. (C) Examples of chromosomal regions where a high amount of NS are detected. The two plots to the left show the localization of 3way overlap sequences (i.e., found in Swe1, Swe2, and HX1) near the centromeric regions of chr14 and chr21. The top right panel displays a region on chr17 where an excess of NS found only in Swe1 and Swe2 could be anchored. The bottom left panel shows NS detected only in the two males (Swe1 and HX1) that could be anchored to regions close to the telomere of chromosome Y.
Figure 4
Figure 4
Re-analysis of Illumina WGS data using a Swedish human reference. (A) Overview of our method to evaluate the effect of NS on SNV calls from Swedish Illumina WGS data. In the first step, reads from 200 SweGen samples [1] were aligned both to hg38 and to an extended reference (hg38+NS), where 17.3 Mb of NS detected in Swe1 and Swe2 were appended to hg38. In step 2, single nucleotide variants (SNVs) for each of the samples were sorted into three groups: (i) SNVs found only in hg38, but not in hg38+NS (named Lost, in green); (ii) SNVs found both in hg38 and hg38+NS (‘Both’, in grey); and (iii) SNVs found only in hg38+NS, but not in hg38 (Gained, in orange). After such SNV tables were generated for all 200 individuals, a summary file was created for the Lost and Gained group. The Lost SNVs were not allowed to be detected in any of the Gained or Both files. A similar filtering was also performed for the Gained group. In step 3, we further filtered the SNV lists by removing all centromeric regions (from file centromeres_UCSC_hg38.txt). The resulting Gained SNVs were separated into two distinct groups, those present in hg38 chromosomes (chr1-22, X or Y) and those present in the NS. (B) Frequency distribution of the 736,488 SNVs that were gained in the NS. The x-axis shows the not peer-reviewed is the author/funder. It is made available under a CC-BY 4.0 International license. bioRxiv preprint first posted online on 18 February 2018; doi:http://dx.doi.org/10.1101/267062. The copyright holder for this preprint (which was 21 SweGen samples (out of 200) and the y-axis show the number of gained SNVs for each number of samples on a log10-scale. Most of the gained SNVs are detected only in a few samples. The blue and red areas show the number of SNVs that are gained in at most 5% and at least 95% of samples, respectively. (C) Frequency distribution of the SNVs that were lost in hg38 when adding NS to the hg38 reference. (D) Frequency distribution of the gained SNVs on chromosomes 1-22, X, or Y (i.e., not in NS) when adding NS to the hg38 reference.
Figure 5
Figure 5
A novel reference gives improved alignment and SNV calling of SweGen WGS data. (A) Genomic distribution of SNVs that are lost (green) and gained (orange) when NS are appended to the hg38 reference. Only non-centromeric SNVs that are lost/gained in at least 5% of the 200 SweGen samples are shown in this figure. (B) An IGV [31] view of Illumina reads for two representative SweGen samples at a region on chr17, where some SNVs are lost and others are gained when using the hg38+NS reference. Illumina data is shown for a male and a female (not the same individuals as Swe1 and Swe2). Both for the male and female, the coverage decreases over the region when NS are appended to hg38, and about 100 (homozygous) false positive SNV calls are lost in each of the samples. Only five heterozygous SNVs where found for the male individual when the novel reference was used, and two homozyogous SNVs for the female (marked by asterisks ‘*’). A red asterisk indicates a gained SNV that is not detected in hg38. (C) An example region on chrY where the coverage was reduced from almost 1000× to below 30× when using hg38+NS, and where a large number of SNVs were lost. Only data for the male individual is shown in this panel. (D) Improved alignment and SNV calling over the FRG2C locus on chromosome 3. A large number of SNVs were lost, and six SNVs were gained (red asterisks ‘*’), in the female SweGen sample. Some of the lost and gained SNVs are located in the coding sequences of FRG2C.

References

    1. Ameur A., Dahlberg J., Olason P., Vezzi F., Karlsson R., Martin M., Viklund J., Kahari A.K., Lundin P., Che H., et al. SweGen: A whole-genome data resource of genetic variability in a cross-section of the Swedish population. Eur. J. Hum. Genet. 2017;25:1253–1260. doi: 10.1038/ejhg.2017.130. - DOI - PMC - PubMed
    1. Boomsma D.I., Wijmenga C., Slagboom E.P., Swertz M.A., Karssen L.C., Abdellaoui A., Ye K., Guryev V., Vermaat M., van Dijk F., et al. The Genome of the Netherlands: Design, and project goals. Eur. J. Hum. Genet. 2014;22:221–227. doi: 10.1038/ejhg.2013.118. - DOI - PMC - PubMed
    1. Fakhro K.A., Staudt M.R., Ramstetter M.D., Robay A., Malek J.A., Badii R., Al-Marri A.A., Abi Khalil C., Al-Shakaki A., Chidiac O., et al. The Qatar genome: A population-specific tool for precision medicine in the Middle East. Hum. Genome Var. 2016;3:16016. doi: 10.1038/hgv.2016.16. - DOI - PMC - PubMed
    1. Gudbjartsson D.F., Helgason H., Gudjonsson S.A., Zink F., Oddson A., Gylfason A., Besenbacher S., Magnusson G., Halldorsson B.V., Hjartarson E., et al. Large-scale whole-genome sequencing of the Icelandic population. Nat. Genet. 2015;47:435–444. doi: 10.1038/ng.3247. - DOI - PubMed
    1. Nakatsuka N., Moorjani P., Rai N., Sarkar B., Tandon A., Patterson N., Bhavani G.S., Girisha K.M., Mustak M.S., Srinivasan S., et al. The promise of discovering population-specific disease-associated genes in South Asia. Nat. Genet. 2017;49:1403. doi: 10.1038/ng.3917. - DOI - PMC - PubMed

LinkOut - more resources