. 2018 Nov 9;145(21):dev163105.
doi: 10.1242/dev.163105.

Lats1/2 inactivation reveals Hippo function in alveolar type I cell differentiation during lung transition to air breathing

Affiliations

Lats1/2 inactivation reveals Hippo function in alveolar type I cell differentiation during lung transition to air breathing

Leah B Nantie et al. Development. .

Abstract

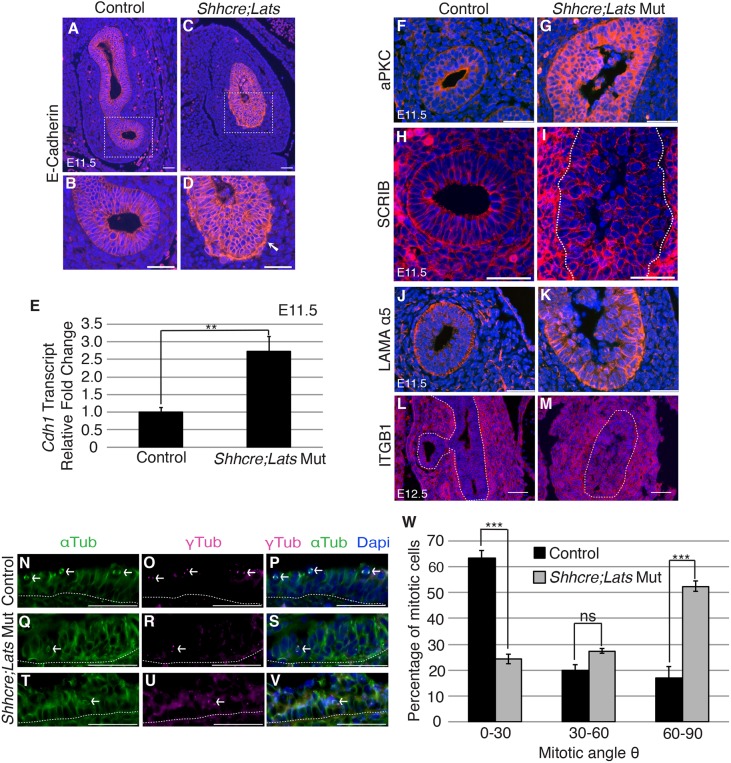
Lung growth to its optimal size at birth is driven by reiterative airway branching followed by differentiation and expansion of alveolar cell types. How this elaborate growth is coordinated with the constraint of the chest is poorly understood. Here, we investigate the role of Hippo signaling, a cardinal pathway in organ size control, in mouse lung development. Unexpectedly, we found that epithelial loss of the Hippo kinase genes Lats1 and Lats2 (Lats1/2) leads to a striking reduction of lung size owing to an early arrest of branching morphogenesis. This growth defect is accompanied by abnormalities in epithelial cell polarity, cell division plane and extracellular matrix deposition, as well as precocious and increased expression of markers for type 1 alveolar epithelial cells (AEC1s), an indicator of terminal differentiation. Increased AEC1s were also observed in transgenic mice with overexpression of a constitutive nuclear form of downstream transcriptional effector YAP. Conversely, loss of Yap and Taz led to decreased AEC1s, demonstrating that the canonical Hippo signaling pathway is both sufficient and necessary to drive AEC1 fate. These findings together reveal unique roles of Hippo-LATS-YAP signaling in the developing mouse lung.

Keywords: Alveolar; Branching; Development; Hippo; Lung; Mouse; Polarity.


Conflict of interest statement

Competing interestsThe authors declare no competing or financial interests.

Figures

Fig. 1.
Fig. 1.
Shhcre;Lats mutants displayed impaired branching morphogenesis. (A) Whole lungs of control and Shhcre;Lats mutant mice at E18.5. (B,C) Immunofluorescent detection of p-YAP (red) in control and Shhcre;Lats mutant lungs at E11.5, showing near absence of signal in the mutant epithelium. (D,E) Immunofluorescent detection of YAP (magenta) in control and Shhcre;Lats mutant lungs at E11.5, showing intense nuclear staining in the mutant epithelium. Blue, DAPI (B-E). (F-H) E-cadherin whole-mount immunohistochemistry outline of the epithelium in E10.5-E12.5 control and Shhcre;Lats mutant lungs showing the lack of branching in mutant lungs. (I-N) Hematoxylin and Eosin staining of sagittal sections of E10.5-E12.5 control and Shhcre;Lats mutant lungs, showing thickened epithelium at all stages. Dashed lines outline the epithelium. Scale bars: 50 μm (B-E,I-N); 1 mm (A,F-H).
Fig. 2.
Fig. 2.
Shhcre;Lats mutants showed defective proximal-distal patterning markers at E11.5. (A,B,D,E) Immunofluorescent detection of SOX2 (magenta) and SOX9 (green) in control and Shhcre;Lats mutant lungs at E11.5 (A,B) and E12.5 (D,E) showing disrupted expression of these proximal-distal markers compared with control. Blue, DAPI. (C) Quantification of relative mRNA levels of Sox2 and Sox9 in Shhcre;Lats mutant lungs at E11.5. Data are presented as mean±s.e.m. *P<0.05 (Student's t-test). ns, not significant. (F-I) Whole-mount RNA in situ hybridization showing reduction of Bmp4 expression in the distal epithelium, and expansion of Fgf10 expression in the mesenchyme of Shhcre;Lats mutant lungs compared with controls. Dotted lines outline the epithelium. Scale bars: 50 μm (A,B,D-G); 100 μm (H,I).
Fig. 3.
Fig. 3.
Shhcre;Lats mutants showed impaired apical basal polarity and mitotic spindle angle. (A-D) Immunofluorescent detection of E-cadherin (red, arrow) in control and Shhcre;Lats mutant lungs at E11.5. Lower panels show magnifications of the boxed areas in the upper panels. E-cadherin signal is increased and less apically biased in the mutant. Arrow indicates the basal epithelium. (E) qRT-PCR quantification of relative levels of Cdh1 mRNA in control and Shhcre;Lats mutant lungs at E11.5. (F,G) Immunofluorescent detection of aPKC (red) in control and Shhcre;Lats mutant lungs at E11.5, showing loss of apical bias and expansion of signal in the mutant epithelium. (H,I) Immunofluorescent detection of SCRIB (red) in control and Shhcre;Lats mutant lungs at E11.5, showing loss of lateral/basal bias of signal in the mutant epithelium. Dotted line outlines epithelium. (J,K) Immunofluorescent detection of LAMAα5 (red) in control and Shhcre;Lats mutant lungs at E11.5, showing loss of basal restriction of signal in the mutant. (L,M) Immunofluorescent detection of ITGB1 (red) at E12.5, showing similar expression in control and Shhcre;Lats mutant lungs. (N-V) Immunofluorescent detection of centrosomes (γTub, magenta) and microtubules (αTub, green) in control and Shhcre;Lats mutant lungs at E11.5. Arrows indicate mitotic spindles. (W) Quantification of mitotic spindle angle θ, the mitotic spindle angle relative to the basement membrane in control and Shhcre;Lats mutant lungs at E11.5. Data are presented as mean±s.e.m. **P<0.005, ***P<0.001 (Student's t-test). ns, not significant. Scale bars: 50 μm (A-D,F-K,N-V); 100 μm (L,M). Dotted lines outline epithelium. Blue, DAPI.
Fig. 4.
Fig. 4.
Shhcre;Lats mutants showed increased expression of AEC1 markers. (A,B) Hematoxylin and Eosin staining of control and Shhcre;Lats mutant lungs at E18.5. The mutant image is centered on the left lobe, as are mutant images in the rest of the figure. (C,D) Immunofluorescent detection of SCGB1A1 (green) and FOXJ1 (red) in control and Shhcre;Lats mutant lungs at E18.5, showing loss of signal in the mutant. (E,F) Immunofluorescent detection of pro-SPC (red) in control and Shhcre;Lats mutant lungs at E18.5, showing loss of signal in the mutant. (G,H) Immunofluorescent detection of HOPX (red) in control and Shhcre;Lats mutant lungs at E18.5 at the same exposure time, showing drastically increased HOPX signal in the mutant. (I-N) Immunofluorescent detection of P63 (magenta) and KRT5 (green) in control and Shhcre;Lats mutant lungs at E18.5. Insets in I-K show P63 and KRT5 expression in the control trachea. When imaged and adjusted using the same parameters, the ectopic P63 and KRT5 signals in the mutant lung appear less intense compared with the trachea signal in the control. (O-T) Immunofluorescent detection of P63 (magenta) and HOPX (green) in control and Shhcre;Lats mutant lungs at E18.5. Arrows indicate P63+HOPX+ cells, with low HOPX signal compared with surrounding P63HOPX+ cells. (U,V) Immunofluorescent detection of PDPN (green) and HOPX (magenta) in control and Shhcre;Lats mutant lungs at E11.5, showing increased signals of both in the mutant epithelium. (W) qRT-PCR quantification of relative mRNA levels of AEC1 markers Pdpn, Ager and Hopx in control and Shhcre;Lats mutant lungs at E11.5. Data are presented as mean±s.e.m. *P<0.05 (Student's t-test). (X,Y) Immunofluorescent detection of PDPN (green) and HOPX (magenta) in control and Shhcre;Lats mutant lungs at E10.5, showing precocious expression of HOPX. Blue, DAPI. Scale bars: 50 μm.
Fig. 5.
Fig. 5.
Sftpc-rtTA;tetO-YAPS127A mutants showed increased AEC1s and decreased AEC2s. (A-F) Immunofluorescent detection of HOPX (green) and YAP (magenta) in control and Sftpc-rtTA;tetO-YAPS127A transgenic lungs at P0, showing that the majority of YAP+ cells are also HOPX+. All images were taken at the same exposure. Nuclear YAP signal is more intense in the transgenic than in the control. (G) Quantification of the percentage of HOPX+ cells out of total cells in control and Sftpc-rtTA;tetO-YAPS127A transgenic lungs at P0. (H-M) Immunofluorescent detection of YAP (magenta) and pro-SPC (green) in control and Sftpc-rtTA;tetO-YAPS127A mutant lungs at P0, showing that very few (arrows) YAP+ cells remain SPC+. Arrows indicate a double-labeled cell. (N) Quantification of the percentage of pro-SPC+ cells out of total cells in control and Sftpc-rtTA;tetO-YAPS127A mutant lungs at P0. (O) Quantification of the percentage of cells with strong nuclear YAP and either HOPX or pro-SPC in Sftpc-rtTA;tetO-YAPS127A mutant lungs at P0. Data are presented as mean±s.e.m. ***P<0.001 (Student's t-test). Blue, DAPI. Scale bars: 50 μm.
Fig. 6.
Fig. 6.
Sftpc-rtTA;tetO-cre;Yapflox/flox;Tazflox/flox mutants show decreased AEC1s. (A,B) Immunofluorescent detection of HOPX (green) in control and Sftpc-rtTA;tetO-cre;Yapflox/flox;Tazflox/flox mutant lungs at E17.5 showing a drastic reduction of HOPX+ cells. (C) Quantification of the percentage of HOPX+ cells in control and Sftpc-rtTA;tetO-cre;Yapflox/flox;Tazflox/flox mutant lungs out of total cell number at E17.5. (D,E) Immunofluorescent detection of pro-SPC (red) in control and Sftpc-rtTA;tetO-cre;Yapflox/flox;Tazflox/flox mutant lungs at E17.5, showing presence of SPC+ cells in the mutant. (F) Quantification of the percentage of pro-SPC+ cells in control and Sftpc-rtTA;tetO-cre;Yapflox/flox;Tazflox/flox mutant lungs out of total cell number at E17.5. Data are presented as mean±s.e.m. ***P<0.001 (Student's t-test). ns, not significant. Blue, DAPI. Scale bars: 50 μm.

References

    1. Abler L. L., Mehta V., Keil K. P., Joshi P. S., Flucus C. L., Hardin H. A., Schmitz C. T. and Vezina C. M. (2011). A high throughput in situ hybridization method to characterize mRNA expression patterns in the fetal mouse lower urogenital tract. J. Vis. Exp. 2912 10.3791/2912 - DOI - PMC - PubMed
    1. Aragona M., Panciera T., Manfrin A., Giulitti S., Michielin F., Elvassore N., Dupont S. and Piccolo S. (2013). A mechanical checkpoint controls multicellular growth through YAP/TAZ regulation by actin-processing factors. Cell 154, 1047-1059. 10.1016/j.cell.2013.07.042 - DOI - PubMed
    1. Boussadia O., Kutsch S., Hierholzer A., Delmas V. and Kemler R. (2002). E-cadherin is a survival factor for the lactating mouse mammary gland. Mech. Dev. 115, 53-62. 10.1016/S0925-4773(02)00090-4 - DOI - PubMed
    1. Camargo F. D., Gokhale S., Johnnidis J. B., Fu D., Bell G. W., Jaenisch R. and Brummelkamp T. R. (2007). YAP1 increases organ size and expands undifferentiated progenitor cells. Curr. Biol. 17, 2054-2060. 10.1016/j.cub.2007.10.039 - DOI - PubMed
    1. Chan S. W., Lim C. J., Guo F., Tan I., Leung T. and Hong W. (2013). Actin-binding and cell proliferation activities of angiomotin family members are regulated by Hippo pathway-mediated phosphorylation. J. Biol. Chem. 288, 37296-37307. 10.1074/jbc.M113.527598 - DOI - PMC - PubMed

Publication types

MeSH terms