. 2018 Oct 25;145(20):dev167197.
doi: 10.1242/dev.167197.

Prepubertal skeletal muscle growth requires Pax7-expressing satellite cell-derived myonuclear contribution

Affiliations

Prepubertal skeletal muscle growth requires Pax7-expressing satellite cell-derived myonuclear contribution

John F Bachman et al. Development. .

Abstract

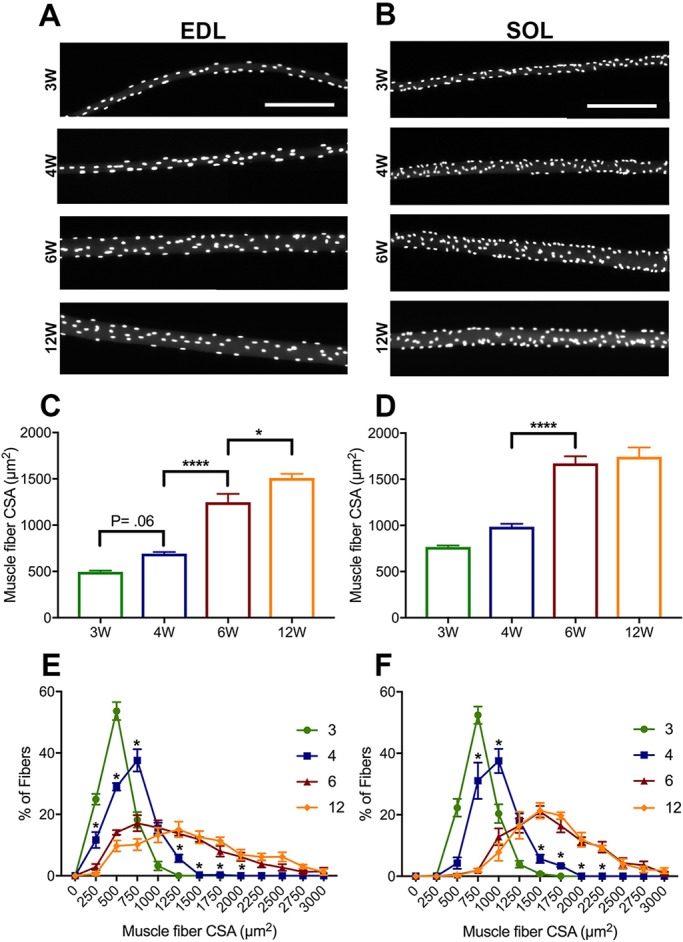
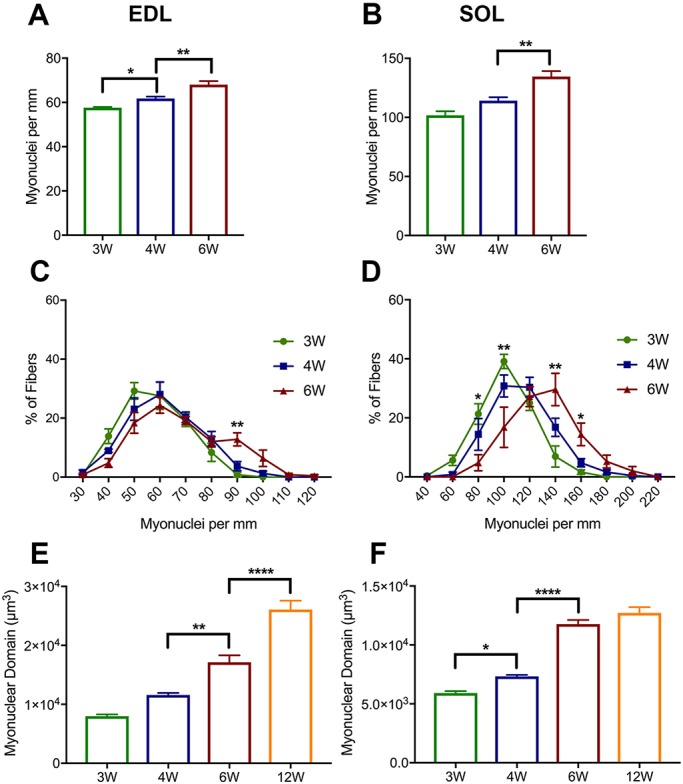
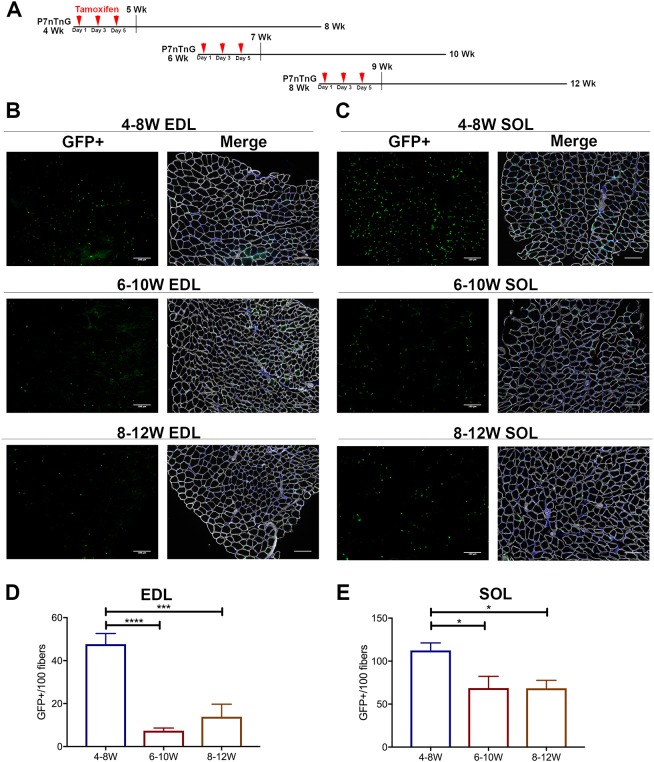
The functional role of Pax7-expressing satellite cells (SCs) in postnatal skeletal muscle development beyond weaning remains obscure. Therefore, the relevance of SCs during prepubertal growth, a period after weaning but prior to the onset of puberty, has not been examined. Here, we have characterized mouse skeletal muscle growth during prepuberty and found significant increases in myofiber cross-sectional area that correlated with SC-derived myonuclear number. Remarkably, genome-wide RNA-sequencing analysis established that post-weaning juvenile and early adolescent skeletal muscle have markedly different gene expression signatures. These distinctions are consistent with extensive skeletal muscle maturation during this essential, albeit brief, developmental phase. Indelible labeling of SCs with Pax7CreERT2/+ ; Rosa26nTnG/+ mice demonstrated SC-derived myonuclear contribution during prepuberty, with a substantial reduction at puberty onset. Prepubertal depletion of SCs in Pax7CreERT2/+ ; Rosa26DTA/+ mice reduced myofiber size and myonuclear number, and caused force generation deficits to a similar extent in both fast and slow-contracting muscles. Collectively, these data demonstrate SC-derived myonuclear accretion as a cellular mechanism that contributes to prepubertal hypertrophic skeletal muscle growth.

Keywords: Aging; Extracellular matrix; Hypertrophy; Mouse; Musculoskeletal; Pediatric; Postnatal growth; Regeneration; Stem cell.


Conflict of interest statement

Competing interestsThe authors declare no competing or financial interests.

Figures

Fig. 1.
Fig. 1.
Myofibers increase in size during prepubertal growth, with an adult-like population established at 6 weeks. (A,B) Representative images of EDL (A) and SOL (B) 3-, 4-, 6- and 12-week of age myofibers. Scale bars: 200 μm. (C,D) Bar graphs comparing the CSA of EDL (C) and SOL (D) 3-, 4-, 6- and 12-week myofibers. n=5 mice per group. *P<0.05, ****P<0.0001 (one-way ANOVA with Tukey's test). (E,F) Frequency distribution of myofiber CSA in EDL (E) and SOL (F). Two-way ANOVA with Tukey's test. *P<0.05 (significance between 4 and 6 weeks). Statistical comparisons are provided in Table S1.
Fig. 2.
Fig. 2.
Myonuclear number and domain increase during prepuberty. (A,B) Bar graphs of myonuclear content in EDL (A) and SOL (B) at 3-, 4- and 6-week time points. n=5 mice per group. *P<0.05, **P<0.01 (one-way ANOVA with Tukey's test). (C,D) Frequency distribution of myonuclear content in EDL (C) and SOL (D) at 3-, 4- and 6-week time points. n=5 mice. Two-way ANOVA, Tukey. *P<0.05, **P<0.01 (significance between 4 and 6 weeks). Statistical comparisons are provided in Table S1. (E,F) Myonuclear domain in EDL (E) and SOL (F) at 3-, 4-, 6- and 12-week time points. n=5 mice per group. *P<0.05, **P<0.01, ****P<0.0001 (one-way ANOVA with Tukey's test).
Fig. 3.
Fig. 3.
Myonuclear content is correlated with larger fiber CSA during prepubertal growth. (A,B) Linear regression analysis displaying correlation between CSA and myonuclear content at 4 weeks in EDL (A) and SOL (B). Each circle represents one myofiber. n=5 mice. EDL, 246 myofibers; SOL, 250 myofibers. (C,D) Linear regression analysis displaying correlation between CSA and myonuclear content at 6 weeks in EDL (C) and SOL (D). Each circle represents one myofiber. n=5 mice. EDL, 250 myofibers; SOL, 250 myofibers. (E,F) Overlay of 3-week, 4-week and 6-week slopes for EDL (E) and SOL (F).
Fig. 4.
Fig. 4.
RNAseq reveals substantial gene expression changes between 4 and 6 postnatal weeks. (A) Heat map displaying significantly differentially expressed (DE) genes (FDR<0.05) from RNAseq of 4-, 6- and 8-week gastrocnemius muscles. n=2-3 mice per group. 1093 DE genes (6 weeks versus 4 weeks). Upregulated genes are shown in red and downregulated genes in blue. (B-D) Heat map displaying 6- versus 4-week DE genes related to the extracellular matrix (GO: 0044420) (B), AMPK signaling (IPA: AMPK-signaling pathway) (C) and calcium signaling (IPA: calcium-signaling pathway) (D). Individual genes are provided in Fig. S4A and Table S2. (E) RT-qPCR of RNAseq targets from 4-, 6- and 8-week EDL, SOL and gastrocnemius (GAST) muscles. mRNA level is shown relative to 4 weeks and normalized to Gapdh. n=3-5 mice per group. *P<0.05, ****P<0.0001 (one-way ANOVA with Bonferroni correction).
Fig. 5.
Fig. 5.
Examination of SC pool size between prepuberty and young adulthood. (A,B) Representative cross-sections of 4-, 6- and 12-week EDL (A) and SOL (B) muscles stained with Pax7 (red) and laminin (white) antibodies and DAPI (blue). Arrows indicate SCs. Scale bars: 100 μm. (C,D) Quantification of Pax7+ SC number (per 100 fibers) in 3-, 4-, 6-, 8- and 12-week EDL (C) and SOL (D) muscles. n=3-5 mice per group. Three sections, with three to six fields of view (20×), were averaged per mouse. *P<0.05, ***P<0.001 (one-way ANOVA with Tukey's test).
Fig. 6.
Fig. 6.
SCs contribute to EDL and SOL muscles during prepubertal growth. (A) Scheme representing tamoxifen administration at 4, 6 or 8 weeks with tissue harvest at 8, 10 or 12 weeks, respectively. (B,C) Representative cross-sections of 4-8, 6-10 and 8-12 week EDL (B) and SOL (C) muscles following tamoxifen injection (at 4, 6 or 8 weeks) to label SCs and derived myonuclei. Sectioned are stained with GFP (green), DAPI (blue) and laminin antibody (white). Scale bars: 100 μm. (D,E) Quantification of GFP+ myonuclei (per 100 fibers) in 4-8, 6-10 and 8-12 week EDL (D) and SOL (E) cross-sections. n=3-8 mice per group. *P<0.05, ***P<0.001, ****P<0.0001 (one-way ANOVA with Tukey's test).
Fig. 7.
Fig. 7.
Prepubertal SC ablation leads to similar declines in myofiber hypertrophic growth and myonuclear number. (A) Illustration of P7DTA scheme: tamoxifen was administered at 4 weeks and tissue harvested at 8 weeks. (B,C) Representative images of control (Ctl) and P7DTA EDL (B) and SOL (C) myofibers. Scale bars: 200 μm. (D,E) Frequency distribution of myofiber CSA of Ctl and P7DTA EDL (D) and SOL (E) myofibers. n=9-10 mice per group for EDL and 6-7 per group for SOL. *P<0.05, **P<0.01, ***P<0.001, ****P<0.0001 (two-way ANOVA with Fisher's LSD test). (F,G) Frequency distribution of myonuclear number (MN/mm) of Ctl and P7DTA EDL (F) and SOL (G) myofibers. n=7 mice per group for EDL and 6-7 per group for SOL. *P<0.05, ***P<0.001, ****P<0.0001 (two-way ANOVA with Fisher's LSD test).
Fig. 8.
Fig. 8.
Minimal fiber-type changes with prepubertal SC ablation. (A,B) Representative images of control (Ctl) and P7DTA EDL (A) and SOL (B) fiber-type immunostaining. MYHC type IIB fibers, green; IIX, black; IIA, red; I, blue; laminin, white. Scale bars: 100 μm. (C,D) Quantification of fiber-type percentages for Ctl and P7DTA EDL (C) and SOL (D). n=5-7 mice per group for EDL and 3-4 per group for SOL. *P<0.05 (one-way ANOVA with Fisher's LSD test).
Fig. 9.
Fig. 9.
Force generation deficits following prepubertal SC ablation. (A) Illustration of 4W-P7DTA scheme: tamoxifen was injected at 4 weeks and tissue harvested at 8 weeks. (B,C) Absolute force values generated by EDL (B) and SOL (C) control (Ctl) and 4W-P7DTA mice. n=3-4 mice per group. *P<0.05 (Fisher's LSD test). (D) Illustration of 6W-P7DTA scheme: tamoxifen was injected at 6 weeks and tissue harvested at 10 weeks. (E,F) Absolute force values generated by EDL (E) and SOL (F) Ctl and 6W-P7DTA mice. n=5-7 mice per group.

References

    1. Agbulut O., Noirez P., Beaumont F. and Butler-Browne G. (2003). Myosin heavy chain isoforms in postnatal muscle development of mice. Biol. Cell 95, 399-406. 10.1016/S0248-4900(03)00087-X - DOI - PubMed
    1. Allen D. L., Roy R. R. and Edgerton V. R. (1999). Myonuclear domains in muscle adaptation and disease. Muscle Nerve 22, 1350-1360. - PubMed
    1. Aravamudan B., Mantilla C. B., Zhan W. Z. and Sieck G. C. (2006). Denervation effects on myonuclear domain size of rat diaphragm fibers. J. Appl. Physiol. 100, 1617-1622. 10.1152/japplphysiol.01277.2005 - DOI - PubMed
    1. Bjornson C. R., Cheung T. H., Liu L., Tripathi P. V., Steeper K. M. and Rando T. A. (2012). Notch signaling is necessary to maintain quiescence in adult muscle stem cells. Stem Cells 30, 232-242. 10.1002/stem.773 - DOI - PMC - PubMed
    1. Brack A. S., Bildsoe H. and Hughes S. M. (2005). Evidence that satellite cell decrement contributes to preferential decline in nuclear number from large fibres during murine age-related muscle atrophy. J. Cell Sci. 118, 4813-4821. 10.1242/jcs.02602 - DOI - PubMed

Publication types

Substances