. 2018 Oct 10;15(147):20180249.
doi: 10.1098/rsif.2018.0249.

Modularity speeds up motor learning by overcoming mechanical bias in musculoskeletal geometry

Affiliations

Modularity speeds up motor learning by overcoming mechanical bias in musculoskeletal geometry

Shota Hagio et al. J R Soc Interface. .

Abstract

We can easily learn and perform a variety of movements that fundamentally require complex neuromuscular control. Many empirical findings have demonstrated that a wide range of complex muscle activation patterns could be well captured by the combination of a few functional modules, the so-called muscle synergies. Modularity represented by muscle synergies would simplify the control of a redundant neuromuscular system. However, how the reduction of neuromuscular redundancy through a modular controller contributes to sensorimotor learning remains unclear. To clarify such roles, we constructed a simple neural network model of the motor control system that included three intermediate layers representing neurons in the primary motor cortex, spinal interneurons organized into modules and motoneurons controlling upper-arm muscles. After a model learning period to generate the desired shoulder and/or elbow joint torques, we compared the adaptation to a novel rotational perturbation between modular and non-modular models. A series of simulations demonstrated that the modules reduced the effect of the bias in the distribution of muscle pulling directions, as well as in the distribution of torques associated with individual cortical neurons, which led to a more rapid adaptation to multi-directional force generation. These results suggest that modularity is crucial not only for reducing musculoskeletal redundancy but also for overcoming mechanical bias due to the musculoskeletal geometry allowing for faster adaptation to certain external environments.

Keywords: muscle synergies; musculoskeletal system; neural network model; primary motor cortex; upper-limb muscles.


Conflict of interest statement

The authors declare no competing interests.

Figures

Figure 1.
Figure 1.
Scheme of neural network models. (a) A neural network model including three intermediate layers, i.e. 1000 neurons in the primary motor cortex (M1), modules and 18 motor neuron pools controlling each muscle (modular model). The first intermediate layer was connected to the input layer, which represented a desired torque (τ) with a synaptic weight (Winp). The neuron activation (aneu) was then distributed to a synergy layer with a weight Wneu. The activation of each module (amod > 0) was transmitted to a muscle layer with a synaptic weight Wmod (>0). Finally, the output torque (T) was exerted by the combination of the mechanical-pulling direction vector of a muscle (M) scaled with muscle activation (amus > 0). The weights Winp and Wmod were updated to minimize the error between the input torque and output torque using a back-propagation algorithm. (b) Twelve target torques were uniformly distributed on the elbow and shoulder joint torque plane with 30° increments. The amplitudes of the torques were equal, which was set to 1 Nm. The flexion toque was defined as positive on the torque plane. Flex, flexion. Ext, extension. (c) MDs of the representative muscles; subscapularis (green), biceps brachii short head (BicShort; cyan), biceps brachii long head (BicLong; red), brachialis (Brac; purple), deltoid posterior (DeltP; blue), triceps brachii long head (TriLong; grey) and triceps brachii lateral head (TriLat; yellow). The direction in the polar coordinates corresponds to those in (b). (d) A neural network model including two intermediate layers, i.e. 1000 neurons in M1 and 18 motor neuron pools controlling each muscle (non-modular model). This model corresponds to the previously constructed model [18].
Figure 2.
Figure 2.
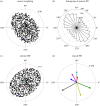
Network state of neurons and muscles after learning. (a) Synaptic weights of each M1 neuron from input torques for shoulder and elbow joints are shown as dots on the torque plane. The weightings were bimodally distributed. (b) Polar histograms of the preferred direction (PD) of neurons for 30 sets of iterations. (c) Mechanical-pulling direction vectors (MD) of M1 neurons on the torque plane. The neuron MDs were distributed bimodally and approximately perpendicular to the bimodal axis of neuron weightings. The coloured dots (blue, red and green) in (a,c) represent the same neurons. (d) Averaged PDs of the representative muscles for 30 sets of iterations. The colours correspond to those in figure 1c. The direction in the all polar coordinates corresponds to those in figure 1b. The model is based on four modules was used.
Figure 3.
Figure 3.
Neural state of modules after learning. (a) Muscle-weighting vectors across modules (W1–4). The coloured bars represent mono-articular shoulder flexors (brown), bi-articular flexors (orange), mono-articular elbow flexors (yellow), mono-articular shoulder extensors (dark green), bi-articular extensor (blue-green) and mono-articular elbow extensors (purple). Muscle names are indicated by the following abbreviations: DeltA, deltoid anterior; PectMaj, pectoralis major; BracRad, brachioradialis; DeltM, deltoid middle; LatDorsi, latissimus dorsi; InfraSp, infraspinatus, TerMaj, teres major; TerMin, teres minor; TriMed, triceps brachii medial head. (b) Averaged activation coefficient of each module on the torque plane for 30 sets of iterations. (c) Averaged MD of each module on the torque plane for 30 sets of iterations. The coloured shading represents the standard deviation of the angle of MD across each iteration. The direction in the all polar coordinates corresponds to those in figure 1b.
Figure 4.
Figure 4.
Learning performance in the rotational period. (a) Total error between input torques and output torques across each trial in the model with (blue) and without (red) modules. The modular model was based on four modules. (b) Averaged learning speed for 30 sets of iterations in the model with and without modules. Error bars denote the standard deviation. *p < 0.001. (c) Averaged total task error at the end of the rotational period for 30 sets of iterations in the model with and without modules. (d,e) averaged learning speed and final error across each target for 30 sets of iterations during the rotational period is drawn in polar coordinates. The direction in the polar coordinates corresponds to those in figure 1b. (f–i) Total activation of neurons, muscles and modules across each trial in the model with (blue) and without (red) modules. (g) PD of a module across each trial. The different coloured lines indicate each four-module that is corresponding to the modules W1–4 in figure 3a. The origin of the right plot across each series of plots (a,d–g) corresponds to the end of the left plot.
Figure 5.
Figure 5.
Learning performance in the four-muscle model. (a) Total error between input and output torques across each trial in the model with (blue) and without (red) modules when each four MD of muscles was directed to a single joint axis on the torque plane (‘uniform’ condition). (b) Total error across each trial in the model with (blue) and without (red) modules when each four MD of muscles was biased to the first and third quadrants on the torque plane (‘bias’ condition). The origin of the right plot across each series of plots (a,b) corresponds to the end of the left plot. (c) Averaged learning speed for 30 sets of iterations in ‘uniform’ and ‘bias’ conditions. Error bars denote the standard deviation. The learning speed was compared between the model with and without modules across each condition. (d) Averaged total error at the end of the rotational period for 30 sets of iterations in ‘uniform’ and ‘bias’ conditions. The total error was compared between the model with and without modules across each condition. *p < 0.001.
Figure 6.
Figure 6.
Learning performance across different biases in neuron MDs. (a) Four different biases of the distribution in neuron MDs (formula image). The two red lines denote the major and minor axes of the bimodal distribution, the length of which corresponded to the eigenvalues of the variance–covariance matrix of the distribution. (b) Total error between the input and output torques across each trial during the rotational period. Averaged learning speed across each target for 30 sets of iterations during the rotational period is also drawn in polar coordinates. The direction in the polar coordinates corresponds to those in figure 1b. Data are shown across the four different biases of the distribution: blue, formula image; red, formula image; green, formula image and cyan, formula image. (c) Total neuron activations across each trial during the rotational period. The origin of the right plot across each series of plots (b,c) corresponds to the end of the left plot. (d) Averaged learning speed for 30 sets of iterations. Error bars denote the standard deviation. (e) Averaged total error at the end of the rotational period for 30 sets of iterations. *p < 0.001.
Figure 7.
Figure 7.
Relationship between neuron PDs and synaptic weights to modules. The number of neurons innervating each module with synaptic weight, Wneu, is represented as a colour map across each neuron having a different PD. Higher amplitude on the colour map indicates a larger number of neurons. To clearly extract the feature of the innervating neurons across each module, the bimodal distribution shown in figure 2b is normalized to have the uniform distribution. Then, the value is also normalized by the maximum among all modules.
Figure 8.
Figure 8.
Relationship between the MD and PD of neurons. The relationship between the angle of neuron MDs and PDs is shown for the model with (a) and without (b) modules. The modular model was based on four modules. On the red dashed line, the angles of a neuron's MD and PD are equal. (c) The standard deviations of the neuron MDs across each angle of the corresponding neuron PD. The value was averaged for 30 sets of iterations. The standard deviations of neuron MDs were smaller in the model with modules than in the model without modules (*p < 0.001).

Similar articles

Cited by

References

    1. Bernstein N. 1967. The coordination and regulation of movements. New York, NY: Pergamon Press.
    1. Tresch MC, Saltiel P, Bizzi E. 1999. The construction of movement by the spinal cord. Nat. Neurosci. 2, 162–167. (10.1038/5721) - DOI - PubMed
    1. d'Avella A, Saltiel P, Bizzi E. 2003. Combinations of muscle synergies in the construction of natural motor behavior. Nat. Neurosci. 6, 300–308. (10.1038/nn1010) - DOI - PubMed
    1. Ting LH, MaKay JL. 2007. Neuromechanics of muscle synergies for posture and movement. Curr. Opin Neurobiol. 17, 622–628. (10.1016/j.conb.2008.01.002) - DOI - PMC - PubMed
    1. Bizzi E, Cheung VCK, d'Avella A, Saltiel P, Tresch M. 2008. Combining modules for movement. Brain Res. Rev. 57, 125–133. (10.1016/j.brainresrev.2007.08.004) - DOI - PMC - PubMed

Publication types