

Controllable oxidative stress and tissue specificity in major tissues during the torpor-arousal cycle in hibernating Daurian ground squirrels
- PMID: 30305429
- PMCID: PMC6223210
- DOI: 10.1098/rsob.180068
Controllable oxidative stress and tissue specificity in major tissues during the torpor-arousal cycle in hibernating Daurian ground squirrels
Abstract
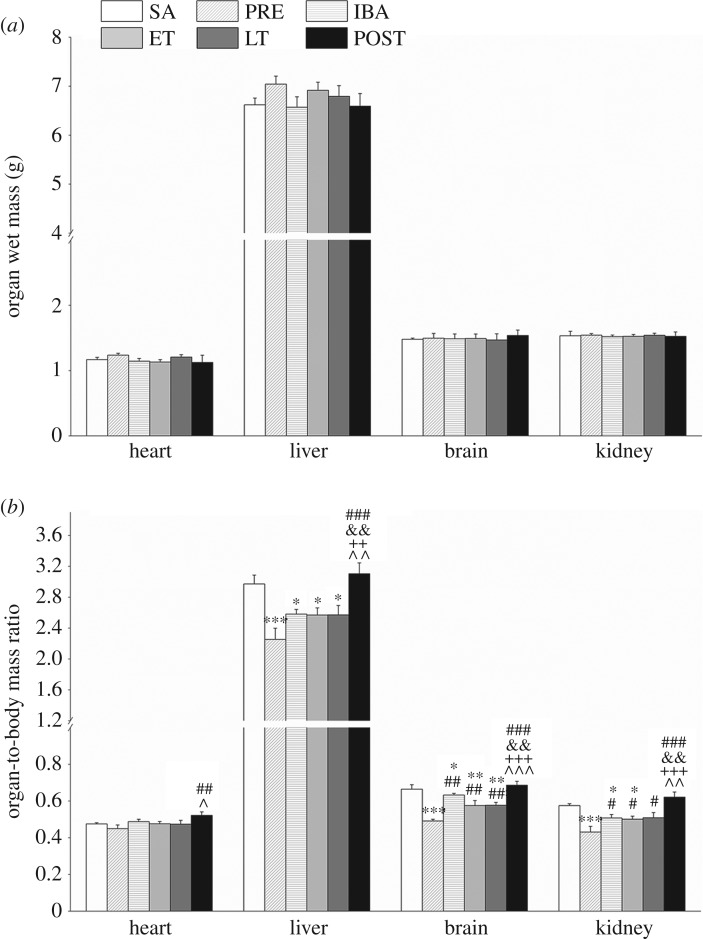
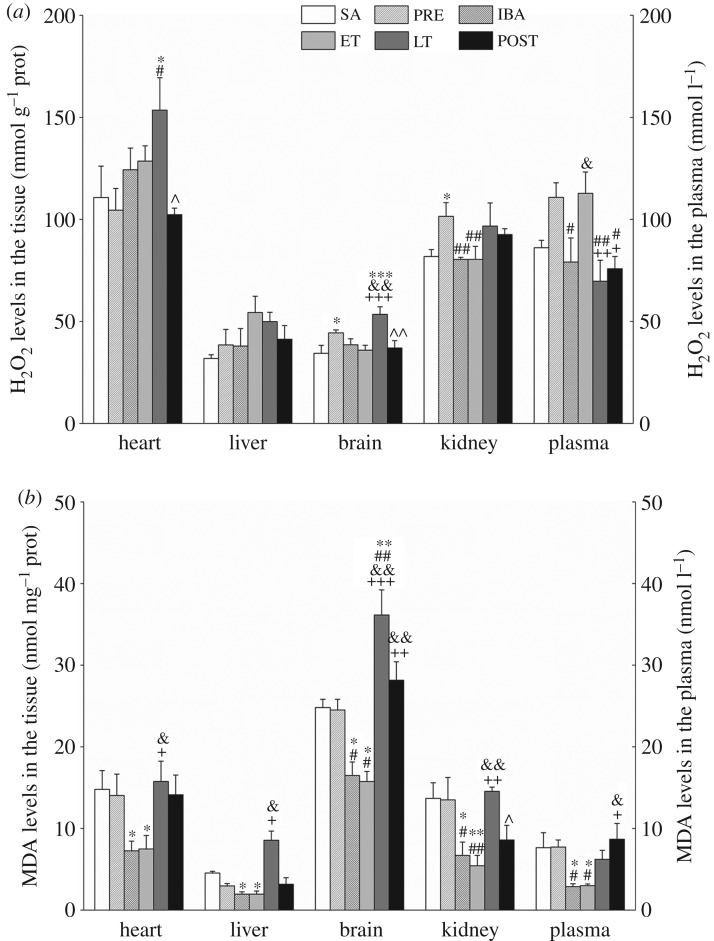
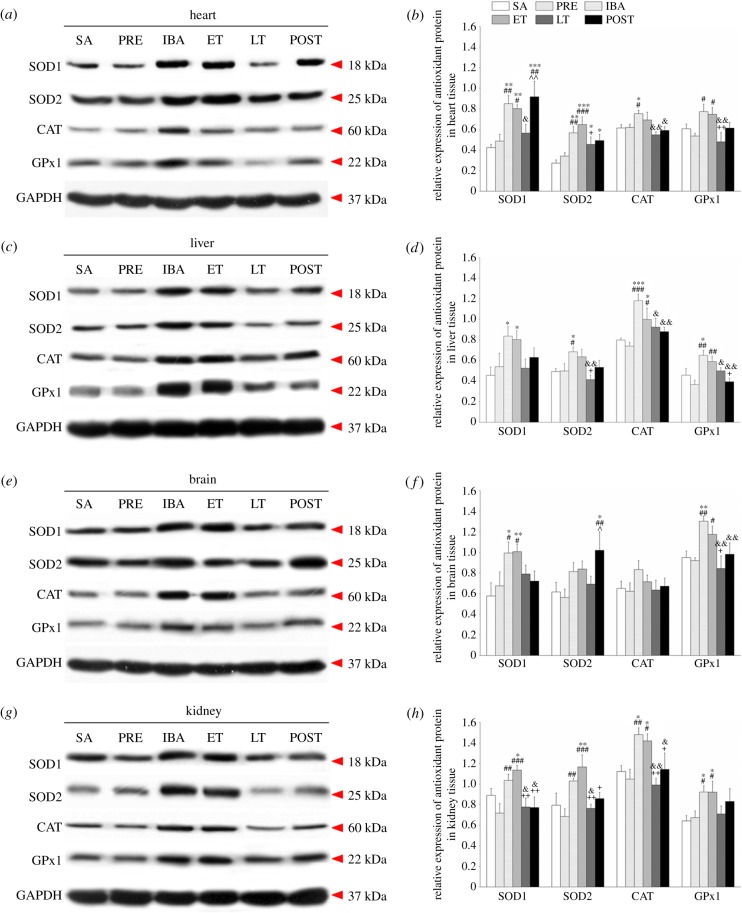
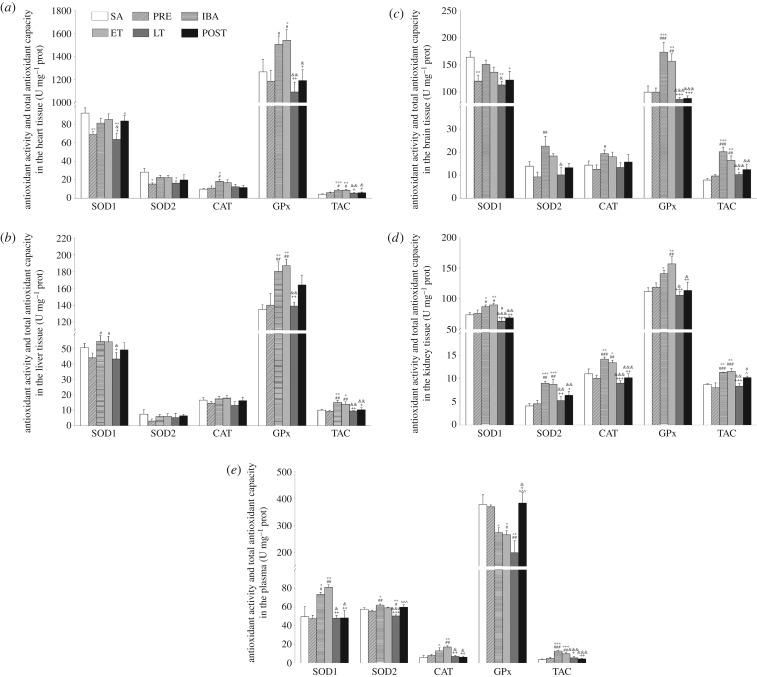
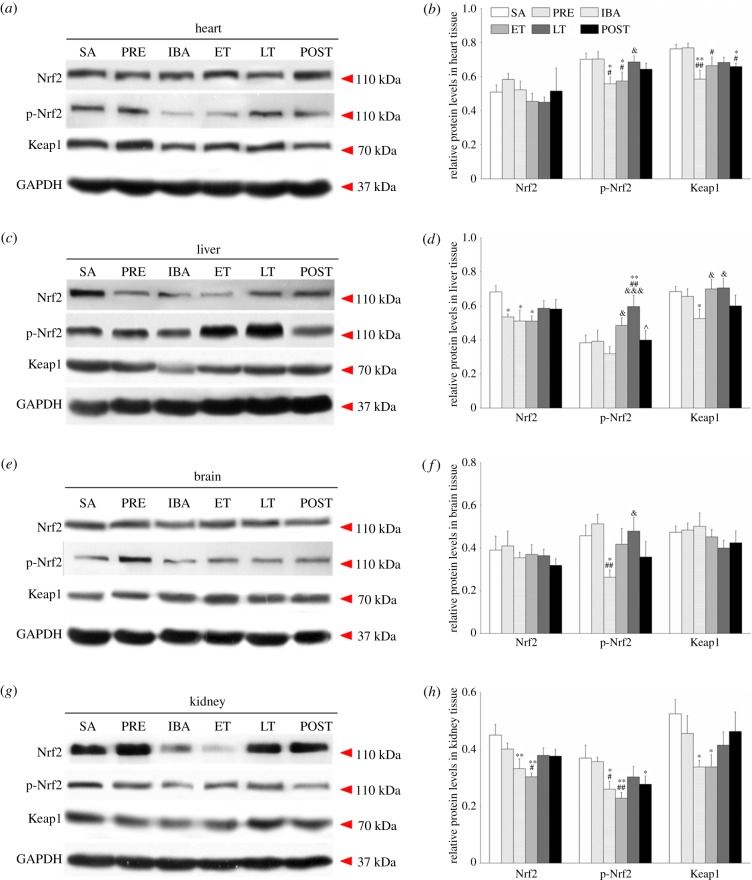
Mammalian hibernators experience repeated hypoxic ischaemia and reperfusion during the torpor-arousal cycle. We investigated levels of oxidative stress, antioxidant capacity, and the underlying mechanism in heart, liver, brain and kidney tissue as well as plasma during different periods of hibernation in Daurian ground squirrels (Spermophilus dauricus). Our data showed that the levels of hydrogen peroxide significantly increased in the heart and brain during late torpor (LT) compared with levels during the summer active (SA) state. The content of malondialdehyde (MDA) was significantly lower during interbout arousal (IBA) and early torpor (ET) than that during SA or pre-hibernation (PRE), and MDA levels in the LT brain were significantly higher than the levels in other states. Superoxide dismutase 2 protein levels increased markedly in the heart throughout the entire torpor-arousal cycle. Catalase expression remained at an elevated level in the liver during the hibernation cycle. Superoxide dismutase 1 and glutathione peroxidase 1 (GPx1) expression increased considerably in all tissues during the IBA and ET states. In addition, the activities of the various antioxidant enzymes were higher in all tissues during IBA and ET than during LT; however, GPx activity in plasma decreased significantly during the hibernation season. The expression of p-Nrf2 decreased in all tissue types during IBA, but significantly increased during LT, especially in liver tissue. Interestingly, most changed indicators recovered to SA or PRE levels in post-hibernation (POST). These results suggest that increased reactive oxygen species during LT may activate the Nrf2/Keap1 antioxidant pathway and may contribute to the decreased MDA levels found during the IBA and ET states, thereby protecting organisms from oxidative damage over the torpor-arousal cycle of hibernation. This is the first report on the remarkable controllability of oxidative stress and tissue specificity in major oxidative tissues of a hibernator.
Keywords: ROS; antioxidant defence; antioxidant enzymes; hibernation; oxidative stress.
© 2018 The Authors.
Conflict of interest statement
We declare we have no competing interests.
Figures
Similar articles
-
Remarkable Protective Effects of Nrf2-Mediated Antioxidant Enzymes and Tissue Specificity in Different Skeletal Muscles of Daurian Ground Squirrels Over the Torpor-Arousal Cycle.Front Physiol. 2019 Nov 22;10:1449. doi: 10.3389/fphys.2019.01449. eCollection 2019. Front Physiol. 2019. PMID: 31824343 Free PMC article.
-
The Protective Effects on Ischemia-Reperfusion Injury Mechanisms of the Thoracic Aorta in Daurian Ground Squirrels (Spermophilus dauricus) over the Torpor-Arousal Cycle of Hibernation.Int J Mol Sci. 2022 Sep 6;23(18):10248. doi: 10.3390/ijms231810248. Int J Mol Sci. 2022. PMID: 36142152 Free PMC article.
-
Oxidative stress levels and antioxidant defense mechanisms (Nrf2-Keap1 signaling pathway) in the Harderian glands of hibernating Daurian ground squirrels.Comp Biochem Physiol B Biochem Mol Biol. 2025 Jan;275:111044. doi: 10.1016/j.cbpb.2024.111044. Epub 2024 Nov 6. Comp Biochem Physiol B Biochem Mol Biol. 2025. PMID: 39515635
-
Integrated Redox-Metabolic Orchestration Sustains Life in Hibernating Ground Squirrels.Antioxid Redox Signal. 2024 Feb;40(4-6):345-368. doi: 10.1089/ars.2021.0277. Epub 2023 Mar 16. Antioxid Redox Signal. 2024. PMID: 36802926 Review.
-
How the gut and liver hibernate.Comp Biochem Physiol A Mol Integr Physiol. 2021 Mar;253:110875. doi: 10.1016/j.cbpa.2020.110875. Epub 2020 Dec 25. Comp Biochem Physiol A Mol Integr Physiol. 2021. PMID: 33348019 Free PMC article. Review.
Cited by
-
Iodine Redistribution During Trauma, Sepsis, and Hibernation: An Evolutionarily Conserved Response to Severe Stress.Crit Care Explor. 2020 Sep 30;2(10):e0215. doi: 10.1097/CCE.0000000000000215. eCollection 2020 Oct. Crit Care Explor. 2020. PMID: 33063025 Free PMC article.
-
Hibernation-Induced microRNA Expression Promotes Signaling Pathways and Cell Cycle Dysregulation in Ictidomys tridecemlineatus Cardiac Tissue.Metabolites. 2023 Oct 19;13(10):1096. doi: 10.3390/metabo13101096. Metabolites. 2023. PMID: 37887421 Free PMC article.
-
Sex-Specific Response to Caloric Restriction After Reproductive Investment in Microcebus murinus: An Integrative Approach.Front Physiol. 2020 Jun 16;11:506. doi: 10.3389/fphys.2020.00506. eCollection 2020. Front Physiol. 2020. PMID: 32612534 Free PMC article.
-
A Comparative Study of Antioxidative Activity of Saliva in Children and Young Teenagers with and without Gingivitis.Medicina (Kaunas). 2021 Jun 3;57(6):569. doi: 10.3390/medicina57060569. Medicina (Kaunas). 2021. PMID: 34204920 Free PMC article.
-
ROS and hypoxia signaling regulate periodic metabolic arousal during insect dormancy to coordinate glucose, amino acid, and lipid metabolism.Proc Natl Acad Sci U S A. 2021 Jan 5;118(1):e2017603118. doi: 10.1073/pnas.2017603118. Proc Natl Acad Sci U S A. 2021. PMID: 33372159 Free PMC article.
References
-
- Storey KB, Heldmaier G, Rider MH. 2010. Mammalian hibernation: physiology, cell signaling, and gene controls on metabolic rate depression. In Dormancy and resistance in harsh environments. Topics in current genetics, vol. 21 (eds Lubenz E, Cerda J, Clark M), pp. 227–252. Berlin, Heidelberg: Springer-Verlag.
Publication types
MeSH terms
Substances
LinkOut - more resources
Full Text Sources
Miscellaneous
