. 2018 Oct 10;9(1):4196.
doi: 10.1038/s41467-018-06495-5.

Compact folded metasurface spectrometer

Affiliations

Compact folded metasurface spectrometer

MohammadSadegh Faraji-Dana et al. Nat Commun. .

Abstract

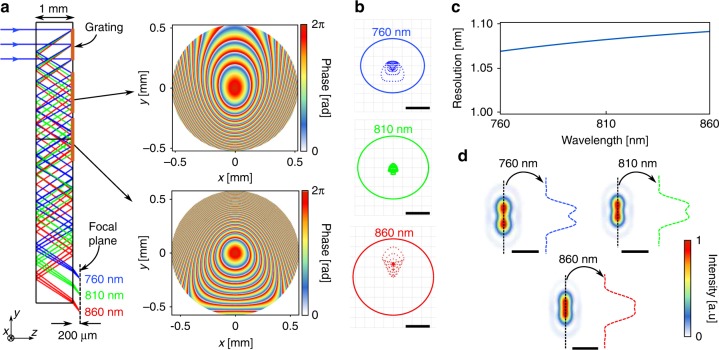
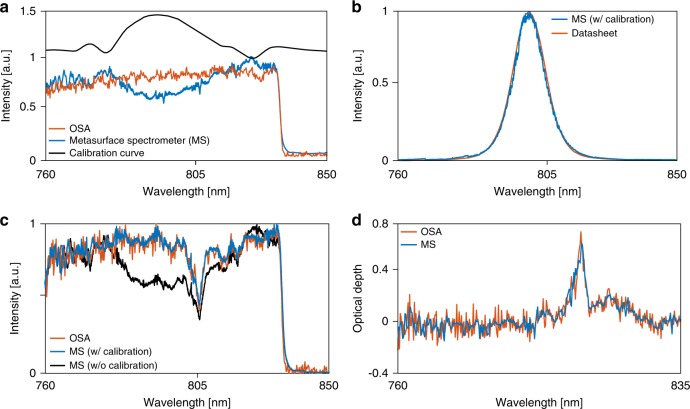
An optical design space that can highly benefit from the recent developments in metasurfaces is the folded optics architecture where light is confined between reflective surfaces, and the wavefront is controlled at the reflective interfaces. In this manuscript, we introduce the concept of folded metasurface optics by demonstrating a compact spectrometer made from a 1-mm-thick glass slab with a volume of 7 cubic millimeters. The spectrometer has a resolution of ~1.2 nm, resolving more than 80 spectral points from 760 to 860 nm. The device is composed of three reflective dielectric metasurfaces, all fabricated in a single lithographic step on one side of a substrate, which simultaneously acts as the propagation space for light. The folded metasystem design can be applied to many optical systems, such as optical signal processors, interferometers, hyperspectral imagers, and computational optical systems, significantly reducing their sizes and increasing their mechanical robustness and potential for integration.


Conflict of interest statement

The authors declare no competing interests.

Figures

Fig. 1
Fig. 1
Schematics of a conventional and a folded metasurface spectrometer. a Schematic illustration of a typical diffractive spectrometer. The main components are comprised of the fore-optics section, diffraction grating, focusing lenses, and detector array. b The proposed scheme for a folded compact spectrometer. All the dispersive and focusing optics can be implemented as reflective metasurfaces on the two sides of a single transparent substrate. Mirrors on both sides confine and direct light to propagate inside the substrate, and the detector can be placed directly at the output aperture of the device. If required, transmissive metasurfaces can also be added to the input and output apertures to perform optical functions. Although the schematic here includes metasurfaces on both sides to show the general case, the actual devices demonstrated here are designed to have metasurfaces only on one side to simplify their fabrication
Fig. 2
Fig. 2
Ray-optics design and simulation results of the folded spectrometer. a Ray-tracing simulation results of the folded spectrometer, shown at three wavelengths in the center and two ends of the band. The system consists of a blazed grating that disperses light to different angles, followed by two metasurfaces optimized to focus light for various angles (corresponding to different input wavelengths). The grating has a period of 1 μm, and the optimized phase profiles for the two metasurfaces are shown on the right. b Simulated spot diagrams for three wavelengths: center and the two ends of the band. The scale bars are 5 μm. c Spectral resolution of the spectrometer, which is calculated from simulated Airy disk radii and the lateral displacement of the focus with wavelength. d Simulated intensity distribution for two wavelengths separated by 1.1 nm around three different center wavelengths of 760, 810, and 860 nm. The intensity distributions show that wavelengths separated by 1.1 nm are theoretically resolvable. The scale bars are 20 μm
Fig. 3
Fig. 3
Metasurface structure and design graphs. a Schematics of the reflective rectangular meta-atom. The meta-atom consists of α-Si nano-posts on a fused silica substrate, capped by a layer of SU-8 polymer and backed by a gold mirror. The nano-post is 395 nm tall and the lattice constant is 250 nm for the blazed grating and 246 nm for the focusing metasurfaces. b, c Simulated reflection phase plotted for TE and TM polarizations. The black curve highlights the path through the Dx − Dy plane that results in equal phases for the two polarizations. Nano-posts on this path were used to design the two focusing metasurface elements to make them insensitive to the input polarization
Fig. 4
Fig. 4
Experimental characterization results. a An optical microscope image of the fabricated device and metasurfaces before deposition of the second gold layer. Inset shows a scanning electron micrograph of a portion of one of the two focusing metasurfaces (scale bars from left to right: 10 mm, 500 μm, and 1 μm). b, c One-dimensional focal spot profiles measured for several wavelengths in the bandwidth along the y-direction (as indicated in the inset) for TE and TM polarizations. The wavelengths start at 760 nm (blue curve) and increase at 10-nm steps up to 860 nm (red curve). d, e Measured intensity distributions for two input wavelengths that are 1.25 nm apart for TE and TM polarizations. The measurements were carried out at the center and at  the two ends of the wavelength range for both polarizations. The insets show the corresponding 2-dimensional intensity profiles, demonstrating two resolvable peaks (scale bars: 10 μm). f Calculated and measured absolute focusing efficiencies of the spectrometer for TE and TM polarizations. Both polarizations have average measured efficiencies of ~25%
Fig. 5
Fig. 5
Sample spectrum measurement results. a Spectrum of a wideband source (a super-continuum laser with an 840-nm short-pass filter) measured by a commercial OSA and the metasurface spectrometer (MS). This measurement was used to extract the calibration curve. b Spectrum of a 10-nm band-pass filter centered at 800 nm measured by the MS, compared to the spectrum acquired from the filter datasheet. c Transmission spectrum of a Nd:YVO4 crystal sample measured both with a commercial OSA and the MS. d The optical depth of the sample extracted from the spectrum measurements both with the OSA and the MS

References

    1. TKACHENKO NIKOLAI V. Optical Spectroscopy. 2006. Emission spectroscopy with optical gating methods; pp. 217–236.
    1. Hollas, J. M. Modern Spectroscopy; John Wiley & Sons, Chichester, U.K. (2004).
    1. Nevejans D, et al. Compact high-resolution spaceborne echelle grating spectrometer with acousto-optical tunable filter based order sorting for the infrared domain from 2.2 to 4.3 μm. Appl. Opt. 2006;45:5191–5206. doi: 10.1364/AO.45.005191. - DOI - PubMed
    1. Thomas CE. Optical spectrum analysis of large space bandwidth signals. Appl. Opt. 1966;5:1782–1790. doi: 10.1364/AO.5.001782. - DOI - PubMed
    1. Azaña J, Muriel MA. Real-time optical spectrum analysis based on the time-space duality in chirped fiber gratings. IEEE J. Quantum Electron. 2000;36:517–526. doi: 10.1109/3.842092. - DOI

Publication types