. 2018 Oct 10;9(1):4055.
doi: 10.1038/s41467-018-06137-w.

LRH-1 mitigates intestinal inflammatory disease by maintaining epithelial homeostasis and cell survival

Affiliations

LRH-1 mitigates intestinal inflammatory disease by maintaining epithelial homeostasis and cell survival

James R Bayrer et al. Nat Commun. .

Abstract

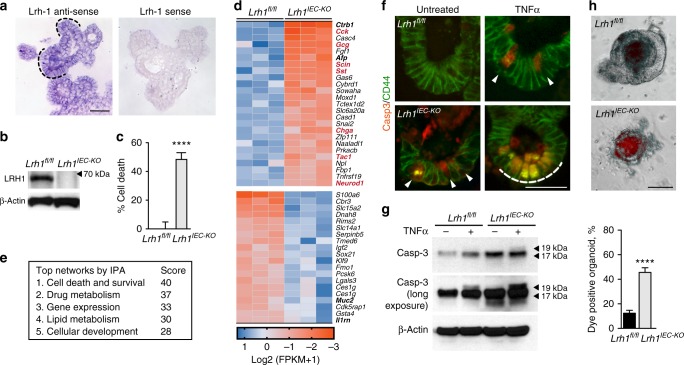
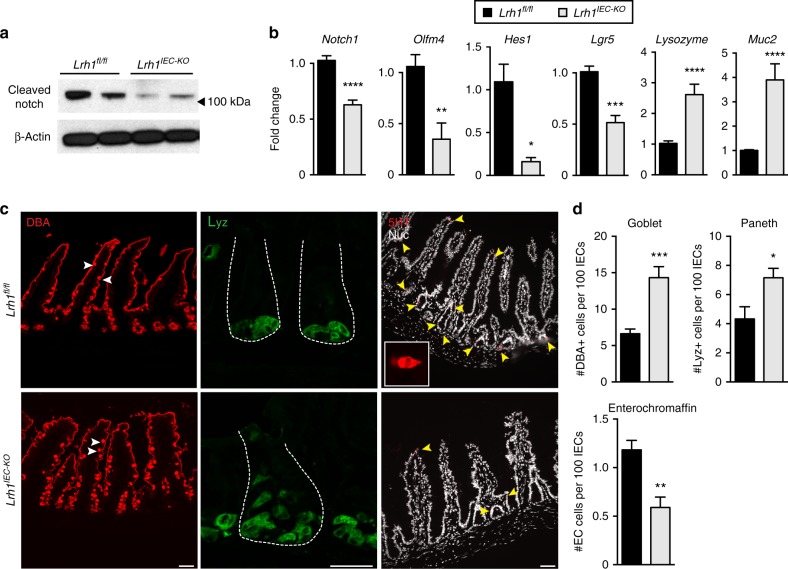
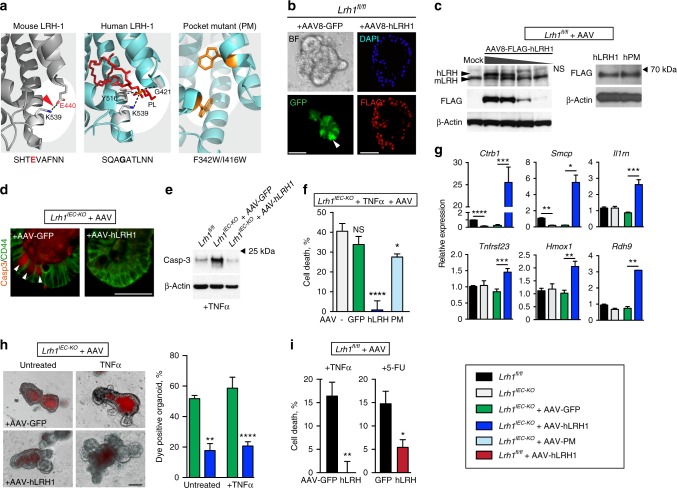
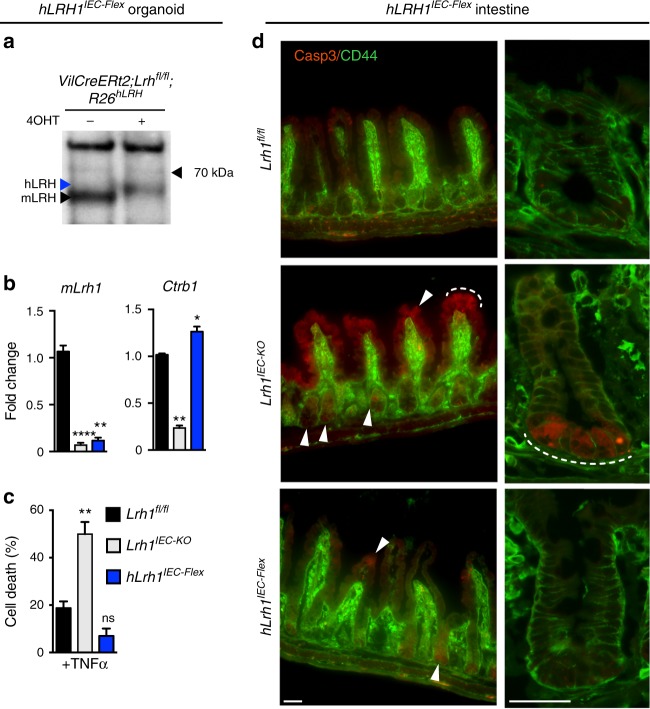
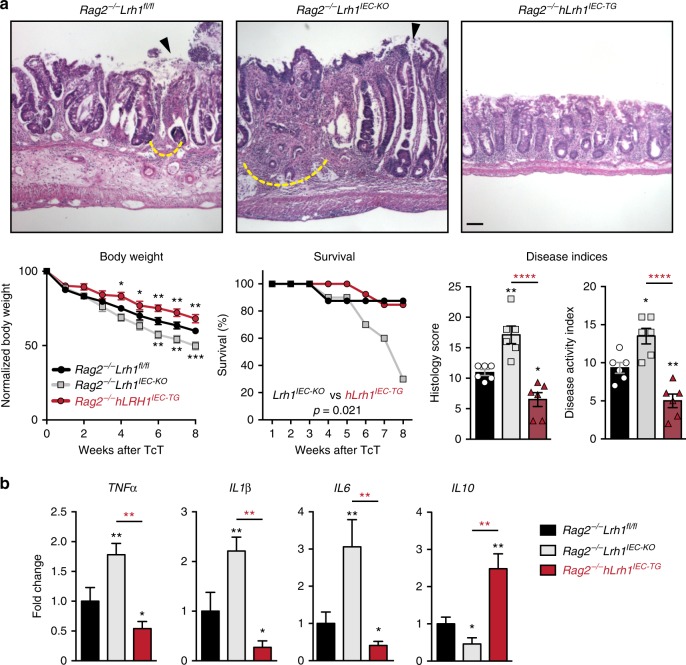
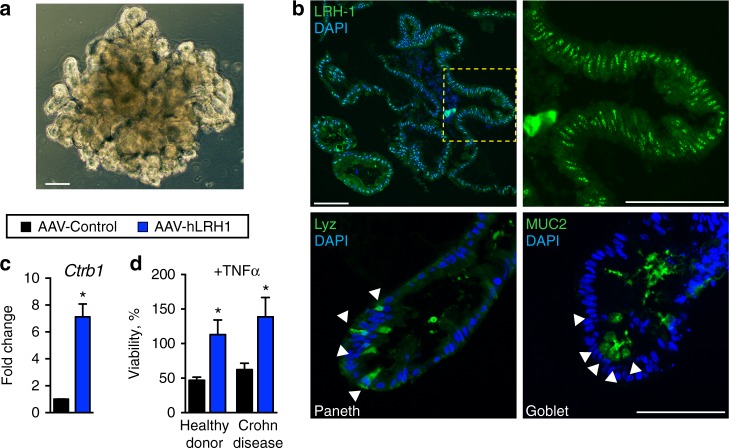
Epithelial dysfunction and crypt destruction are defining features of inflammatory bowel disease (IBD). However, current IBD therapies targeting epithelial dysfunction are lacking. The nuclear receptor LRH-1 (NR5A2) is expressed in intestinal epithelium and thought to contribute to epithelial renewal. Here we show that LRH-1 maintains intestinal epithelial health and protects against inflammatory damage. Knocking out LRH-1 in murine intestinal organoids reduces Notch signaling, increases crypt cell death, distorts the cellular composition of the epithelium, and weakens the epithelial barrier. Human LRH-1 (hLRH-1) rescues epithelial integrity and when overexpressed, mitigates inflammatory damage in murine and human intestinal organoids, including those derived from IBD patients. Finally, hLRH-1 greatly reduces disease severity in T-cell-mediated murine colitis. Together with the failure of a ligand-incompetent hLRH-1 mutant to protect against TNFα-damage, these findings provide compelling evidence that hLRH-1 mediates epithelial homeostasis and is an attractive target for intestinal disease.


Conflict of interest statement

The authors declare no competing interests.

Figures

Fig. 1
Fig. 1
Effects of loss of LRH-1 on murine organoids. a Expression of mLRH-1 transcripts in intestinal organoids is widespread and higher in crypt regions (dashed black line). Scale bar = 100 μm. b Loss of mLRH-1 after Cre-recombination induced by 4-hydroxytamoxifen (4OHT) added to Lrh-1fl/fl;Vil-CreERT2 organoids for 48 h (Lrh1IEC-KO) compared to similarly treated wild-type (Lrh1fl/fl) organoids, as detected by anti-LRH-1 antibody. c Cell death in Lrh1fl/fl and Lrh1IEC-KO organoids following acute loss of Lrh-1. Values normalized to five independent wells of untreated Lrh1fl/fl organoids taken to be 0%. d Most significant gene changes up (blue) or down (ochre) after loss of mLRH-1 by RNA expression (q = < 0.05 and p = < 0.005). Gene names in bold refer to markers of differentiation while red refer to known EEC markers. e Top five altered gene networks as identified by IPA Ingenuity analysis. f Lrh1fl/fl and Lrh1IEC-KO organoids exposed to TNFα (10 ng/ml) for 40 h stained for active Casp3 (red) and CD44 (green). Cells expressing active Casp3 undergoing cell death in crypt regions are indicated (white arrowheads and dashed white line). Scale bar = 50 μm. g Expression of active Casp3 in Lrh1fl/fl and Lrh1IEC-KO organoids as described in panel f, detected by western blotting (17 and19 kDa, black arrowheads). Shorter (top panel) and longer exposures (middle panel). h Uptake of fluorescent dextran after 30 min in Lrh1fl/fl and Lrh1IEC-KO organoids. Scale bar = 100 μm. Bar graph of percentage dye-positive enteroids (≥30 total organoids counted per condition). Data represent average of minimum three biological triplicates. For c and g, error bars are SEM using Student’s t test (unpaired, two tailed) with p values of ****p = < 0.0001
Fig. 2
Fig. 2
Lrh1IEC-KO mouse organoids have diminished Notch activation. a Representative immunoblot for cleaved Notch1 in Lrh1fl/fl (left two lanes) and Lrh1IEC-KO (right two lanes), n = 4 per condition. b Fold change in expression by RT-qPCR in Lrh1fl/fl (black) and Lrh1IEC-KO (gray) organoids for Notch1 and the Notch target genes Olfm4 and Hes1. Relative expression of the stem cell marker Lgr5, Paneth cell marker Lysozyme, and goblet cell marker Mucin2 are also shown. Minimum of three replicates per condition. c Histology of Lrh1fl/fl and Lrh1IEC-KO small intestine showing goblet (DBA, red, left), Paneth (lysozyme, green, middle) and enterochromaffin cells (5HT, red, right and inset). Scale bar = 50 μm. Intestinal crypts are outlined with dashed white line in middle panel. d Quantitation of epithelial subtype distribution, n = 3 animals per condition. For b and d, error bars are SEM using Student’s t test (unpaired, two tailed) with p values of *p = < 0.05, **p = < 0.01, ***p = < 0.001, and ****p = < 0.0001
Fig. 3
Fig. 3
Rescue of Lrh1IEC-KO mouse organoids by hLRH-1. a Ribbon diagrams of mouse (left) and human (middle) LRH-1 ligand-binding pocket highlighting species-specific structural features of salt bridge (dotted black line and red arrowhead) versus coordination of phospholipid ligand (red stick; dotted black lines). Model of hLRH-1 pocket mutant (right) showing placement of pocket-obscuring residues (gold). b AAV8-directed GFP expression in organoids after 24 h (BF brightfield, GFP fluorescence, white arrowhead indicates representative GFP+ cell). Nuclear hLRH-1 expression 4 d post-infection detected with anti-Flag. Scale bar = 100 μm. c Titration of hLRH-1 protein by infectious titer of AAV8-hLRH1 (3.3×10¹⁰− 4.1×10⁹ genome copies) after 4 d (left); mock infection is without virus. LRH-1 detected by anti-LRH-1 (upper panel) or anti-FLAG (middle panel). NS: nonspecific band. Western blot for AAV-hLRH1 and AAV-PM detected by FLAG antibody from Lrh1fl/fl organoids infected with equal titer of AAV (right). d Casp3 signal in untreated Lrh1IEC-KO organoid crypts infected with either AAV-GFP or AAV-hLRH1 with Casp3+ cells indicated (white arrowheads). Scale bar = 50 μm. e Expression of active Casp3 protein in Lrh1IEC-KO organoids infected with AAV-GFP or AAV-hLRH1 for 72 h prior to TNFα (10 ng/ml, 40 h). f Percent cell death in Lrh1IEC-KO organoids infected with mock (gray), AAV-GFP (green), AAV-hLRH1 (blue), or AAV-hPM (hLRH-1 pocket mutant; light blue) for 72 h, and then treated with TNFα (10 ng/ml, 40 h). g Fold change by RT-qPCR in Lrh1fl/fl (black) and Lrh1IEC-KO (gray) organoids, or in Lrh1IEC-KO organoids subsequently infected with AAV-GFP (green) or AAV-hLRH1 (blue) for 72 h. h Uptake of fluorescent dextran in Lrh1IEC-KO organoids infected with AAV-GFP or AAV-hLRH1 for 72 h followed by TNFα (10 ng/ml, 40 h) as per Fig. 1h. Scale bar = 100 μm. i Viability of TNFα-exposed Lrh1fl/fl organoids (20 ng/ml, 40 h) and 5-FU (5 μg/ml, 24 h), respectively, overexpressing hLRH-1 by approximately two times endogenous levels. Control organoids were infected with AAV-GFP (black bar). For panels fi error bars are SEM with statistical analyses as per Fig. 1 with *p = < 0.05, **p = < 0.001, ***p = < 0.0005 and ****p = < 0.0001
Fig. 4
Fig. 4
In vivo rescue of Lrh1IEC-KO mice by hLRH-1 reverses cell death. a LRH-1 protein levels in hLrh1IEC-Flex enteroids detected by anti-LRH-1 antibody with arrowheads indicating migration of human (blue) or mouse (black) LRH-1 before or after addition of 4OHT, which eliminates mLRH-1 and promotes hLRH-1 expression; protein extracts were isolated 72 h later. b Relative levels of mLRH-1 and a downstream LRH-1 target gene, Ctrb1 in wild-type (Lrh1fl/fl), Lrh1IEC- KO, and hLrh1IEC-Flex enteroids, with values normalized to wild type set at 1.0. Generation of hLrh1IEC-Flex is described in Methods. For all panels, data were generated from three independent wells of enteroids (~50 organoids per well) done in triplicate. c Percentage of cell death in hLrh1IEC-Flex enteroids with TNFα (10 ng/ml, 40 h) after eliminating mLRH-1 (gray) and expressing hLRH-1 (blue) by addition of 4OHT for 48 h. Data are also shown for treated Lrh1fl/fl enteroids (black). All values are normalized to five independent wells of untreated Lrh1fl/fl enteroids, which is taken to be 0%. d Immunofluorescence of wild-type (Lrh1fl/fl), Lrh1IEC-KO, and hLrh1IEC-Flex ileum from adult male mice treated with two consecutive injections of tamoxifen. Staining for activated Casp3 (red) and CD44 (green), which marks intestinal epithelial crypt cells, is shown at lower (first column) and higher (second column) magnification. The appearance of apoptotic cells is indicated in the crypt region as well as the villus (white arrowheads and dashed white line) in Lrh1IEC-KO ileum; some signal is also observed after expressing hLRH-1 in hLrh1IEC-Flex. Scale bars = 50 μm. N = 2 per genotype. For panels b and c error bars are SEM with statistical analyses determined by Student’s unpaired t test, two tailed with p values of *p = < 0.05, **p = < 0.01, and ****p = < 0.0001
Fig. 5
Fig. 5
hLRH-1 overexpression decreases disease severity in T-cell transfer colitis. a Representative histology from T-cell transfer colitis model for Rag2−/−Lrh1fl/fl, Rag2−/−Lrh1IEC-KO, and the LRH-1 overexpressing mouse line Rag2−/−Lrh1IEC-TG. Areas of mucosal erosion indicated with black arrowhead, crypt destruction indicated with dashed yellow line. Animal weight loss, survival during disease course, histology scores, and disease activity index are plotted below. Animal weight loss was normalized to nondiseased control at each time point. Scale bar = 100 μm. b Relative RNA levels of inflammatory and regulatory cytokines from colonic tissue of inflamed colon. Black and red asterisk symbols indicate comparison with Rag2−/−Lrh1fl/f and Rag2−/−Lrh1IEC-TG groups, respectively. Survival curves were determined by Kaplan−Meier survival analysis and Log-rank test; error bars are SEM. Statistical analyses for normalized body weights determined by two-way ANOVA and for histology and disease activity index determined by one-way ANOVA with p values of *p = < 0.05, **p = < 0.01, and ****p = < 0.0001. For weight analysis, n = Rag2/−Lrh1fl/fl no TcT (n = 4), Rag2−/−Lrh1IEC-KO (n = 6), Rag2/−Lrh1IEC-TG (n = 6). For survival analysis, n = Rag2/−Lrh1fl/fl (n = 8), Rag2−/−Lrh1IEC-KO (n = 10), Rag2−/−Lrh1IEC-TG (n = 13). For DAI, histology score and qPCR analysis, n = 6 for each group
Fig. 6
Fig. 6
Increasing hLRH-1 in human intestinal organoids protects against TNFα. a Brightfield view of human small intestinal organoid. Scale bar = 100 μm. b Immunofluorescence for LRH-1 (green, top panels) in human intestinal organoid sections shows expression throughout the organoid with strongest expression occurring in the crypt domain (yellow dashed box and zoomed image, right). Differentiation markers for Paneth (Lyz, left) and goblet (Muc2, right) cells are shown below. Scale bar = 100 μm. c Expression of LRH-1 target gene Ctrb1 in human intestinal organoids is upregulated 72 h after infection with AAV-hLRH1 (blue) but not with control AAV (black). d Overexpression of hLRH-1 by AAV confers resistance to TNFα-mediated cell death. Human organoids from healthy donor and a Crohn disease patient were infected with AAV-hLRH (blue) or AAV-Control (black) (3.3×10¹⁰ genome copies) for 72 h under differentiation conditions and then exposed to TNFα (20 ng/ml, 40 h). Data represent an N of at least three replicates with ~50 organoids per well. For panels c and d error bars are SEM with statistical analyses determined by Student’s unpaired t test, two tailed with p values of *p = < 0.05

References

    1. Baumgart DC, Sandborn WJ. Inflammatory bowel disease: clinical aspects and established and evolving therapies. Lancet. 2007;369:1641–1657. doi: 10.1016/S0140-6736(07)60751-X. - DOI - PubMed
    1. Consortium UIG, et al. Genome-wide association study of ulcerative colitis identifies three new susceptibility loci, including the HNF4A region. Nat. Genet. 2009;41:1330–1334. doi: 10.1038/ng.483. - DOI - PMC - PubMed
    1. Mokry M, et al. Many inflammatory bowel disease risk loci include regions that regulate gene expression in immune cells and the intestinal epithelium. Gastroenterology. 2014;146:1040–1047. doi: 10.1053/j.gastro.2013.12.003. - DOI - PubMed
    1. Sato T, et al. Long-term expansion of epithelial organoids from human colon, adenoma, adenocarcinoma, and Barrett’s epithelium. Gastroenterology. 2011;141:1762–1772. doi: 10.1053/j.gastro.2011.07.050. - DOI - PubMed
    1. Sato T, et al. Single Lgr5 stem cells build crypt-villus structures in vitro without a mesenchymal niche. Nature. 2009;459:262–265. doi: 10.1038/nature07935. - DOI - PubMed

Publication types