. 2018 Oct;562(7728):532-537.
doi: 10.1038/s41586-018-0616-y. Epub 2018 Oct 10.

Pathogen elimination by probiotic Bacillus via signalling interference

Affiliations

Pathogen elimination by probiotic Bacillus via signalling interference

Pipat Piewngam et al. Nature. 2018 Oct.

Abstract

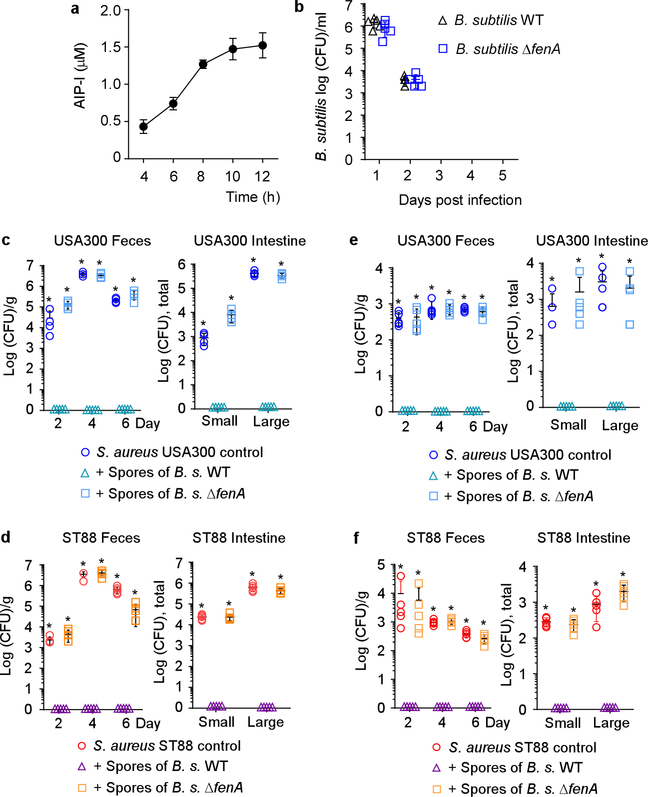
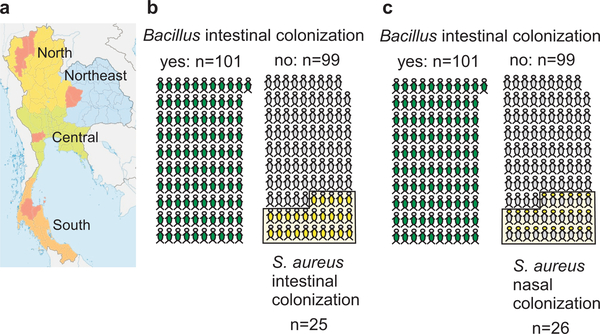
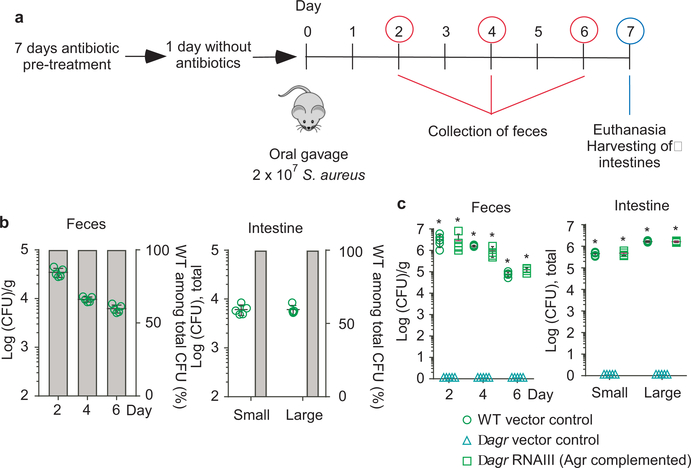
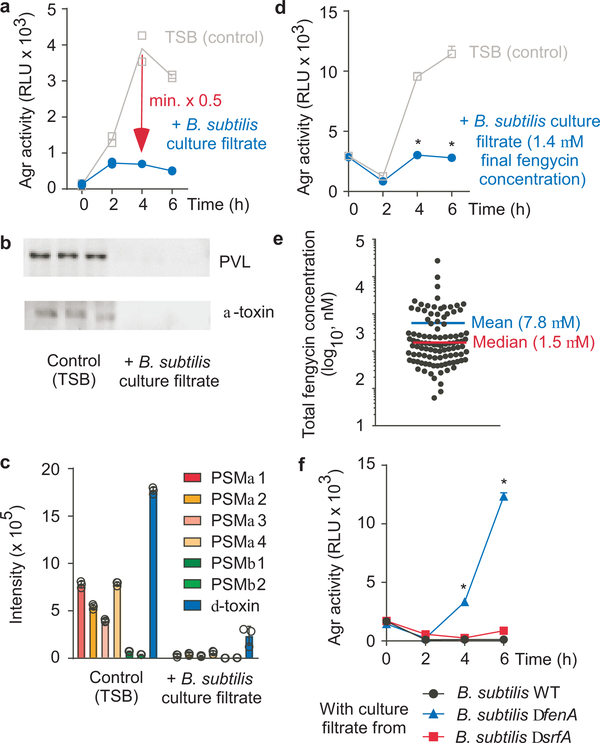
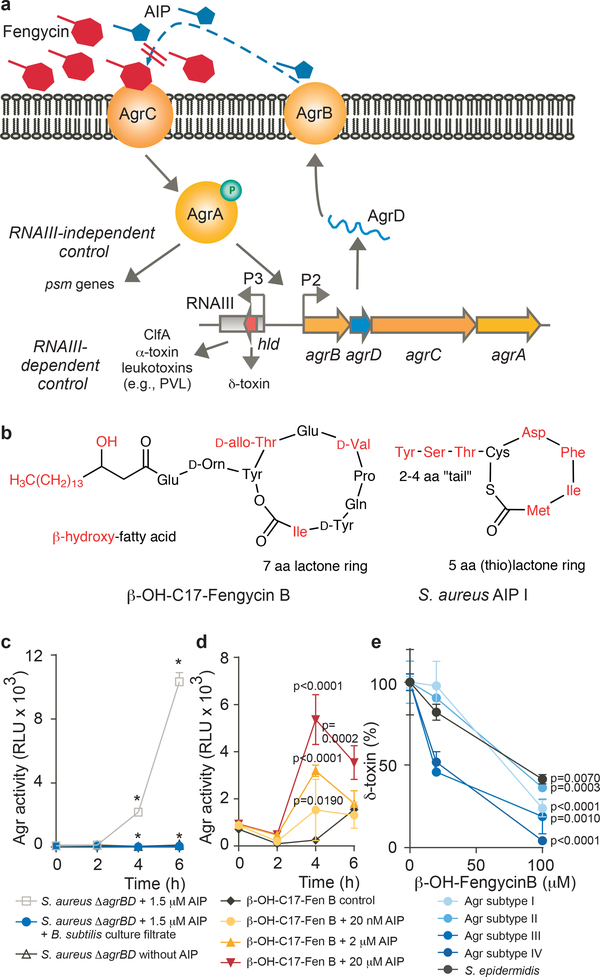
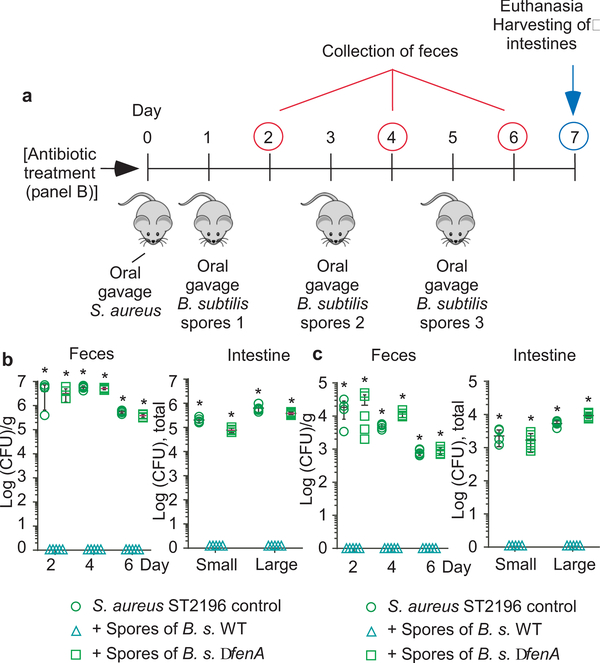
Probiotic nutrition is frequently claimed to improve human health. In particular, live probiotic bacteria obtained with food are thought to reduce intestinal colonization by pathogens, and thus to reduce susceptibility to infection. However, the mechanisms that underlie these effects remain poorly understood. Here we report that the consumption of probiotic Bacillus bacteria comprehensively abolished colonization by the dangerous pathogen Staphylococcus aureus in a rural Thai population. We show that a widespread class of Bacillus lipopeptides, the fengycins, eliminates S. aureus by inhibiting S. aureus quorum sensing-a process through which bacteria respond to their population density by altering gene regulation. Our study presents a detailed molecular mechanism that underlines the importance of probiotic nutrition in reducing infectious disease. We also provide evidence that supports the biological significance of probiotic bacterial interference in humans, and show that such interference can be achieved by blocking a pathogen's signalling system. Furthermore, our findings suggest a probiotic-based method for S. aureus decolonization and new ways to fight S. aureus infections.


Conflict of interest statement

The authors declare that there are no conflicts of interest.

Figures

Extended Data Figure 1 |
Extended Data Figure 1 |. Microbiome analysis of S. aureus carriers versus non-carriers.
The microbiota of n=20 randomly selected S. aureus carriers (red) and n=20 non-carriers (blue) were analyzed in fecal samples. a-c, Rarefaction curves of 16S rRNA gene sequences. Error bars shown the means ±SD. a, Shannon index. b, Observed species against the number of sequences per sample. c, Chao1 index. d, Relative taxa abundance comparison between S. aureus carriers (red) and non-carriers (blue), e-f, beta diversity, represented by a Principal Coordinate Analysis (PCoA) plot based on unweighted UniFrac (e) and weighted UniFrac metrics (f) for samples from S. aureus carriers (red) and non-carriers (blue).
Extended Data Figure 2 |
Extended Data Figure 2 |. Quorum-sensing dependence of S. aureus intestinal colonization.
Data from strains USA300 LAC and ST88 JSNZ. The experimental setup is the same as in Fig. 2 of the main manuscript: Mice received by oral gavage 100 μl containing 108 CFU/ml of wild-type (WT) S. aureus strains USA300 LAC or ST88 JSNZ and another 100 μl of 108 CFU/ml of the corresponding isogenic agr mutant (n=5/group, competitive experiment shown in a,b), or 200 μl containing 108 CFU/ml wild-type, isogenic agr mutant, or Agr (RNAIII)-complemented agr mutant (n=5/group, non-competitive experiment shown in c). CFU in the feces were determined two, four, and six days after infection. At the end of the experiment (day seven), CFU in the small and large intestines were determined. a,b Competitive experiment. Total obtained CFU are shown as dot plots, also showing the means ±SD. Bars show the percentage of wild-type among total determined CFU, of which 100 were analyzed for tetracycline resistance that is present only in the agr mutant. No agr mutants were detected in any experiment; thus, all bars show 100%. Given that 100 isolates were tested, the competitive index wild-type/agr mutant in all cases is ≥ 100. c, Non-competitive experiment with genetically complemented strains. Wild-type and isogenic agr mutant strains all harbored the pKXΔ16 control plasmid; Agr-complemented strains harbored pKXΔRNAIII, constitutively expressing RNAIII, which is the intracellular effector of Agr. During the experiment, mice received 200 μg/ml kanamycin in the drinking water to maintain plasmids. Statistical analysis was performed using Poisson regression versus values obtained with the agr mutant strains. *, p<0.0001. Error bars show the means ±SD. Note no bacteria were found in the feces or intestines of any mouse receiving S. aureus Δagr with vector control. The corresponding zero values are plotted on the x-axis of the logarithmic scale.
Extended Data Figure 3 |
Extended Data Figure 3 |. Analysis of Agr-inhibitory substances.
a, Influence of heat and protease on Agr inhibition. B. subtilis (B. s.) culture filtrate was subjected to heat (95 °C, 20 min) or proteinase K digestion (50 μg/ml, 37 °C, 1 h) and the impact on inhibition of Agr activity was measured using the luminescence assay with the USA300 P3-luxABCDE reporter strain (see Fig. 3a). RLU, relative light units. The experiment was performed with n=2 independent biological samples. Lines connect the means. (The observed additional suppression of Agr activity in the proteinase K-treated sample at 6 h, as compared to the B.s. culture filtrate sample, is expected due to proteolytic inactivation of intrinsic AIP.) b, Preparative RP chromatography of B. subtilis culture filtrate to determine the Agr-inhibiting substance. The peaks labeled 2 and 3 showed significant Agr-inhibiting activities in the Agr activity assay and were identified as fengycins using subsequent RP-HPLC/ESI-MS and MS/MS analysis (see c,d). The peaks labeled 1 and 4–6 also contained fengycin species (see e). c, Fractions corresponding to the Agr-inhibitory peaks 2 and 3 from the preparative RP run (b) were subjected to RP-HPLC/ESI-MS. Top, total ion chromatograms (TICs) of the RP-HPLC/ESI-MS runs; bottom, ESI mass spectrogram of the major peaks. d, MS/MS analysis of the peak 2 and 3 fractions. Peaks that are characteristic for a given fengycin subtype (A or B in this case) are marked in color. e, Analysis of further fengycin-containing fractions. Peaks 1, 4, 5, and 6 from the preparative RP run (b) were also found to contain fengycin species as determined by subsequent RP-HPLC/ESI-MS analysis. Shown are the mass spectrograms of the major peaks of those runs and the tentative characterization for fengycin type. The preparative and analytical chromatography and HPLC/MS analyses (as shown in b and d) were repeated multiple (> 10) times for fengycin purification with similar results. MS/MS analyses were not repeated. f, Analysis of fengycin and surfactin lipopeptide expression of the B. subtilis wild-type strain and its isogenic ΔfenA mutant.
Extended Data Figure 4 |
Extended Data Figure 4 |. Assessment of purity and functionality of purified β-OH-C17-Fengycin B.
a, RP-HPLC run. b, Agr inhibition at different concentrations in the luminescence assay. RLU, relative light units. Statistical analysis was by 2-way ANOVA with Tukey’s post-test. Comparisons shown are those versus DMSO control. c, Agr inhibition as measured by inhibition of expression of RNAIII by qRT-PCR. *, p<0.0001 (1-way ANOVA with Tukey’s post-test. Comparisons shown are those versus 0 μM value). b,c, The experiments were performed with n=3 independent biological samples. Error bars show the means ±SD.
Extended Data Figure 5 |
Extended Data Figure 5 |. Inhibition of S. aureus colonization by dietary fengycin-producing Bacillus spores in a mouse model.
a, AIP concentration during S. aureus growth. Strain LAC (USA300) was grown in TSB and AIP concentrations were measured by HPLC/MS. Calibration was performed using synthetic AIP. The detection limit of this assay is ~ 0.3 μM. The experiment was performed with n=3 independent biological samples. Error bars show the means ±SD. b, B. subtilis colonization kinetics in the mouse intestinal colonization experiment. Mice (n=5) received 200 μl of a 108 CFU/ml suspension of B. subtilis wild-type or ΔfenA mutant spores by oral gavage and CFU in the feces were analyzed up to 5 days afterwards. Error bars show the means ±SD. c-f, Inhibition mouse model with strains USA300 LAC and ST88 JSNZ. The experimental setup was the same as shown in Fig. 5a. n=4 or 5 mice/group received 200 μl of 108 CFU/ml S. aureus strains USA300 LAC or ST88 JSNZ by oral gavage. On the next and every following second day, they received 200 μl of 108 CFU/ml spores of the B. subtilis wild-type (WT) or its isogenic fenA mutant, also by oral gavage. CFU in the feces were determined two, four, and six days after infection. At the end of the experiment (day seven), CFU in the small and large intestines were determined. The experiment was performed with (c,d) or without (e,f) antibiotic pre-treatment. Statistical analysis was performed using Poisson regression versus values obtained with the B. subtilis WT spore samples. *, p<0.0001. Error bars shown the means ±SD. Note no S. aureus were found in the feces or intestines of any mouse challenged with any S. aureus strain receiving Bacillus wild-type spores. The corresponding zero values are plotted on the x-axis of the logarithmic scale.
Figure 1 |
Figure 1 |. S. aureus colonization exclusion by dietary Bacillus in a human population.
a, Areas (in red) from which fecal samples were collected in rural populations and analyzed for presence of Bacillus and S. aureus. b,c, Intestinal (b) and nasal (c) colonization with S. aureus (yellow) in individuals that showed (green) or did not show (grey) intestinal colonization with Bacillus.
Figure 2 |
Figure 2 |. Quorum-sensing dependence of S. aureus intestinal colonization.
a, Experimental setup of the murine intestinal colonization model. Mice received by oral gavage 100 μl containing 108 CFU/ml of wild-type (WT) S. aureus strain ST2196 F12 and another 100 μl of 108 CFU/ml of the corresponding isogenic agr mutant (n=5/group, competitive experiment shown in b), or 200 μl containing 108 CFU/ml wild-type, isogenic agr mutant, or Agr (RNAIII)-complemented agr mutant (n=5/group, non-competitive experiment shown in c). CFU in the feces were determined two, four, and six days after infection. At the end of the experiment (day seven), CFU in the small and large intestines were determined. b, Competitive experiment. Total obtained CFU are shown as dot plots, also showing the means ±SD. Bars show the percentage of wild-type among total determined CFU, of which 100 were analyzed for tetracycline resistance that is present only in the agr mutant. No agr mutants were detected in any experiment; thus, all bars show 100%. Given that 100 isolates were tested, the competitive index wild-type/agr mutant in all cases is ≥ 100. c, Non-competitive experiment with genetically complemented strains. Wild-type and isogenic agr mutant strains all harbored the pKXΔ16 control plasmid; Agr-complemented strains harbored pKXΔRNAIII, constitutively expressing RNAIII, which is the intracellular effector of Agr. During the experiment, mice received 200 μg/ml kanamycin in the drinking water to maintain plasmids. Statistical analysis was performed using Poisson regression versus values obtained with the agr mutant strains. *, p<0.0001. Error bars shown the means ±SD. Note no bacteria were found in the feces or intestines of any mouse receiving S. aureus Δagr with vector control. The corresponding zero values are plotted on the x-axis of the logarithmic scale. See Extended Data Fig. 2 for the corresponding data using strains USA300 LAC and ST88 JSNZ.
Figure 3 |
Figure 3 |. S. aureus quorum-sensing inhibition by Bacillus fengycin lipopeptides.
a, Example of an Agr inhibition experiment. The Bacillus isolate was considered inhibitory if luminescence after 4 h growth of S. aureus was ≤ 0.5 times that of the control value. RLU, relative light units. The experiment was performed with n=2 biologically independent samples. The lines connect the means. b, Inhibition of expression of PVL and α-toxin, using culture filtrate of the B. subtilis reference strain. Western blot analysis of n=3 biologically independent samples was performed with S. aureus culture filtrates grown for 4 h. See Supplementary Fig. 1 for the entire blots. c, Inhibition of expression of PSM toxins using culture filtrate of the B. subtilis standard strain. PSM expression was determined by RP-HPLC/ESI-MS after 4 h of growth. d, Test for inhibitory capacity of Bacillus culture filtrate applied to a final concentration representing the median concentration of total fengycin in the tested 106 Bacillus isolates. *, p<0.0001 (2-way ANOVA with Tukey’s post-test versus control). e, Total fengycin concentrations in stationary-phase culture filtrates of the 106 Bacillus isolates (see Extended Data Table 1 for details). f, Agr-inhibiting activities of B. subtilis wild-type (WT) in comparison to ΔfenA (fengycin-deficient) and ΔsrfA (surfactin-deficient) strains. *, p<0.0001 (2-way ANOVA with Tukey’s post-test versus WT). c,d,f, The experiments were performed with n=3 biologically independent samples. Error bars shown the means ±SD.
Figure 4 |
Figure 4 |. Competitive inhibition of S. aureus AIP activity by fengycins.
a, Model of competitive Agr inhibition by fengycins. The agrBDCA operon, whose expression is driven by the P2 promoter, encodes the AgrD precursor of the autoinducing peptide (AIP), which is modified and secreted by AgrB. AIP binds to membrane-located AgrC, which upon auto-phosphorylation triggers phosphorylation and activation of the DNA-binding protein, AgrA. In addition to stimulating transcription from the P2 promoter (auto-induction), AgrA drives expression of RNAIII, which in turn regulates expression of target genes. RNAIII also encodes the δ-toxin. Furthermore, AgrA drives PSM expression in an RNAIII-independent fashion. b, Structural similarity of fengycins with AIPs. The structures of β-OH-C17-Fengycin B and AIP-I are shown as examples. In red are structures/amino acids that may differ in different subtypes. c, Fengycins work by inhibition of AgrC. Shown is the Agr inhibition by fengycin-containing Bacillus culture filtrate using an agrBD-deleted strain in which AgrC was stimulated by exogenously added AIP. * p<0.0001 [2-way ANOVA with Tukey’s post-test: Values obtained in ΔagrBD/AIP versus ΔagrBD/control (no AIP) and ΔagrBD/AIP/culture filtrate versus ΔagrBD/AIP]. d, Competitive titration of fengycin-mediated Agr inhibition by increasing amounts of AIP as assayed by the Agr luminescence assay. RLU, relative light units. Statistical analysis is by 2-way ANOVA with Tukey’s post-test versus control. e, Inhibition of Agr in different Agr subtype S. aureus and S. epidermidis (strain 1457) by β-OH-C17-Fengycin B as measured by relative expression of δ-toxin via RP/HPLC-MS. Statistical analysis is by 2-way ANOVA with Tukey’s post-test versus intensity values obtained without addition of fengycin. Values were calculated as percentage relative to intensity values obtained without addition of fengycin, due to different δ-toxin expression levels in the different strains. c-e, The experiments were performed with n=3 biologically independent samples. Error bars shown the means ±SD.
Figure 5 |
Figure 5 |. Inhibition of S. aureus colonization by dietary fengycin-producing Bacillus spores in a mouse model.
a, Experimental setup. n=5 mice/group received 200 μl of 108 CFU/ml S. aureus strain ST2196 F12 by oral gavage. On the next and every following second day, they received 200 μl of 108 CFU/ml spores of the B. subtilis wild-type (WT) or its isogenic fenA mutant, also by oral gavage. CFU in the feces were determined two, four, and six days after infection. At the end of the experiment (day seven), CFU in the small and large intestines were determined. The experiment was performed with (b) or without (c) antibiotic pre-treatment. b,c Results. Statistical analysis was performed using Poisson regression versus values obtained with the B. subtilis WT spore samples. *, p<0.0001. Error bars shown the means ±SD. Note no S. aureus were found in the feces or intestines of any mouse challenged with any S. aureus strain receiving Bacillus wild-type spores. The corresponding zero values are plotted on the x-axis of the logarithmic scale. See Extended Data Fig. 5 for the corresponding data using strains USA300 LAC and ST88 JSNZ.

Comment in

Similar articles

Cited by

References

    1. Guarner F & Malagelada JR Gut flora in health and disease. Lancet 361, 512–519 (2003). - PubMed
    1. Kamada N, Chen GY, Inohara N & Nunez G Control of pathogens and pathobionts by the gut microbiota. Nat Immunol 14, 685–690 (2013). - PMC - PubMed
    1. Gourbeyre P, Denery S & Bodinier M Probiotics, prebiotics, and synbiotics: impact on the gut immune system and allergic reactions. J Leukoc Biol 89, 685–695 (2011). - PubMed
    1. Macpherson AJ & Harris NL Interactions between commensal intestinal bacteria and the immune system. Nat Rev Immunol 4, 478–485 (2004). - PubMed
    1. Bermudez-Brito M, Plaza-Diaz J, Munoz-Quezada S, Gomez-Llorente C & Gil A Probiotic mechanisms of action. Ann Nutr Metab 61, 160–174 (2012). - PubMed

Publication types

MeSH terms