. 2018 Oct;562(7727):423-428.
doi: 10.1038/s41586-018-0597-x. Epub 2018 Oct 10.

IRE1α-XBP1 controls T cell function in ovarian cancer by regulating mitochondrial activity

Affiliations

IRE1α-XBP1 controls T cell function in ovarian cancer by regulating mitochondrial activity

Minkyung Song et al. Nature. 2018 Oct.

Abstract

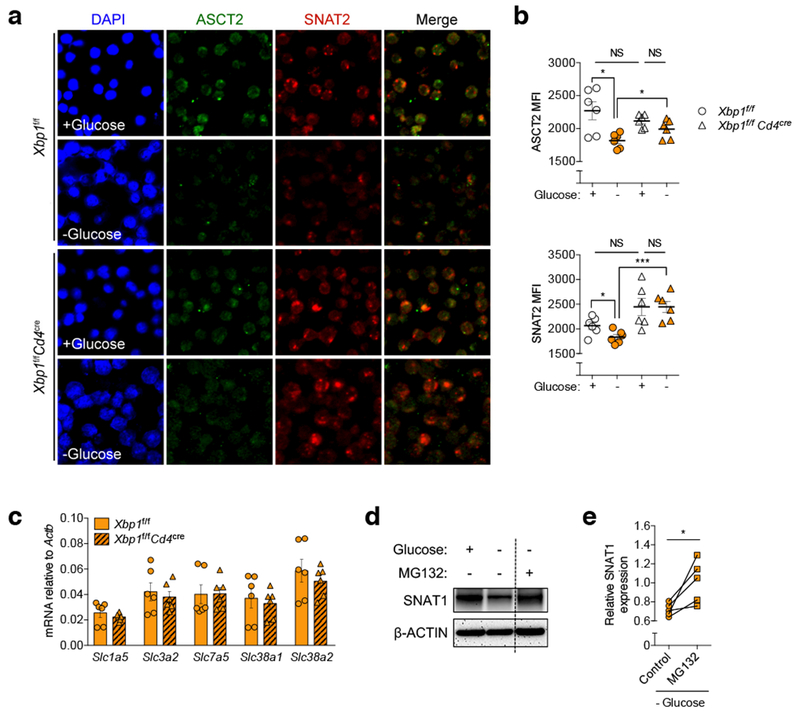
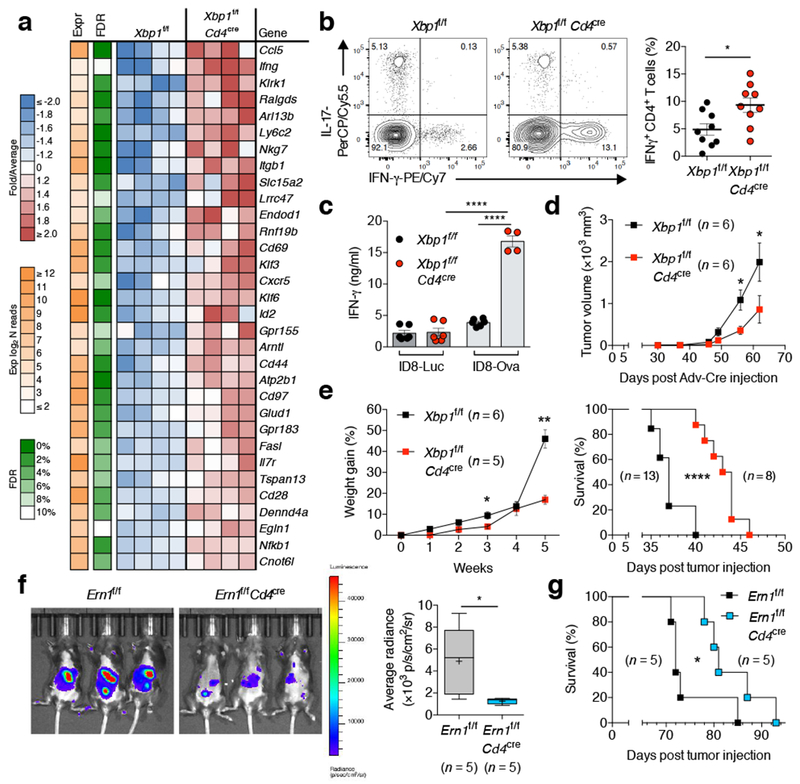
Tumours evade immune control by creating hostile microenvironments that perturb T cell metabolism and effector function1-4. However, it remains unclear how intra-tumoral T cells integrate and interpret metabolic stress signals. Here we report that ovarian cancer-an aggressive malignancy that is refractory to standard treatments and current immunotherapies5-8-induces endoplasmic reticulum stress and activates the IRE1α-XBP1 arm of the unfolded protein response9,10 in T cells to control their mitochondrial respiration and anti-tumour function. In T cells isolated from specimens collected from patients with ovarian cancer, upregulation of XBP1 was associated with decreased infiltration of T cells into tumours and with reduced IFNG mRNA expression. Malignant ascites fluid obtained from patients with ovarian cancer inhibited glucose uptake and caused N-linked protein glycosylation defects in T cells, which triggered IRE1α-XBP1 activation that suppressed mitochondrial activity and IFNγ production. Mechanistically, induction of XBP1 regulated the abundance of glutamine carriers and thus limited the influx of glutamine that is necessary to sustain mitochondrial respiration in T cells under glucose-deprived conditions. Restoring N-linked protein glycosylation, abrogating IRE1α-XBP1 activation or enforcing expression of glutamine transporters enhanced mitochondrial respiration in human T cells exposed to ovarian cancer ascites. XBP1-deficient T cells in the metastatic ovarian cancer milieu exhibited global transcriptional reprogramming and improved effector capacity. Accordingly, mice that bear ovarian cancer and lack XBP1 selectively in T cells demonstrate superior anti-tumour immunity, delayed malignant progression and increased overall survival. Controlling endoplasmic reticulum stress or targeting IRE1α-XBP1 signalling may help to restore the metabolic fitness and anti-tumour capacity of T cells in cancer hosts.


Conflict of interest statement

COMPETING INTERESTS: J.R.C.-R. and L.H.G. are co-founders of and scientific advisors for Quentis Therapeutics, Inc. S.E.B. is co-founder and employee of Quentis Therapeutics, Inc. L.H.G. also serves on the board of directors of and holds equity in GlaxonSmithKline Pharmaceuticals.

Figures

Extended Data Figure 1.
Extended Data Figure 1.. Reduced glucose uptake and defective N-linked protein glycosylation promotes IRE1α-XBP1 activation in ascites-exposed human CD4+ T cells.
a, Human CD4+ T cells were activated via CD3/CD28 stimulation for 16 h in the absence or presence of OvCa ascites supernatants at the indicated concentrations. XBP1 expression was determined by qRT-PCR (10%, n = 58; 50%, n = 25; 100%, n = 30). Data were normalized to endogenous expression of ACTB in each sample. Results are presented as percent increase in expression compared with untreated controls. b, Histograms for FACS-based XBP1s staining in CD4+ T cells treated as indicated. Tm, tunicamycin; 4μ8C, inhibitor of the IRE1α RNase domain. Data were validated by three independent experiments. c-d, CD4+ T cells were treated with Vitamin E (VitE, 50μM) or vehicle (Ethanol 0.1%) for 1h and then stimulated with anti-CD3/CD28 beads for 16 h in the presence of ascites. Intracellular ROS staining by DCFDA (c) and XBP1 expression (d) (n = 10). Data are expressed as percent response change compared with untreated controls. e, Glucose concentration in regular culture media (cRPMI) and in seven independent OvCa ascites samples. Each dot represents the mean of two measurements. f, XBP1 expression in the samples described in panel a are displayed based on the final glucose concentration in the culture after addition of ascites. Three independent ascites samples were used: A10 (triangles), A15 (circles), A17 (squares) at three different concentrations (10, 50, and 100%). g, GLUT1 surface expression on the indicated cell types present in OvCa ascites from 6 independent patients was determined by GLUT1.RBD staining (n = 6). Quantitative analysis (left) and representative histograms (right). h, Glucose uptake and XBP1s protein expression in activated CD4+ T cells exposed to three different ascites samples at 10 and 100% for 16 h (n = 14). Results are presented as relative to untreated controls. i, CD4+ T cells were activated with anti-CD3/CD28 beads in the presence or absence of ascites for 16 h. Cells were lysed and the enriched glycoprotein fractions were analyzed for N-linked glycosylation events by LC-MS/MS. Total ion chromatograms for N-glycosylation at amino acid 315 in DPP2 are shown. Numbers in blue indicate abundance of each glycan via quantification of the corresponding peak area. Data are representative of two independent experiments with similar results. j, CD4+ T cells were treated with 10mM GlcNAc (N-Acetylglucosamine) for 1 h and stimulated via CD3/CD28 for 16 h in the presence of 10% ascites. Quantitative analyses for XBP1s protein by FACS (left, n = 6) and XBP1 gene expression by qRT-PCR (right, n = 15) are presented as percent response change compared with untreated controls. k. Relative basal and maximal OCR for CD4+ T cells exposed to 10% ascites analyzed in Fig. 2h (n = 16 total from five independent experiments). Data are expressed as percent response change compared with untreated controls. l-m, CD4+ T cells were activated via CD3/CD28 stimulation for 16 h in the absence or presence of Tm (tunicamycin) at the indicated concentrations (n = 3). l, XBP1 expression was determined via qRT-PCR. m, OCR profile of Tm-treated CD4+ T cells are shown as relative to the untreated control. n-o, Relative quantification of basal (left) and maximal (right) OCR (n), and ECAR measurements (o) in all independent samples analyzed in Fig. 2j (n = 9 total from three independent experiments). p-q, Relative quantification of basal (left) and maximal (right) OCR (p), and ECAR measurements (q) for the specimens described in panel Fig. 2k. (n = 5 total from two independent experiments). Data are presented as relative expression compared with matching controls that were not exposed to ascites. Data are shown as mean ± s.e.m (a, c-d, f-g, k-m). n values represent biologically independent samples (a, c-h, j-q). One-way ANOVA with Bonferroni’s multiple comparisons test (a, l); Two-tailed Student’s t-test (c, k); One-way ANOVA with Tukey’s multiple comparisons test (d, g); Two-tailed paired Student’s t-test (j, n-q); Nonparametric Spearman’s rank correlation test Spearman coefficient (r) with p-value (two-tailed); 95% Confidence Interval (CI) −0.8811 to −0.1626 (h). *P < 0.05, **P < 0.01, ***P < 0.001, ****P < 0.0001. NS, not significant; MFI, Mean fluorescence intensity; gMFI, Geometric mean fluorescence intensity.
Extended Data Figure 2.
Extended Data Figure 2.. Characterization of mice devoid of XBP1 in T cells.
a, Deletion efficiency was analyzed by qRT-PCR using a primer set that specifically detects the exon 2 region of Xbp1. Data were normalized to endogenous expression of Actb and presented as relative expression compared with WT (n = 8). b, Absolute cell numbers in the thymus, spleen and lymph nodes. c, FACS-based phenotyping of double negative (CD4-CD8-), double positive (CD4+CD8+), or single positive (CD4+ or CD8+) thymocytes. d-g, Frequency of TCRβ+ cells (d, f) and CD4+ or CD8+ cells (gated on TCRβ+ cells) (e, g) in lymph nodes or spleen. h-i, Expression of CD44 and CD62L on both CD4+ (h) and CD8+ (i) TCRβ+ subsets in the spleen. j, Frequency of splenic TCRβ+ CD4+ FoxP3+ T cells. k-l, Frequency of non-T cell populations among total live cells in spleen (k) and lymph nodes (l). b-g, n = 5; h-j, n = 3; k-l, Xbp1f/f (n = 4), Xbp1f/f Cd4cre (n = 5). m, Reconstitution efficiency of CD4+ and CD8+ T cells in bone marrow and spleen from mixed bone marrow chimeras (n = 3 per chimera type). Chimeras were generated with a mixture of wild-type bone marrow (CD45.1+) plus either Xbp1f/f or Xbp1f/f Vav1cre bone marrow (CD45.2+). n, Flow cytometry assessing cell proliferation of CD4+ T cells stained with the division-tracking dye (Cell Trace Violet). Cells were left unstimulated or stimulated for 72 and 96 h with plate-bound anti-CD3 (5μg/ml) and soluble anti-CD28 (1μg/ml). Histograms (left) and proliferation index (right) are shown (n = 4). o, Cell cycle analysis of CD4+ T cells activated for 72 h by staining with propidium iodide. Representative plots from two experiments. p, Transmission electron microscopy of in vitro activated WT versus XBP1-deficient CD4+ T cells. Naïve CD4+ T cells isolated from three biologically independent mice were activated with plate-bound anti-CD3 and soluble anti-CD28 antibodies for 48 h. White arrowheads indicate the endoplasmic reticulum (ER); M, Mitochondria; 12000× (left); 50000× (right). Average mitochondrial area of independent cells was estimated using image J software. Xbp1f/f (n = 19); Xbp1f/f Cd4cre (n = 29). q, Histogram (left) and quantification (right) for mitochondrial staining (Mitotracker) in in vitro activated CD4+ T cells (n = 2 from two independent experiments). r, Activated WT versus XBP1-deficient CD4+ T cells were incubated in glucose-containing, -depleted or 2-deoxyglucose (2-DG, 10mM)-treated media for 6 h and PGC1α expression was analyzed by immunoblot. β-ACTIN was used as loading control. Representative plots from two independent experiments. Data are shown as mean ± s.e.m. (a-n, p). n values represent biologically independent samples (a-n, p-q). Two-tailed Student’s t-tests (b-l, n, p); *P < 0.05; NS, not significant.
Extended Data Figure 3.
Extended Data Figure 3.. XBP1 inhibits glutamine influx in response to glucose deprivation.
a-b, Naïve splenic CD4+ T cells isolated from WT mice were activated via CD3/CD28 stimulation for 48 h and then incubated for 6 h in the indicated media. a, Expression of ER stress-related gene markers (n = 4 from two independent experiments). Data are shown as percent response change compared with control in the presence of glucose- and glutamine-containing media. b, Maximal OCR was measured in CD4+ T cells in the presence or absence of glucose, and treated with corresponding media (untreated, n = 5) or inhibitors blocking pyruvate (UK5099, n = 5), glutamine (BPTES, n = 4) or fatty acid (Etomoxir, n = 4) oxidation. Data are presented as percent response change compared with untreated control in the presence of glucose. c-i, Naïve splenic CD4+ T cells isolated from WT (solid bars) or XBP1-deficient (hatched bars) mice were activated via CD3/CD28 stimulation for 48 h, followed by culture in the presence or absence of glucose for 4.5 h, and then pulsed with [U-13C]-glutamine for an additional 1.5 h in the same culture condition. Relative abundance of 13C-labeled metabolites and TCA intermediates including glutamine (c), glutamate (d), α-ketoglutarate (e), succinate (f), malate (g), citrate (h) and aspartate (i) was determined by LC-MS/MS. Data were normalized to cell number in all cases and are representative of two independent experiments with n = 2 biologically distinct samples per group. Data are shown as mean ± s.e.m. n values represent biologically independent samples (a, b). One-way ANOVA with Bonferroni’s multiple comparisons test (a); One-way ANOVA with Tukey’s multiple comparisons test (b); *P < 0.05, **P < 0.01, ***P < 0.001, ****P < 0.0001.
Extended Data Figure 4.
Extended Data Figure 4.. XBP1 controls the abundance of glutamine transporters in glucose-deprived T cells.
a-b, Pre-activated WT or XBP1-deficient CD4+ T cells were incubated in the indicated media for 6 h and then stained on poly-l-lysine coated discs using antibodies specific for ASCT2 (green) or SNAT2 (red). Nuclei are depicted in blue (DAPI staining). a, Representative confocal images of the indicated T cells from three experiments. b, The mean fluorescence intensity (MFI) of each glutamine transporter on ~50 individual cells from three independent slides (n = 150) was computationally quantified using the Image J software by two independent investigators in a blinded manner. Individual dots depict the average MFI of each independent analysis (n = 6). c, Naïve splenic CD4+ T cells isolated from WT or XBP1-deficient mice were activated via CD3/CD28 stimulation for 48 h and then incubated in media lacking glucose for 6 h. mRNA expression of genes encoding glutamine transporters was determined by qRT-PCR (n = 6 from three experiments). Data were normalized to endogenous expression of Actb in each case. d-e, Pre-activated mouse CD4+ T cells were incubated in the indicated media for 6 h in the presence or absence of proteasome inhibitor MG132 (10 μM). d, Protein levels of the glutamine transporter SNAT1 were determined by immunoblot analysis where β-ACTIN was used as loading control. Representative image from five independent experiments. e, Densitometric quantification of SNAT1 (n = 5). Results are presented as relative expression compared with untreated control T cells incubated in glucose-containing media. Data are shown as mean ± s.e.m (b, c). n values represent biologically independent samples (c, e). Two-tailed Student’s t-tests (b); Two-tailed paired Student’s t-tests (e); *P < 0.05, ***P < 0.001; NS, not significant.
Extended Data Figure 5.
Extended Data Figure 5.. Restoring glutamine influx enhances mitochondrial function in ascites-exposed CD4+ T cells.
a-b, Immunoblot (a) and densitometric quantification (b) for ASCT2 and SNAT1 protein levels in human CD4+ T cells exposed to OvCa ascites at the indicated concentrations for 16 h. β-ACTIN was used as loading control. Data are shown as the relative expression compared with untreated (0%) controls. n = 4 for 10% ascites; n = 4 for 50% ascites; n = 2 for 100% ascites. Data were generated from two independent experiments. c-d, Human CD4+ T cells were activated via CD3/CD28 stimulation for 16 h in the absence or presence of 25% OvCa ascites supernatants, and DMKG (5 mM) was added to the cell culture during the last 4 h of incubation. OCR profile (c) and quantification of maximal OCR (d). Data are presented as relative expression compared with untreated controls incubated in the absence of ascites (n = 17 total from two independent experiments). e-f, Human CD4+ T cells activated via CD3/CD28 stimulation and IL-2 (50 U/ml) for 36 h were transduced with GFP-expressing retroviruses harboring no insert (control) or the gene encoding human SNAT1. GFP+ cells were sorted 3 days post-transduction and expanded for an additional 48 h in the presence of CD3/CD28 stimulation and IL-2 (50 U/ml). After 20 h of resting, cells were restimulated with CD3/CD28 antibodies in the absence or presence of OvCa ascites supernatants for 16 h. e, Sorting plots showing GFP expression by CD4+ T cells that were left untreated or transduced with either control or SNAT1-expressing viruses. Representative plots from two experiments. f, Relative SLC38A1 expression levels in sorted cells after transduction (n = 6 total from two independent experiments). n values represent biologically independent samples (b, d, f). Data are shown as mean ± s.e.m (b, c, f). One-way ANOVA with Bonferroni’s multiple comparisons test (b); Two-tailed paired Student’s t-test (d); Two-tailed Student’s t-test (f). *P < 0.05, **P < 0.01, ***P < 0.001, ****P < 0.0001.
Extended Data Figure 6.
Extended Data Figure 6.. IRE1α-XBP1 activation and ER stress responses in OvCa-associated T cells isolated from mouse models of disease.
a-b, Expression of ER stress marker genes Xbp1, Xbp1s, Hspa5, and Ddit3 was determined by qRT-PCR. Circles, CD4+ T cells; squares, CD8+ T cells. a, CD45+ TCRβ+ CD4+ and CD8+ cells were sorted from tumors (n = 8), spleens (n = 4) and lymph nodes (n = 4) of mice bearing advanced p53/K-ras-driven ovarian tumors. b, CD45+ TCRβ+ CD4+ and CD8+ cells were isolated from malignant ascites (n = 6), spleens (n = 8) and lymph nodes (n = 8) of mice bearing aggressive ID8-Def29/Vegf-A OvCa, and from spleens (n = 6) of naïve mice as control. c-d, Expression of canonical regulated IRE1α-dependent decay (RIDD) target genes Bloc1s1 and Gm2a in CD4+ and CD8+ T cells isolated from different tissues of OvCa-bearing mice was analyzed by qRT-PCR. c, T cells were sorted from tumors (CD4+ T cells, n = 5; CD8+ T cells, n = 4), spleens (n = 2) and lymph nodes (n = 2) of mice bearing advanced p53/K-ras-driven ovarian tumors. d, T cells were isolated from malignant ascites (CD4+ T cells, n = 8; CD8+ T cells, n = 6), spleens (n = 13) and lymph nodes (n = 8) of mice bearing aggressive ID8-Def29/Vegf-A OvCa. Data were normalized to Actb. Data are shown as mean ± s.e.m (a-d). n values represent biologically independent samples (a-d). One-way ANOVA with Tukey’s multiple comparisons test (a, b); *P < 0.05, **P < 0.01, ***P < 0.001, ****P < 0.0001
Extended Data Figure 7.
Extended Data Figure 7.. IRE1α-XBP1 signaling alters OvCa-associated T cell function and promotes malignant progression.
a, Transcriptional profiling of splenic CD44hi CD62Llo CD4+ T cells sorted from naïve WT versus XBP1-deficient mice. Expression of the differentially regulated genes identified in Fig. 4a is shown (n = 3 per group). b-c and e-f, Analysis of WT versus XBP1-deficient CD4+ T cells isolated from mice bearing metastatic OvCa (n = 4 per group). b, Expression of previously reported RIDD target genes. c, Relative gene expression of master transcription factors controlling helper T cell differentiation. d, Intracellular staining for FoxP3 (left) and proportion of FoxP3+ CD4+ T cells from WT (n = 5) and XBP1-deficient (n = 6) mice bearing metastatic OvCa for 21 days. e, Predicted upstream regulators associated with the transcriptional changes observed. f, Enriched cellular functions in XBP1-deficient CD4+ T cells at tumor sites. Z-scores greater than 2 indicate functions predicted to be significantly increased in XBP1-deficient CD4+ T cells. g, Intracellular staining for IFN-γ in CD45+CD3+CD8+ T cells from WT and conditional XBP1-deficient mice bearing metastatic OvCa for 20–23 days. Representative plots from three independent experiments. h-i, Intracellular staining for IFN-γ in CD45+CD3+CD4+ T cells (h) and for perforin in CD45+CD3+CD8+ T cells (i) from WT and conditional XBP1-deficient mice bearing metastatic OvCa for 29 days (late stage). Representative plots from two independent experiments. j, In vivo glucose uptake by CD44hi CD4+ TILs in Xbp1f/f (n = 6) or Xbp1f/f Cd4cre (n = 7) female mice bearing metastatic OvCa. k, Representative TMRE staining for OvCa-associated CD45+TCRβ+CD44+CD4+ T cells from tumor-bearing Xbp1f/f (n = 3) or Xbp1f/f Cd4cre (n = 4) mice. l, Peritoneal wash samples were collected from mice at 24 days after tumor challenge and the proportion of OvCa-associated CD4+ T cells expressing PD-1, CTLA4, and TIM3 in WT (n = 9) or XBP1-deficient (n = 8) mice was determined. m, Female mice (n = 4 per group) were implanted with ID8-Def29/Vegf-A OvCa cells in the flank and tumor growth was monitored over time (left). Tumors were resected at day 34 and final size was confirmed ex vivo (right). n, Ascites accumulation (left) in Ern1f/f (n = 5) or Ern1f/f Cd4cre (n = 6) mice bearing ID8-Def29/Vegf-A OvCa and overall survival (right, n = 6 per group). Ern1 is the gene encoding IRE1α. Data are shown as mean ± s.e.m. (c-d, j-l). Boxes represent median ± interquartile range and whiskers indicate minimum and maximum (m, n). n values represent biologically independent mice (a-d, j-n). Two-tailed Student’s t-tests (d, j-l, m-n); Log-rank test for survival (m-n). *P < 0.05, NS, not significant; gMFI, Geometric mean fluorescence intensity.
Extended Data Figure 8.
Extended Data Figure 8.. IRE1α-XBP1 regulates IFN-γ production in ascites-exposed human CD4+ T cells.
a, IFNG expression in CD4+ T cells receiving CD3/CD28 activation for 16 h under increasing concentrations of OvCa ascites supernatants. 10% (n = 12); 50% (n = 3); 100% (n = 3). b, CD4+ T cells were activated for 12 h, incubated for additional 36 h in the presence of 25% ascites, and IFN-γ in culture supernatants was determined by ELISA. Data were normalized to final viable cell counts in each case. n = 11 independent responder CD4+ T cells in all cases with the exception of A14 (n = 9), A15 (n = 10) and A17 (n = 3). c-h, Pre-activated CD4+ T cells were treated with 4μ8C for 2 h, and 25% ascites was subsequently added to the culture for additional 12 h. c, IFN-γ in culture supernatants was quantified by ELISA (n = 14). Data are presented as relative expression compared with matching controls that were not exposed to ascites. d, FACS histogram (left) and quantitative analysis (right) for intracellular IFN-γ in CD4+ T cells (n = 16). e, Maximal OCR presented as percent response change compared with untreated controls (n = 7). f, The frequency of viable cells among total cells was determined by staining with dead cell exclusion dye (n = 12). The frequency of T-bet+ (g) and RORγt+ (h) populations among CD4+ T cells was determined by intracellular staining and presented as relative expression compared with ascites-untreated controls (n = 12). i, IFNG expression by SNAT1-overexpressing human CD4+ T cells exposed to 10% OvCa ascites (n = 6 from two independent experiments) or incubated in glucose-free media (n = 3 from two independent experiments). Data were normalized to endogenous expression of GAPDH in each sample. Data are presented as relative expression compared with control virus-transduced T cells that were not exposed to ascites or glucose deprived. Data are shown as mean ± s.e.m. (a-c, f-i). n values represent biologically independent samples (a-i). One-way ANOVA with Bonferroni’s multiple comparisons test (a, b); One-way ANOVA with Tukey’s multiple comparisons test (c, f, g, h); Two-tailed paired Student’s t-tests (d, e); Two-tailed Student’s t-tests (i); *P < 0.05, **P < 0.01, ***P < 0.001, ****P < 0.0001; gMFI, Geometric mean fluorescence intensity.
Extended Data Figure 9.
Extended Data Figure 9.. Proposed model.
Under normal (glucose-rich) conditions (a), T cells can effectively glycosylate proteins in the ER while fueling mitochondrial respiration through glycolysis. These processes endow T cells with competent effector function and anti-cancer capacity. In the tumor microenvironment (b), glucose availability could be limited and T cells may also express low levels of glucose transporters such as GLUT1. Glucose restriction not only dampens glycolysis, but also impairs optimal N-linked protein glycosylation in T cells, leading to ER stress and IRE1α-XBP1 activation. XBP1 controls the abundance of glutamine transporters in ER-stressed T cells and consequently limits the influx of glutamine necessary to sustain mitochondrial respiration under glucose deprivation. Therefore, T cells become dysfunctional and incapable of controlling malignant progression. Disabling IRE1α-XBP1 signaling may be useful to enhance T cell mitochondrial function and anti-cancer capacity in a harsh tumor microenvironment.
Figure 1.
Figure 1.. IRE1α-XBP1 activation in human OvCa-infiltrating T cells.
a, XBP1 splicing assays for CD4+ or CD8+ T cells isolated from ascites or solid tumors of OvCa patients, or from blood of cancer-free female donors. XBP1s, spliced form; XBP1u, unspliced form. Data were generated from three independent experiments. b, Frequency of spliced XBP1/total XBP1 in T cells sorted from the indicated sources (n = 8/group). c-e, Pairwise analyses for sorted tumor-associated CD4+ (circles) and CD8+ (squares) T cells (n = 22 total). c, ER stress response gene expression. d, Proportion of CD45+CD3+ OvCa-infiltrating T cells versus expression of the indicated genes in T cells from the same specimen. e, IFNG versus ER stress response genes in each sample. n-values correspond to biologically independent samples (b-e). One-way ANOVA with Tukey’s post-test, boxes represent median ± interquartile range and whiskers indicate minimum and maximum (b); Spearman’s rank correlation test, Spearman coefficient (r) with p-value (two-tailed), 95% confidence intervals (CI) for all correlation analyses (c-e) are described in Supplemental Table 2.
Figure 2.
Figure 2.. OvCa ascites limits glucose uptake and causes IRE1α/XBP-mediated mitochondrial dysfunction in human CD4+ T cells.
a-f, T cells were activated via CD3/CD28 stimulation for 16 h in the absence or presence of OvCa ascites supernatants at the indicated concentrations. Histograms (a) and quantification (b) of XBP1s staining (n = 16); Iso, isotype control. c, SLC2A1 expression was determined via qRT-PCR (n = 48). Immunoblot and quantification (d) of GLUT1 in ascites-exposed CD4+ T cells. Density of GLUT1 was normalized to β-ACTIN, and data are shown as the relative expression compared with the untreated control (n = 4 for 10% and 50% ascites; n = 2 for 100% ascites, all from two independent experiments). e, Glucose uptake was assessed using 2-NBDG and XBP1 was determined in the same sample. Symbols depict ascites from 3 independent patients tested at increasing concentrations on CD4+ T cells from multiple donors (n = 37). Baseline ECAR (f) and OCR profile (g) of CD4+ T cells exposed to ascites (n = 16). CD4+ T cells were treated with 4μ8C (h, i) or GlcNAc (j) for 1 h and then stimulated via CD3/CD28 for 16 h in the presence of 10% ascites. h, XBP1s determined by FACS (n = 7). i, OCR profile in 4μ8C-treated T cells exposed to ascites (n = 9). j, OCR for GlcNAc-treated T cells exposed to ascites (n = 5). Data are shown as mean ± s.e.m (b, c, d, f, g, i, j). n-values represent biologically independent samples (b-k). One-way ANOVA with Tukey’s post-test (b); Two-tailed Student’s t-test (c, f); One-way ANOVA with Bonferroni’s post-test (d). Spearman’s rank correlation test, 95% CI −0.9076 to −0.6760 (e); Two-tailed paired Student’s t-test (h); *P < 0.05, **P < 0.01, ***P < 0.001, ****P < 0.0001. MFI, Mean fluorescence intensity.
Figure 3.
Figure 3.. XBP1 limits glutamine influx in glucose-deprived CD4+ T cells.
a, c-d, Naïve splenic CD4+ T cells isolated from WT (solid bars) or XBP1-deficient (hatched bars) mice were activated via CD3/CD28 stimulation for 48 h and then incubated for 6 h in the indicated media. a, Maximal OCR of T cells in the presence or absence of glucose (n = 5). b, Glutamine tracing was performed as described in the methods and relative abundance of total 13C-labeled metabolites was determined (n = 4). Immunoblot (c) and quantification (d) of glutamine transporters in the indicated T cells (n = 5 total from five independent experiments). OCR profile (e) and maximal OCR (f) in DMKG-treated WT T cells (n = 14). Data are presented as relative expression compared with WT T cells incubated in the presence of glucose (a, d, f). OCR profile (g) and maximal OCR (h) for SNAT1-overexpressing human CD4+ T cells exposed to OvCa ascites (n = 4). Data are shown as relative expression compared with control virus-transduced T cells that were not exposed to ascites. n-values represent biologically independent samples (a, b, d, f, h). Data are shown as mean ± s.e.m. One-way ANOVA with Tukey’s post-test (a, b, d); Two-tailed paired Student’s t-test (f, h); *P < 0.05, **P < 0.01, ***P < 0.001, ****P < 0.0001.
Figure 4.
Figure 4.. T cell-intrinsic IRE1α-XBP1 signaling promotes OvCa progression.
a, Transcriptional profiling of WT versus XBP1-deficient CD4+ T cells sorted from the peritoneal cavity of mice bearing metastatic ID8-Def29/VegfA OvCa for 20 days. Top upregulated genes in XBP1-deficient CD4+ T cells are shown (n = 4). b, FACS analyses of OvCa-associated CD4+ T cells from the indicated mice bearing metastatic OvCa for 20–23 days. Representative intracellular staining for IFN-γ and IL-17 (left) and global IFN-γ analysis (right) in CD45+CD3+CD4+ T cells (n = 9). c, IFN-γ secretion by CD4+ T cells isolated from the peritoneal cavity of the indicated OvCa-bearing mice upon ex vivo stimulation with OVA peptide (n = 6 for all groups except for XBP1-deficient hosts challenged with ID8-ova). d, Growth of p53/K-ras-driven ovarian tumors in hosts reconstituted with bone marrow from the indicated genotypes (n = 6). e, Ascites accumulation (left, n = 5–6) and overall survival (right, n = 8–13) for the indicated mice bearing ID8-Def29/Vegf-A OvCa. f, Imaging (left) and quantification (right) of peritoneal carcinomatosis in Ern1f/f or Ern1f/f Cd4cre mice bearing luciferase-expressing ID8 OvCa for 20 days (n = 5). g, Survival rates for mice depicted in panel f. n-values represent biologically independent mice (a-g). Data are shown as mean ± s.e.m. (b, c, d, e). Boxes represent median ± interquartile range and whiskers indicate minimum and maximum (f). Two-tailed Student’s t-test (b); One-way ANOVA with Tukey’s post-test (c); Two-tailed Mann-Whitney test (d, e, f); Log-rank test (e, g). *P < 0.05, **P < 0.01, ****P < 0.0001.

Comment in

References

    1. Chang CH et al. Metabolic Competition in the Tumor Microenvironment Is a Driver of Cancer Progression. Cell 162, 1229–1241, doi:10.1016/j.cell.2015.08.016 (2015). - DOI - PMC - PubMed
    1. Ho PC et al. Phosphoenolpyruvate Is a Metabolic Checkpoint of Anti-tumor T Cell Responses. Cell 162, 1217–1228, doi:10.1016/j.cell.2015.08.012 (2015). - DOI - PMC - PubMed
    1. Scharping NE et al. The Tumor Microenvironment Represses T Cell Mitochondrial Biogenesis to Drive Intratumoral T Cell Metabolic Insufficiency and Dysfunction. Immunity 45, 374–388, doi:10.1016/j.immuni.2016.07.009 (2016). - DOI - PMC - PubMed
    1. Anderson KG, Stromnes IM & Greenberg PD Obstacles Posed by the Tumor Microenvironment to T cell Activity: A Case for Synergistic Therapies. Cancer Cell 31, 311–325, doi:10.1016/j.ccell.2017.02.008 (2017). - DOI - PMC - PubMed
    1. Chae CS, Teran-Cabanillas E & Cubillos-Ruiz JR Dendritic cell rehab: new strategies to unleash therapeutic immunity in ovarian cancer. Cancer immunology, immunotherapy : CII, doi:10.1007/s00262-017-1958-2 (2017). - DOI - PMC - PubMed

REFERENCES (PART TWO)

    1. Lee AH, Scapa EF, Cohen DE & Glimcher LH Regulation of hepatic lipogenesis by the transcription factor XBP1. Science 320, 1492–1496, doi:10.1126/science.1158042 (2008). - DOI - PMC - PubMed
    1. Iwawaki T, Akai R, Yamanaka S & Kohno K Function of IRE1 alpha in the placenta is essential for placental development and embryonic viability. Proc Natl Acad Sci U S A 106, 16657–16662, doi:10.1073/pnas.0903775106 (2009). - DOI - PMC - PubMed
    1. Lee AH, Iwakoshi NN, Anderson KC & Glimcher LH Proteasome inhibitors disrupt the unfolded protein response in myeloma cells. Proc Natl Acad Sci U S A 100, 9946–9951, doi:10.1073/pnas.1334037100 (2003). - DOI - PMC - PubMed
    1. Yuan M, Breitkopf SB, Yang X & Asara JM A positive/negative ion-switching, targeted mass spectrometry-based metabolomics platform for bodily fluids, cells, and fresh and fixed tissue. Nature protocols 7, 872–881, doi:10.1038/nprot.2012.024 (2012). - DOI - PMC - PubMed
    1. Langmead B, Trapnell C, Pop M & Salzberg SL Ultrafast and memory-efficient alignment of short DNA sequences to the human genome. Genome biology 10, R25, doi:10.1186/gb-2009-10-3-r25 (2009). - DOI - PMC - PubMed

Publication types

MeSH terms