. 2018 Oct;562(7726):210-216.
doi: 10.1038/s41586-018-0571-7. Epub 2018 Oct 10.

Genome-wide association studies of brain imaging phenotypes in UK Biobank

Affiliations

Genome-wide association studies of brain imaging phenotypes in UK Biobank

Lloyd T Elliott et al. Nature. 2018 Oct.

Abstract

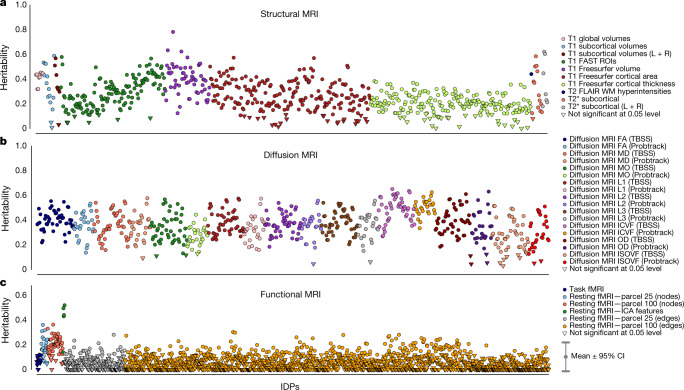
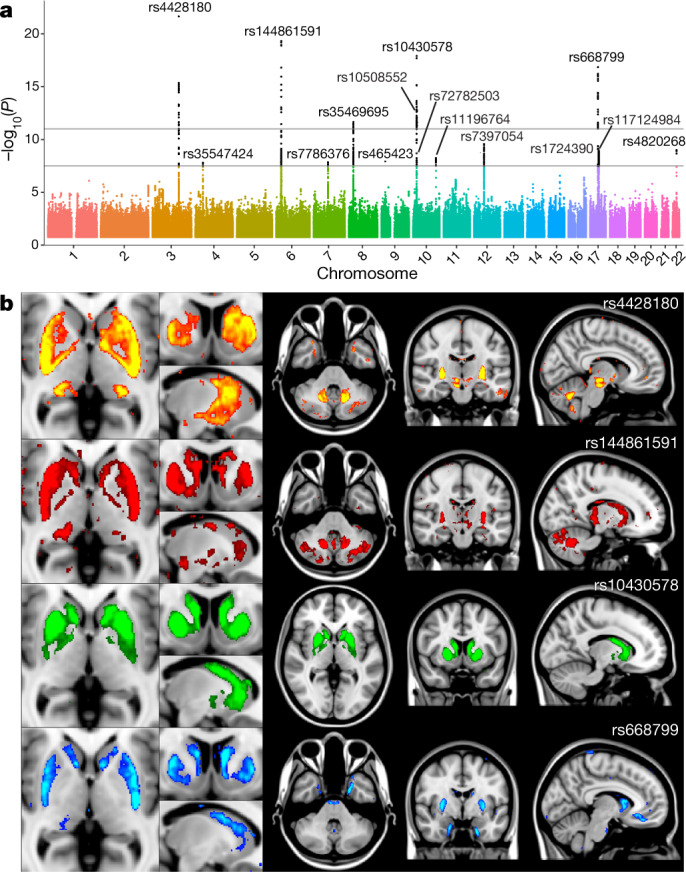
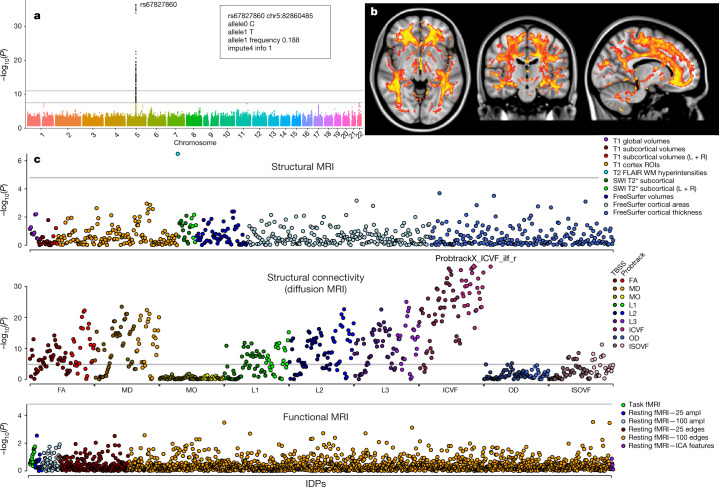
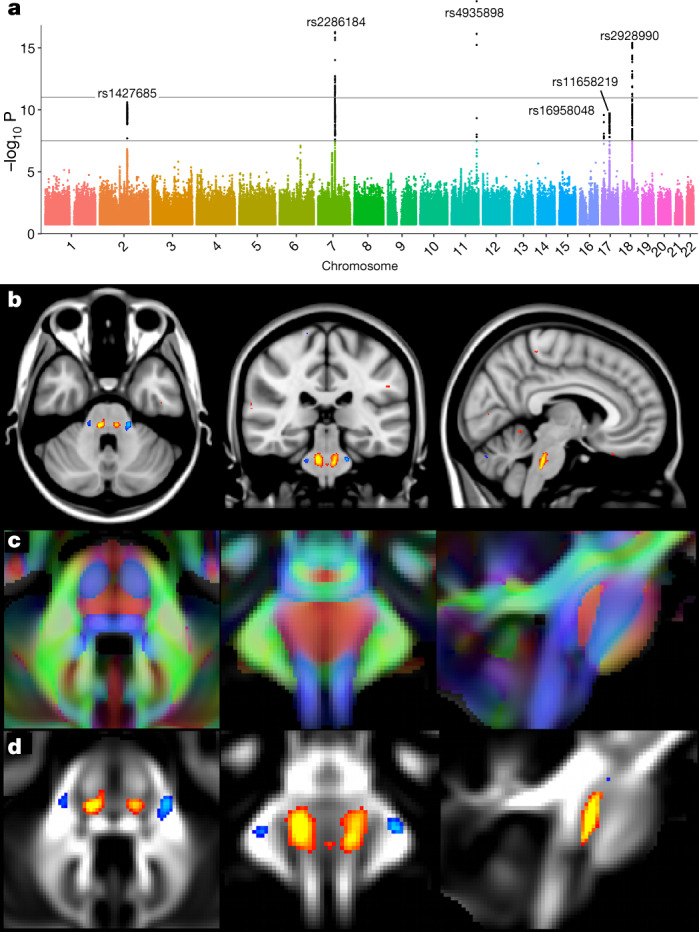
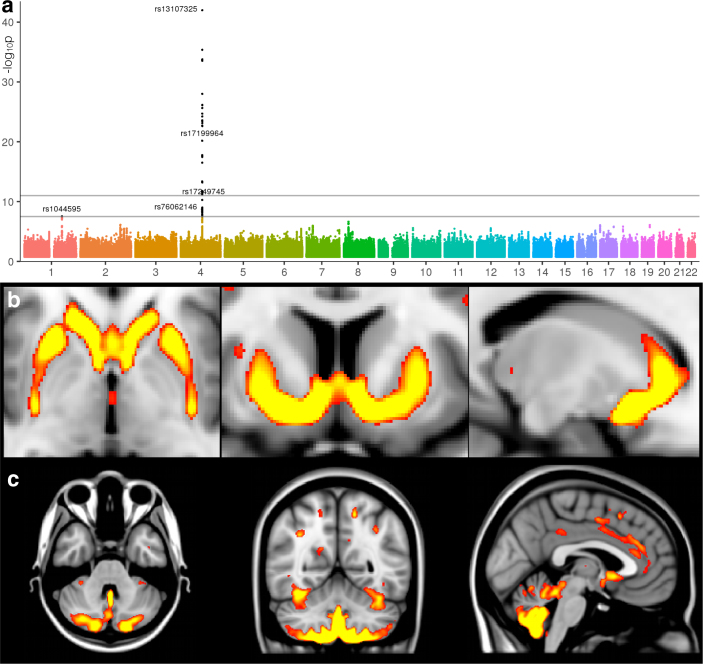
The genetic architecture of brain structure and function is largely unknown. To investigate this, we carried out genome-wide association studies of 3,144 functional and structural brain imaging phenotypes from UK Biobank (discovery dataset 8,428 subjects). Here we show that many of these phenotypes are heritable. We identify 148 clusters of associations between single nucleotide polymorphisms and imaging phenotypes that replicate at P < 0.05, when we would expect 21 to replicate by chance. Notable significant, interpretable associations include: iron transport and storage genes, related to magnetic susceptibility of subcortical brain tissue; extracellular matrix and epidermal growth factor genes, associated with white matter micro-structure and lesions; genes that regulate mid-line axon development, associated with organization of the pontine crossing tract; and overall 17 genes involved in development, pathway signalling and plasticity. Our results provide insights into the genetic architecture of the brain that are relevant to neurological and psychiatric disorders, brain development and ageing.


Conflict of interest statement

J.M. is a co-founder and director of GENSCI Ltd. S.M.S. is a co-founder of SBGneuro. The other authors declare no competing interests.

Figures

Fig. 1
Fig. 1. Estimated heritability of IDPs.
Estimated heritability (y-axis) of all of the IDPs analysed (n = 8,428 subjects; see Methods for heritability calculation details). IDPs were split into three broad groups. a, Structural MRI. b, Diffusion MRI. c, Functional MRI. Points are coloured according to IDP groups. Circles and inverted triangles, respectively, are used to identify IDPs that do and do not have heritability significantly different from 0 at the 5% significance level. The mean 95% confidence interval (CI) error bar size is indicated at the bottom right.
Fig. 2
Fig. 2. Manhattan plot and spatial mapping of the associations between T2* in the putamen and four SNPs.
a, The Manhattan plot relates to the original GWAS for the IDP T2* in the bilateral putamen. The lower grey line indicates the –log10(P value) threshold of 7.5 and the upper line the threshold of 11 (see main text). b, The spatial maps show that the four SNPs (one per row) most strongly associated with T2* in the putamen have distinct voxelwise patterns of effect across the whole brain: the effect of rs4428180 (TF) is found in the dorsal putamen and body of the caudate nucleus, but also in the right subthalamic nucleus and substantia nigra, red nucleus, lateral geniculate nucleus of the thalamus and dentate nucleus; rs144861591 (HFE) in the dorsal striatum, subthalamic nucleus, dentate nucleus and Crus I/II of the cerebellum; rs10430578 (SLC39A12) in the whole dorsal striatum and pallidum; and rs668799 (COASY) in the whole dorsal striatum, subgenual cingulate cortex and entorhinal cortex. The standard MNI152 T1 image is used as background for the spatial maps (left is right). All group difference images (colour overlays) are thresholded at a T2* difference of 0.6 ms. These voxelwise SNP association maps were calculated from the discovery sample of 8,428 subjects (see main text).
Fig. 3
Fig. 3. Manhattan plot, spatial mapping and PheWAS plot relating to the association between the dMRI ICVF measure and rs67827860 (VCAN).
a, The Manhattan plot relates to the original IDP GWAS with the strongest association (ICVF in the right inferior longitudinal fasciculus using tractography, associated with rs67827860). The ICVF parameter, estimated from the NODDI modelling, aims to quantify predominantly intra-axonal water in white matter, by estimating where water diffusion is restricted. Summary details of SNP rs67827860 are given in the top right box. The lower grey line indicates the –log10(P value) threshold of 7.5 and the upper line the threshold of 11. b, Spatial mapping of rs67827860 against voxelwise ICVF in white matter (ICVF was averaged across all 4,957 subjects with zero copies of the non-reference allele, and the average from all 2,304 subjects that had one copy was subtracted from that, for display in colour here; the difference was thresholded at 0.005 (unitless fractional measure)). Unlike the examples of (spatially) very focal effects in T2* and grey matter volume in Fig. 2 and Extended Data Fig. 1, the effects of this SNP are extremely widespread across most of the white matter tracts (associated with 45 out of the 199 IDPs in cluster 11, Supplementary Table 5). c, The PheWAS plot for SNP rs67827860 shows the association (−log10(P)) on the y-axis for the SNP with each of the 3,144 IDPs. The IDPs are arranged on the x-axis in the three panels: structural MRI IDPs (top), dMRI IDPs (middle) and fMRI IDPs (bottom). Points are coloured to delineate subgroups of IDPs. Grey lines show the Bonferroni multiple testing threshold of 4.79. In addition to the IDP of white matter hyperintensities volume, there is a notable association with numerous dMRI IDPs (especially diffusion tensor-derived measures of fractional anisotropy, mean diffusivity and L1, L2 and L3 eigenvalues of the diffusion tensor, as well as additional ICVF measures).
Fig. 4
Fig. 4. Manhattan plot and spatial mapping of the association between the dMRI tensor mode measure and SNP rs4935898 (ROBO3).
a, The Manhattan plot relates to the original GWAS for the IDP of tensor mode in the crossing pontine tract associated with rs4935898. bd, Tensor mode was averaged across all 6,807 subjects with approximately zero copies of the non-reference allele, and the average from all 703 subjects that had approximately one copy was subtracted from that, for display in red/yellow–blue/light blue here, thresholded at 0.05 (b, d). b, Results are shown overlaid on the MNI152 T1 structural image; by contrast, background in c and d is the UK Biobank average fractional anisotropy image, which shows clear tract structure within the brainstem. c, Orientation of the fibre tracts (in red, running left to right). The spatial distribution (not shown) for the effects of rs2286184 (SEMA3D) on tensor mode is almost identical to that of rs4935898, being again extremely spatially specific, with no extended effect elsewhere in the brain. These voxelwise SNP association maps were calculated from the discovery sample of 8,428 subjects (see main text).
Extended Data Fig. 1
Extended Data Fig. 1. Manhattan plot and spatial mapping of the associations between grey matter volume and rs13107325 (SLC39A8).
a, The Manhattan plot relates to the original GWAS for the IDP of grey matter volume in the left ventral striatum. b, c, Spatial mapping of rs13107325 against voxelwise local grey matter volume (grey matter was averaged across all 1,181 subjects with one copy of the non-reference allele, and the average from all 7,215 subjects that had zero copies was subtracted from that, for display in colour here; the difference was thresholded at 0.015 (unitless relative measure of local grey matter volume)). The maps show that the effect of rs13107325 is found more generally bilaterally in the ventral caudate, putamen, ventral striatum, anterior cingulate cortex, and with a strong cerebellar contribution (lobules VI–X), particularly in the prefrontal-projecting Crus I/II, which are selectively expanded in humans.
Extended Data Fig. 2
Extended Data Fig. 2. Partitioning of heritability by functional category.
The plot shows the proportion of IDPs in each of the 23 IDP groupings (x-axis) that show a nominal enrichment P value <0.05 (two-sided tests, uncorrected P values, see Methods) for the 24 functional categories (y-axis). The total number of such IDPs for each category is given on the right edge of the plot. The number of IDPs in each IDP group is given in parentheses in the x-axis labels. The proportion of the genome annotated by each functional category is given in parentheses in the y-axis labels.

Comment in

Similar articles

Cited by

References

    1. Toga, A. W. Brain Mapping: An Encyclopedic Reference (Academic, Amsterdam, 2015).
    1. Sudlow, C. et al. UK biobank: an open access resource for identifying the causes of a wide range of complex diseases of middle and old age. PLoS Med. 12, e1001779 (2015). - PMC - PubMed
    1. Allen, N. et al. UK Biobank: Current status and what it means for epidemiology. Health Policy Technol. 1, 123–126 (2012).
    1. Miller, K. L. et al. Multimodal population brain imaging in the UK Biobank prospective epidemiological study. Nat. Neurosci. 19, 1523–1536 (2016). - PMC - PubMed
    1. Alfaro-Almagro, F. et al. Image processing and quality control for the first 10,000 brain imaging datasets from UK Biobank. Neuroimage166, 400–424 (2018). - PMC - PubMed

Publication types

MeSH terms