. 2018 Sep;8(8):743-753.
doi: 10.21037/qims.2018.09.02.

Ultra-wide optical coherence tomography angiography in diabetic retinopathy

Affiliations

Ultra-wide optical coherence tomography angiography in diabetic retinopathy

Qinqin Zhang et al. Quant Imaging Med Surg. 2018 Sep.

Abstract

Background: To implement an ultra-wide optical coherence tomography angiography imaging (UW-OCTA) modality in eyes with diabetic retinopathy (DR) with the aim of quantifying the burden of microvascular disease at baseline and subsequent clinic visits.

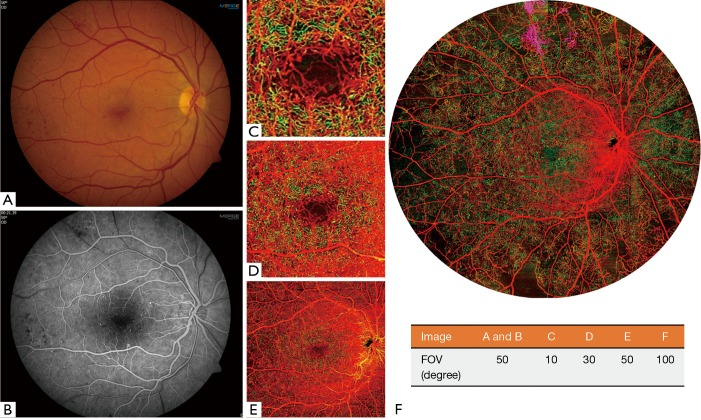
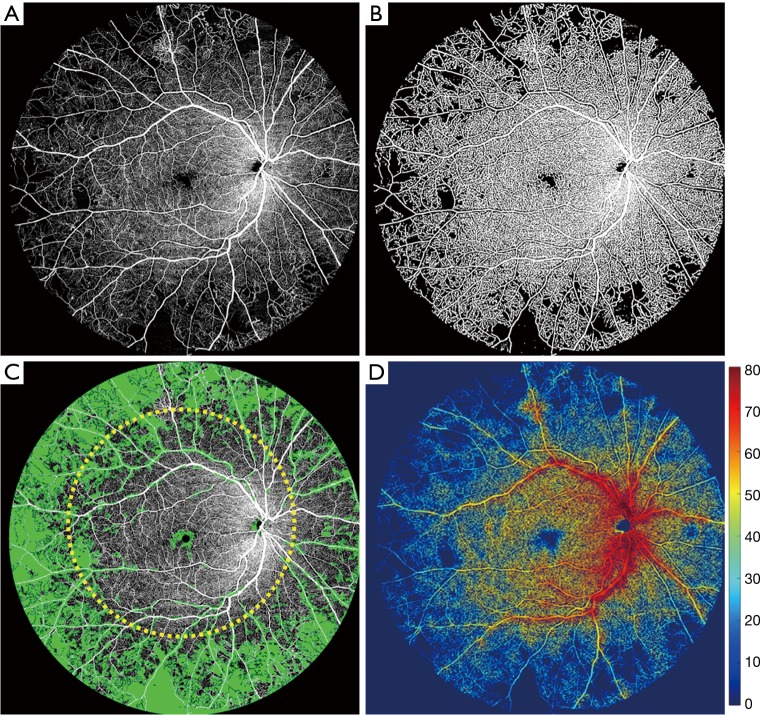
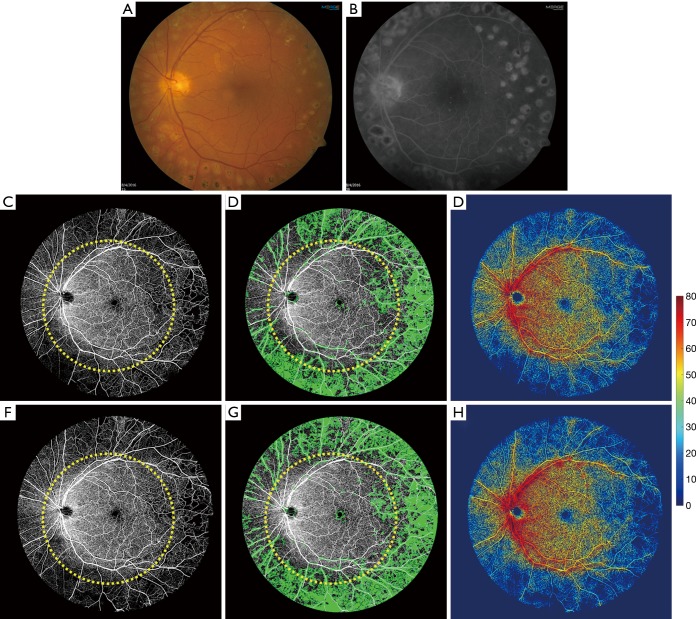
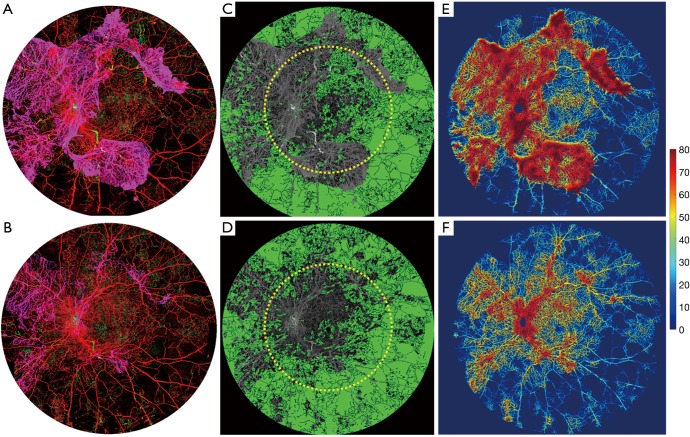
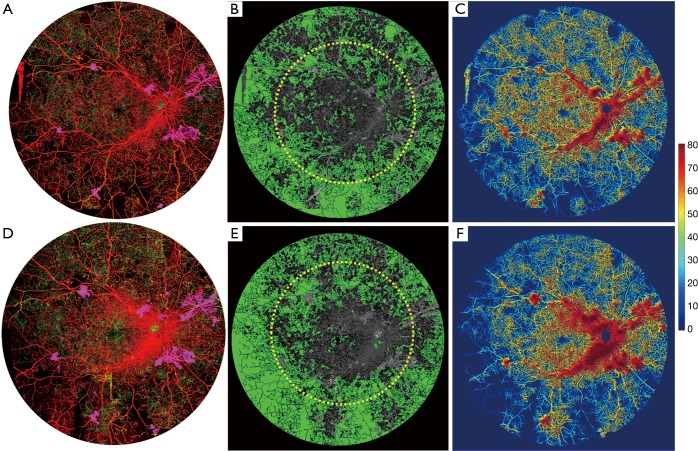
Methods: UW-OCTA was implemented on a 1,060 nm swept source (SS) OCTA engine running at 100 kHz A-line rate with a motion tracking mechanism. A montage scanning protocol was used to capture a 100-degree field of view (FOV) using a 4×4 grid of sixteen total individual 6×6 mm2 scans. Typical OCTA images with a FOV of 3×3, 6×6 and 12×12 mm2 were obtained for comparison. DR patients were scanned at baseline and follow-up. They were treated at the clinician's discretion. Vessel density and non-perfusion area maps were calculated based on the UW-OCTA images.

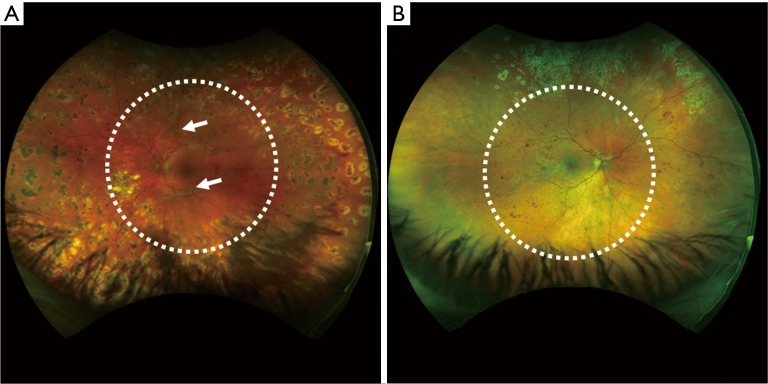
Results: Three proliferative DR patients were included in the study. UW-OCTA images provided more detailed visualization of vascular networks compared to 50-degree fluorescein angiography (FA) and showed higher burden of pathology in the retinal periphery that was not captured by typical OCTA. Neovascularization complexes were clearly detected in the two patients with active PDR. Vessel density and non-perfusion maps were used to measure progressive capillary non-perfusion and regression of neovascularization between visits.

Conclusions: UW-OCTA provides approximately 100-degree OCTA images of the fundus comparable to that of wide-angle fundus photography, and may be more applicable in conditions such as DR which affect the peripheral retina in contrast to standard OCTA.

Keywords: Diabetic retinopathy (DR); field of view (FOV); non-perfusion; optical coherence tomography angiography (OCTA); swept source OCTA; vessel density.


Conflict of interest statement

Conflicts of Interest: Dr. Wang disclosed intellectual property owned by the Oregon Health and Science University and the University of Washington related to OCT angiography, and licensed to commercial entities, which are related to the technology and analysis methods described in parts of this manuscript. Dr. Wang received an innovative research award from Research to Prevent Blindness. He is a consultant to Carl Zeiss Meditec, and Insight Photonic Solutions.

Figures

Figure 1
Figure 1
The clinical images and OCTA images with different field of views (FOVs) of a 33-year-old man (patient #1) with a diagnosis of non-high risk PDR in his right eye. (A) 50-degree color fundus image; (B) 50-degree early phase of FA image; (C,D,E) typical OCTA color-coded images with a FOV of 3×3, 6×6, and 12×12 mm2 scans, respectively; (F) the ultra-wide OCTA color-coded image with a FOV of approximately 100 degrees. Red indicates superficial retinal layer (SRL); Green indicates deep retinal layer (DRL); Purple indicates the vitreous retinal layer (VRL) to demonstrate neovascularization consistent with PDR. The FOVs of each image are listed in the table.
Figure 2
Figure 2
Ultra-wide OCTA image of the whole retinal layer (WRL) in gray scale of patient #1 and the corresponding quantification process. (A) The original ultra-wide OCTA image; (B) binary OCTA image that was used for vessel density and further non-perfusion area measurements; (C) the OCTA image overlaid with non-perfusion area map in green color. Typical 50-degree FOV is outlined approximately with yellow dashed circle. The non-perfusion area within the outlined circle is measured with 11.83 mm2, whereas that of the outside is 108.59 mm2. (D) The vessel density map overlaid with the binary OCTA image. The color-bar indicates the degree of the vessel density in percentage.
Figure 3
Figure 3
Clinical images and ultra-wide OCTA images of a 54-year-old man (patient #2) with a diagnosis of inactive PDR on his left eye. The clinical images were taken in his first visit. (A) 50-degree color fundus image; (B) 50-degree late phase of FA image; (C,F) the original ultra-wide OCTA images at his baseline and 1-year follow-up visit; (D,G) the non-perfusion map in green color of his first and follow-up visit; (E,H) vessel-density map overlaid with binary map of the two different visits. The yellow circle overlaid on OCTA images is a 50-degree circle to identify the typical clinical FOV.
Figure 4
Figure 4
Optos ultra-wide color fundus image of a 31-year-old female (patient #3) with a diagnosis of (A) severe PDR on her left eye and (B) PDR on her right eye. Typical 50-degree FOV is outlined with white dashed circle line.
Figure 5
Figure 5
Ultra-wide OCTA image of a 31-year-old woman (patient #3) with a diagnosis of severe PDR on her left eye. (A,B) Ultra-wide color-coded OCTA images at the first visit and 1-month follow-up visit after intravitreal bevacizumab and panretinal photocoagulation; (C,D) the non-perfusion map in green color of his first and second visit; (E,F) vessel density map of her first and second visit. The yellow circle overlaid on OCTA images is a 50-degree circle to identify the typical clinical FOV. On (A) and (E), red indicates superficial retinal layer (SRL); green indicates deep retinal layer (DRL); purple indicates the vitreous retinal layer (VRL) to demonstrate the neovascularization.
Figure 6
Figure 6
Ultra-wide OCTA image of a 31-year-old woman (patient #3) with a diagnosis of PDR in her right eye. (A,D) Ultra-wide color-coded OCTA images of the first visit and one-month follow-up visit; (B,E) the non-perfusion map in green color of his first and second visit; (C,F) Vessel-density map at her baseline and 1 month follow-up visit. The yellow circle overlaid on OCTA images is a 50-degree circle to identify the typical clinical FOV. On (A) and (D), red indicates superficial retinal layer (SRL); Green indicates deep retinal layer (DRL); Purple indicates the vitreous retinal layer (VRL) to demonstrate the neovascularization.

References

    1. Klein R, Klein BE, Moss SE, Davis MD, DeMets DL. The Wisconsin epidemiologic study of diabetic retinopathy. III.Prevalence and risk of diabetic retinopathy when age at diagnosis is 30 or more years. Arch Ophthalmol 1984;102:527-532. 10.1001/archopht.1984.01040030405011 - DOI - PubMed
    1. Adhi M, Brewer E, Waheed NK, Duker JS. Analysis of morphological features and vascular layers of choroid in diabetic retinopathy usingspectral-domain optical coherence tomography. JAMA Ophthalmol 2013;131:1267-74. 10.1001/jamaophthalmol.2013.4321 - DOI - PMC - PubMed
    1. Hwang TS, Gao SS, Liu L, Lauer AK, Bailey ST, Flaxel CJ, Wilson DJ, Huang D, Jia Y. Automated quantification of capillary nonperfusion using optical coherence tomography angiography in diabetic retinopathy. JAMA Ophthalmol 2016;134:367-73. 10.1001/jamaophthalmol.2015.5658 - DOI - PMC - PubMed
    1. Hwang TS, Jia Y, Gao SS, Bailey ST, Lauer AK, Flaxel CJ, Wilson DJ, Huang D. Optical coherence tomography angiography features of diabetic retinopathy. Retina 2015;35:2371-6. 10.1097/IAE.0000000000000716 - DOI - PMC - PubMed
    1. Ishibazawa A, Nagaoka T, Takahashi A, Omae T, Tani T, Sogawa K, Yokota H, Yoshida A. Optical coherence tomography angiography in diabetic retinopathy: a prospective pilot study. Am J Ophthalmol 2015;160:35-44.e1. 10.1016/j.ajo.2015.04.021 - DOI - PubMed