. 2018 Aug 28:11:20-38.
doi: 10.1016/j.omto.2018.08.002. eCollection 2018 Dec 21.

Checkpoint Blockade Reverses Anergy in IL-13Rα2 Humanized scFv-Based CAR T Cells to Treat Murine and Canine Gliomas

Affiliations

Checkpoint Blockade Reverses Anergy in IL-13Rα2 Humanized scFv-Based CAR T Cells to Treat Murine and Canine Gliomas

Yibo Yin et al. Mol Ther Oncolytics. .

Abstract

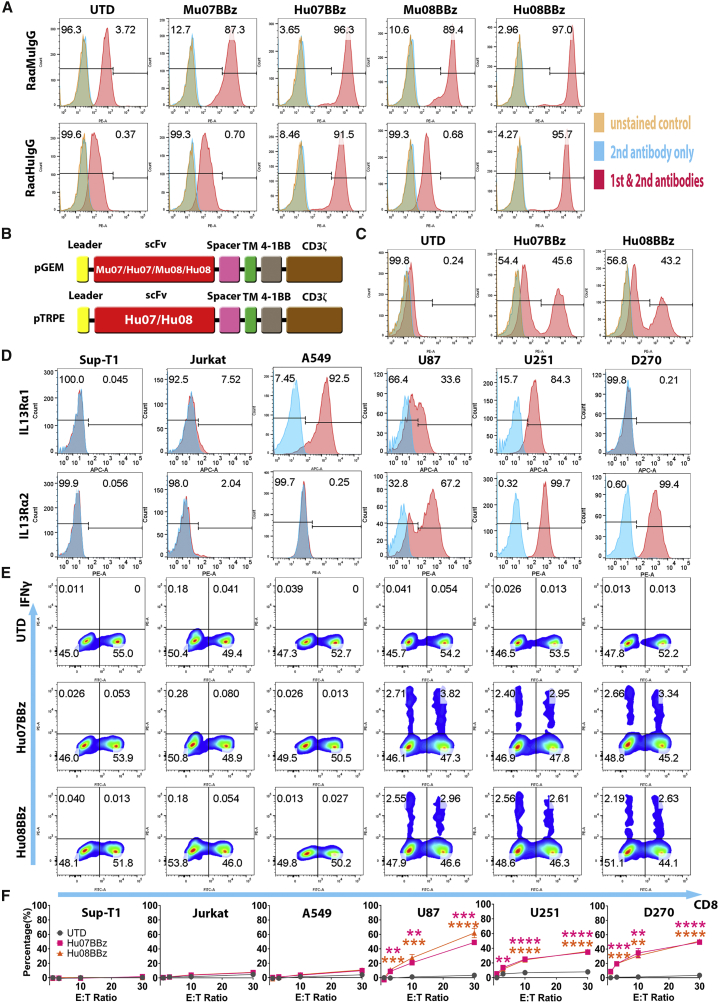
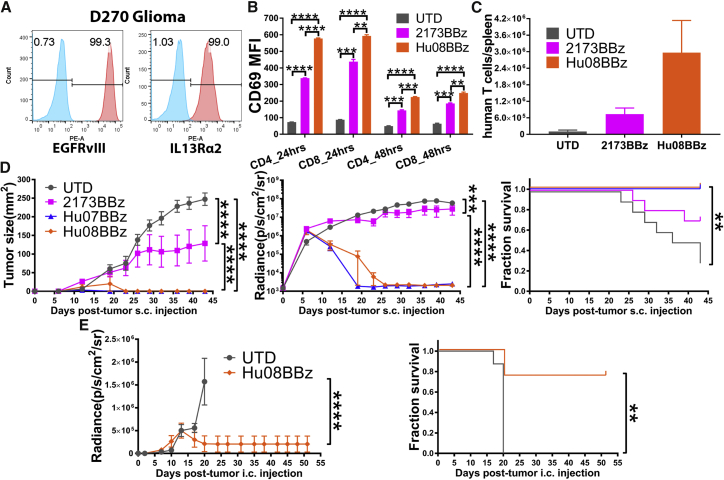
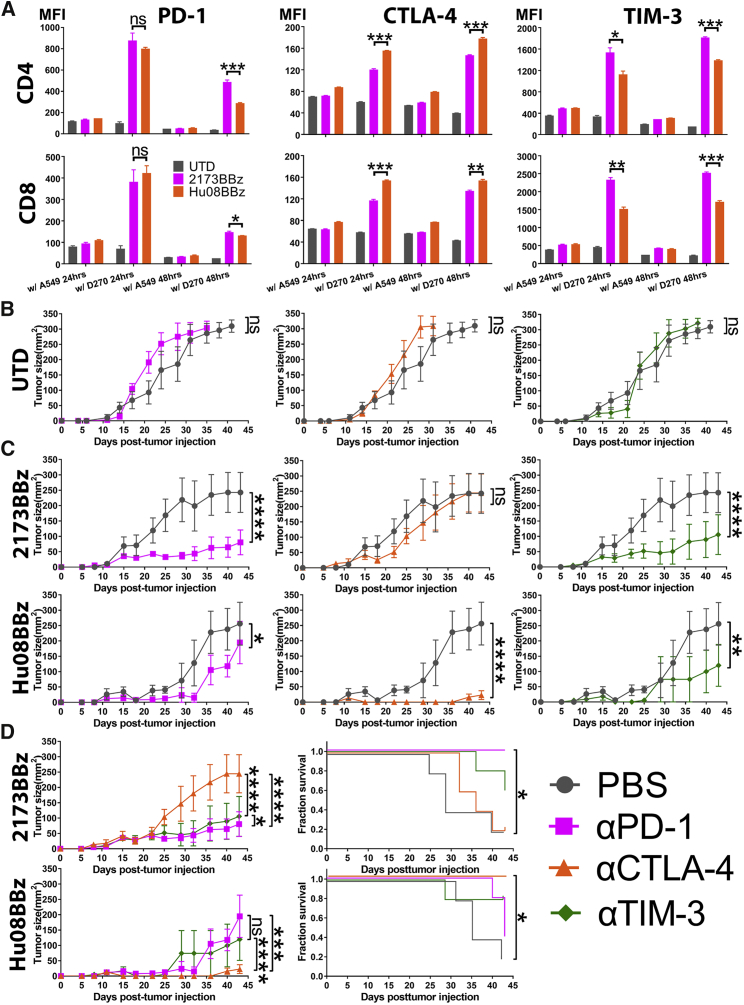
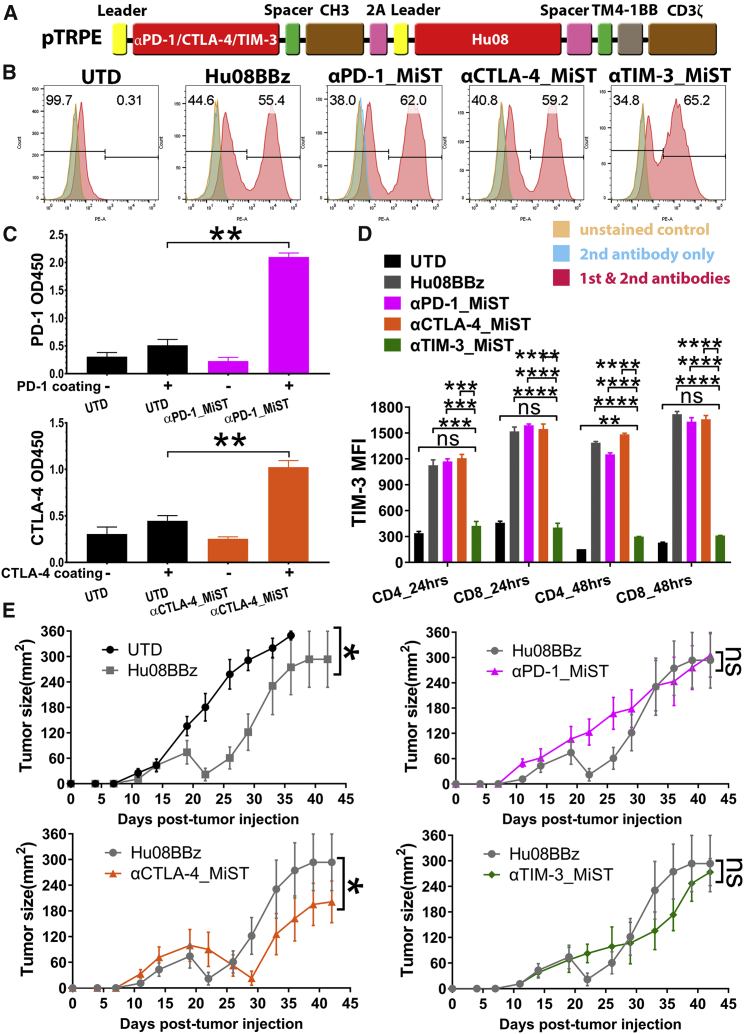
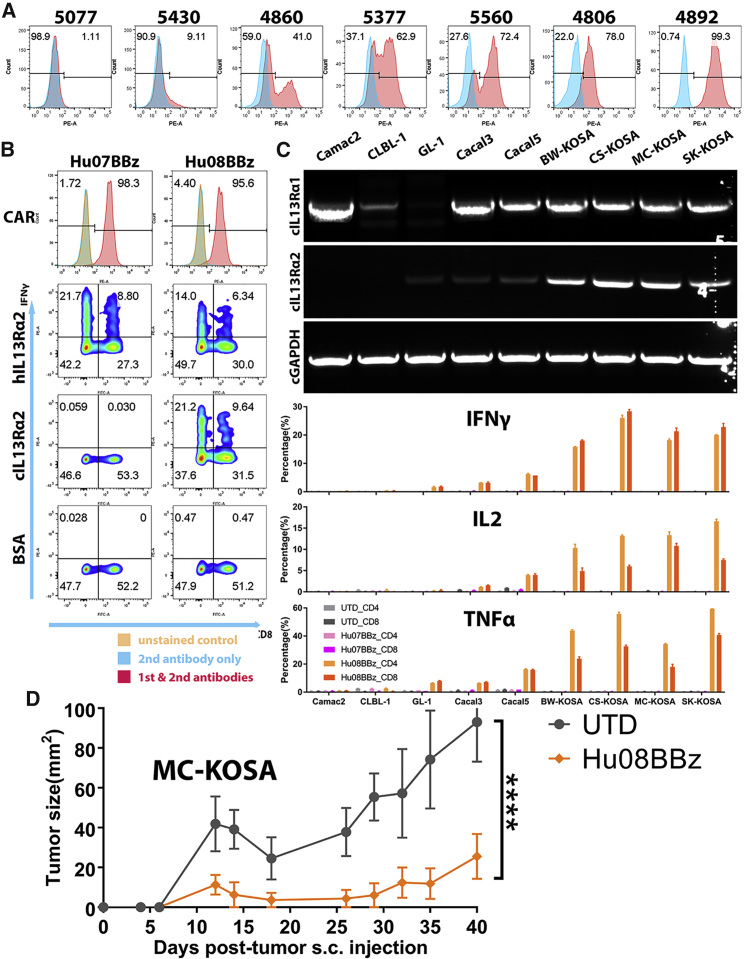
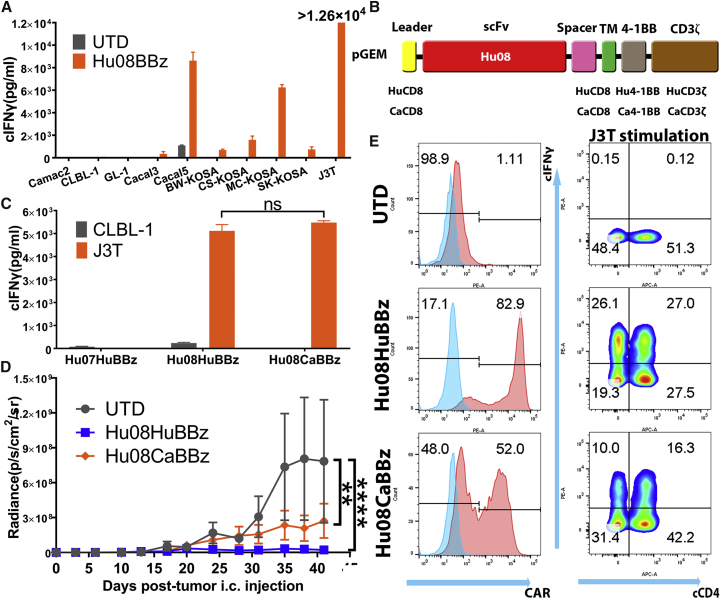
We generated two humanized interleukin-13 receptor α2 (IL-13Rα2) chimeric antigen receptors (CARs), Hu07BBz and Hu08BBz, that recognized human IL-13Rα2, but not IL-13Rα1. Hu08BBz also recognized canine IL-13Rα2. Both of these CAR T cell constructs demonstrated superior tumor inhibitory effects in a subcutaneous xenograft model of human glioma compared with a humanized EGFRvIII CAR T construct used in a recent phase 1 clinical trial (ClinicalTrials.gov: NCT02209376). The Hu08BBz demonstrated a 75% reduction in orthotopic tumor growth using low-dose CAR T cell infusion. Using combination therapy with immune checkpoint blockade, humanized IL-13Rα2 CAR T cells performed significantly better when combined with CTLA-4 blockade, and humanized EGFRvIII CAR T cells' efficacy was improved by PD-1 and TIM-3 blockade in the same mouse model, which was correlated with the levels of checkpoint molecule expression in co-cultures with the same tumor in vitro. Humanized IL-13Rα2 CAR T cells also demonstrated benefit from a self-secreted anti-CTLA-4 minibody in the same mouse model. In addition to a canine glioma cell line (J3T), canine osteosarcoma lung cancer and leukemia cell lines also express IL-13Rα2 and were recognized by Hu08BBz. Canine IL-13Rα2 CAR T cell was also generated and tested in vitro by co-culture with canine tumor cells and in vivo in an orthotopic model of canine glioma. Based on these results, we are designing a pre-clinical trial to evaluate the safety of canine IL-13Rα2 CAR T cells in dog with spontaneous IL-13Rα2-positive glioma, which will help to inform a human clinical trial design for glioblastoma using humanized scFv-based IL-13Rα2 targeting CAR T cells.

Keywords: CAR; CTLA-4; IL-13Rα2; PD-1; TIM-3; canine; chimeric antigen receptor; glioblastoma; immune checkpoint blockade; minibody.


Figures

Figure 1
Figure 1
Humanized IL-13Rα2-Targeting CAR T Cells (A) Flow cytometric detection of CAR expression by human T cells, after mRNA electroporation of murine and humanized scFv- (07 and 08) based CAR constructs using rabbit anti-mouse or rabbit anti-human IgG antibodies. (B) Vector maps of tested anti-IL-13Rα2 CAR design based on the size of each components. (C) CAR expression staining of the humanized IL-13Rα2 CAR transduced T cells used in the co-culture experiments. (D) IL-13Rα1 and IL-13Rα2 expression analysis on the human tumor cell lines (Sup-T1, Jurkat, A549, U87, U251, and D270) with isotype antibodies staining control in blue. (E) Flow-based intracellular cytokine (IFNγ) staining of the humanized IL-13Rα2 CAR T cells co-cultured with human tumor cell lines in (D) controlled with un-transduced T cells (UTD). Human CD8 was stained to distinguish the CD4-positive and CD8-positive subgroups of T cells along the x axis. (F) Chromium release assays of humanized IL-13Rα2 CAR T cells co-cultured with tumor cell lines in (D) was analyzed at different effector/target (E:T) ratios (1:1, 3:1, 10:1, and 30:1) compared with the UTD T cells with one-way ANOVA post hoc Tukey test. **p < 0.01, ***p < 0.001, ****p < 0.0001. Data are presented as means ± SEM.
Figure 2
Figure 2
IL-13Rα2 CAR T Cells Control Tumor Growth In Vivo (A) Flow-based EGFRvIII and IL-13Rα2 expression on the D270 tumor cell line controlled with control antibodies. (B) EGFRvIII-targeting (2173BBz) and IL-13Rα2-targeting (Hu08BBz) CAR T cells co-cultured with D270 tumor cell line. The stimulation of T cells was illustrated by FITC-conjugated anti-CD69 antibody staining, the median fluorescence intensity (MFI) was quantified on CD4 and CD8 CAR-positive T cells after 24- or 48-hr co-culture, controlled with un-transduced T cells. Statistically significant differences were calculated by one-way ANOVA with post hoc Tukey test. (C) Human T cells enumerated in the spleens of D270-injected NSG mice (n = 3), 11 days after i.v. transferring equal numbers of un-transduced T cells, EGFRvIII-targeting (2173BBz), or IL-13Rα2-targeting (Hu08BBz) CAR T cells. (D) Five million CAR-positive EGFRvIII-targeting (2173BBz) or IL-13Rα2-targeting (Hu07BBz and Hu08BBz) CAR T cells or the same number of un-transduced T cells after i.v. infusion in a D270 subcutaneously implanted NSG mouse model (n = 10 per group), 7 days after tumor implantation. Tumor volume measurements (left panel) and bioluminescence imaging (middle panel) were performed to evaluate the tumor growth. Linear regression was used to test for significant differences between the experimental groups. Endpoint was predefined by the mouse hunch, inability to ambulate, or tumor reaching 2 cm in any direction, as predetermined IACUC-approved morbidity endpoint. Survival based on time to endpoint was plotted using a Kaplan-Meier curve (Prism software). Statistically significant differences were determined using log-rank test. (E) 800,000 IL-13Rα2-targeting CAR-positive (Hu08BBz) CAR T cells or the same number of un-transduced T cells were given by i.v. infusion in NSG mice (n = 8 per group) orthotopically implanted with the D270 tumor, 8 days after tumor injection. Bioluminescence imaging was repeated every 3–4 days to evaluate the tumor growth. Endpoint was predefined and statistically significant differences were determined as described in (D). *p < 0.05, **p < 0.01, ***p < 0.001, ****p < 0.0001. Data are presented as means ± SEM.
Figure 3
Figure 3
Checkpoint Blockades Selectively Enhances the Function of CAR T Cells (A) EGFRvIII- (2173BBz) targeting and IL-13Rα2- (Hu08BBz) targeting CAR T cells as well as un-transduced T cell control were co-cultured with target-positive D270 tumor cell line and target-negative A549 tumor cell line. The expression of checkpoint receptors on the T cells was determined by flow cytometry, by staining with fluorochrome-conjugated anti-checkpoint receptor antibodies; the median fluorescence intensity (MFI) was quantified on CD4 and CD8 CAR-positive T cells after 24- or 48-hr co-culture. Statistically significant differences were calculated by one-way ANOVA with post hoc Tukey test. (B) Un-transduced (UTD) human T cells were i.v. infused into a D270 subcutaneously implanted mouse model (n = 5 per group) 7 days after tumor implantation. From day 6, PBS or the same volume of 200 μg checkpoint blockade antibodies (anti-PD-1, anti-CTLA-4, and anti-TIM-3) were injected intraperitoneally every 4 days. Tumor size was measured and compared between the UTD plus PBS group and the UTD plus checkpoint blockade groups. (C) Same number of EGFRvIII-targeting (2173BBz) and IL-13Rα2-targeting (Hu08BBz) CAR T cells infused and combined with checkpoint blockade as described in (B). The tumor volume of checkpoint blockade combinational therapy groups was compared with PBS combined CAR T cell control group (n = 5 per group). (D) Different checkpoint blockade combinational therapies were compared in the EGFRvIII-targeting (2173BBz) and IL-13Rα2-targeting (Hu08BBz) CAR T cell groups based on the tumor size of mice. Survival curves were also compared in these two CAR T cell groups. Statistically significant differences of tumor growth between the experimental groups were determined by linear regression, and log-rank test was used for determining the statistically significant differences of survival curves. ns, not significant; *p < 0.05, **p < 0.01, ***p < 0.001, ****p < 0.0001. Data are presented as means ± SEM.
Figure 4
Figure 4
IL-13Rα2 CAR T Cells Are Selectively Enhanced by In Situ-Secreted Anti-CTLA-4 Checkpoint Blockade (A) Vector map of minibody-secreting anti-IL-13Rα2 CAR design based on the size of each components. Minibodies were simplified as PD-1, CTLA-4, and TIM-3 targeting scFvs jointing with human IgG1 spacer and CH3 domain. A self-cleaving sequence (P2A) was used to express minibodies with anti-IL-13Rα2 CAR in a same open reading frame. (B) CAR expression was detected on the minibody-secreting IL-13Rα2-targeting CAR T cells as well as the no minibody-secreting IL-13Rα2-targeting CAR T cells. (C) Supernatant of anti-PD-1 and anti-CTLA-4 minibody-secreting IL-13Rα2-targeting CAR T cells was collected and concentrated separately. A standard direct ELISA was performed to evaluate the binding ability of anti-PD-1 and anti-CTLA-4 minibodies secreted by CAR T cells to recombinant hPD-1 and hCTLA-4. Statistically significant differences were calculated by unpaired t test. (D) Un-transduced T cells, IL-13Rα2-targeting (Hu08BBz) CAR T cells, and minibody-secreting Hu08BBz CAR T cells were co-cultured with D270 tumor cell line. Median fluorescence intensity (MFI) was quantified by BV605-conjugated anti-TIM-3 antibody staining on CD4 and CD8 subgroups of CAR-positive T cells after 24- or 48-hr co-culture. Statistically significant differences were calculated by one-way ANOVA with post hoc Tukey test. (E) 800,000 IL-13Rα2-targeting (Hu08BBz) CAR T cells and minibody-secreting Hu08BBz CAR T cells or the same number of un-transduced T cells were injected i.v. 8 days after D270 subcutaneous implantation (n = 8). Tumor size was calipered and compared between each group. Statistically significant differences of tumor growth were determined by linear regression. ns, not significant; *p < 0.05, **p < 0.01, ***p < 0.001, ****p < 0.0001. Data are presented as means ± SEM.
Figure 5
Figure 5
IL-13Rα2 CAR T Cells Respond to Canine Tumors (A) IL-13Rα2 expression analysis on the patient-derived glioma stem cell lines (5077, 5430, 4860, 5377, 5560, 4806, and 4892) with isotype antibody staining control in blue. (B) CAR expression was detected on the mRNA-electroporated IL-13Rα2-targeting human CAR T cells (Hu07BBz and Hu08BBz). Intracellular cytokine (IFNγ) staining was performed after these CAR T cells were co-cultured with human and canine IL-13Rα2 protein controlled with BSA. CD8 staining was used to distinguish CD4- and CD8-positive T cell groups on the x axis. (C) The expression of canine IL-13Rα1 and IL-13Rα2 mRNA on various canine tumor cell lines (Camac2, CLBL-1, GL-1, Cacal3, Cacal5, BW-KOSA, CS-KOSA, MC-KOSA, and SK-KOSA) was detected with RT-PCR, controlled with canine GAPDH. The percentage of cytokine- (IFNγ, IL-2, and TNF-α) positive T cells in CD4- and CD8-positive T cell subgroups was analyzed for mRNA-electroporated IL-13Rα2-targeting (Hu07BBz and Hu08BBz) human CAR T cells and un-transduced T cells after co-culture with canine tumor cell lines mentioned before. (D) Two million Hu08BBz-transduced human CAR-positive T cells were injected i.v. after 7 days of five million MC-KOSA subcutaneous implantation (n = 5 per group). Tumor size was calipered and compared with the same amount of un-transduced T cell control group. Statistically significant difference of tumor growth was determined by linear regression. ****p < 0.0001. Data are presented as means ± SEM.
Figure 6
Figure 6
Canine IL-13Rα2 CAR T Cells Control Canine Tumor Growth (A) mRNA-electroporated Hu08BBz canine CAR T cells were co-cultured with canine tumor cell lines (Camac2, CLBL-1, GL-1, Cacal3, Cacal5, BW-KOSA, CS-KOSA, MC-KOSA, SK-KPSA, and J3T). Canine IFNγ secretion was detected with ELISA and compared the stimulation with un-transduced canine T cells. (B) Vector maps of anti-IL-13Rα2 human Hu08BBz CAR structure (Hu08HuBBz) and canine Hu08BBz CAR structure (Hu08CaBBz). (C) mRNA-electroporated Hu07HuBBz, Hu08HuBBz, and Hu08CaBBz canine CAR T cells co-cultured with CLBL1 and J3T tumor cell lines. Canine IFNγ secretion was detected with ELISA. Unpaired t test was used to determine the statistically significant difference of IFNγ secretion between Hu08HuBBz and Hu08CaBBz co-cultured with J3T glioma cells. (D) J3T canine glioma cell line orthotopically implanted into the NSG mouse brain. 12 million electroporated Hu08HuBBz, Hu08CaBBz, or un-transduced canine T cells were i.v. injected into the mouse model (n = 4 per group) on days 7, 10, and 13 after tumor implantation. Tumor growth was evaluated by bioluminescence imaging every 3–4 days. Statistically significant differences of tumor growth were determined by linear regression. (E) The canine T cells used on the second injection on day 10 were analyzed for CAR expression and canine IFNγ secretion after co-culture with the J3T tumor cell line. Canine CD4 was stained to distinguish the canine CD4- and CD8-positive subgroups along the x axis. ns, not significant; **p < 0.01, ****p < 0.0001. Data are presented as means ± SEM.

References

    1. Omuro A., DeAngelis L.M. Glioblastoma and other malignant gliomas: a clinical review. JAMA. 2013;310:1842–1850. - PubMed
    1. Wen P.Y., Kesari S. Malignant gliomas in adults. N. Engl. J. Med. 2008;359:492–507. - PubMed
    1. Stupp R., Taillibert S., Kanner A.A., Kesari S., Steinberg D.M., Toms S.A., Taylor L.P., Lieberman F., Silvani A., Fink K.L. Maintenance Therapy With Tumor-Treating Fields Plus Temozolomide vs Temozolomide Alone for Glioblastoma: A Randomized Clinical Trial. JAMA. 2015;314:2535–2543. - PubMed
    1. Porter D.L., Levine B.L., Kalos M., Bagg A., June C.H. Chimeric antigen receptor-modified T cells in chronic lymphoid leukemia. N. Engl. J. Med. 2011;365:725–733. - PMC - PubMed
    1. Maude S.L., Frey N., Shaw P.A., Aplenc R., Barrett D.M., Bunin N.J., Chew A., Gonzalez V.E., Zheng Z., Lacey S.F. Chimeric antigen receptor T cells for sustained remissions in leukemia. N. Engl. J. Med. 2014;371:1507–1517. - PMC - PubMed

Associated data