. 2019 Jan;137(1):151-165.
doi: 10.1007/s00401-018-1916-x. Epub 2018 Oct 10.

Rapid lymphatic efflux limits cerebrospinal fluid flow to the brain

Affiliations

Rapid lymphatic efflux limits cerebrospinal fluid flow to the brain

Qiaoli Ma et al. Acta Neuropathol. 2019 Jan.

Abstract

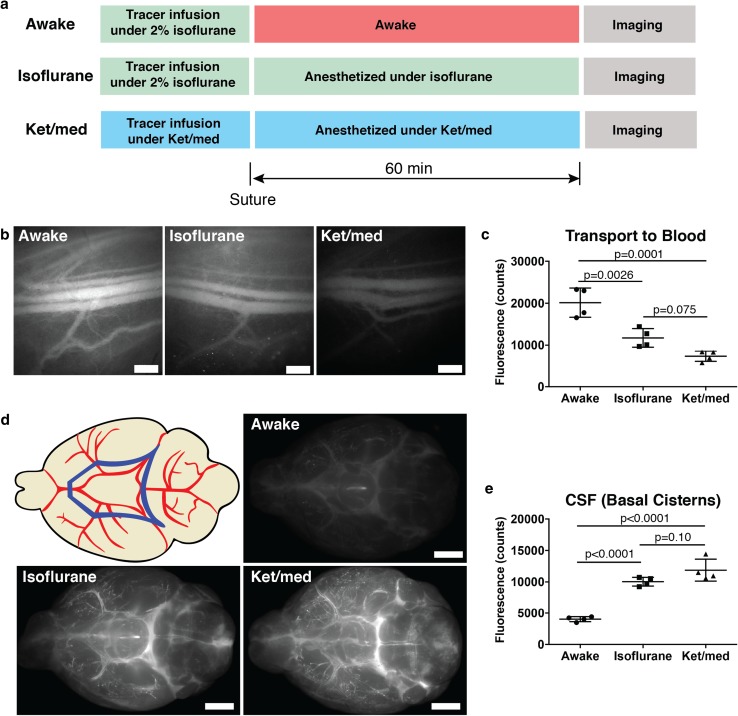
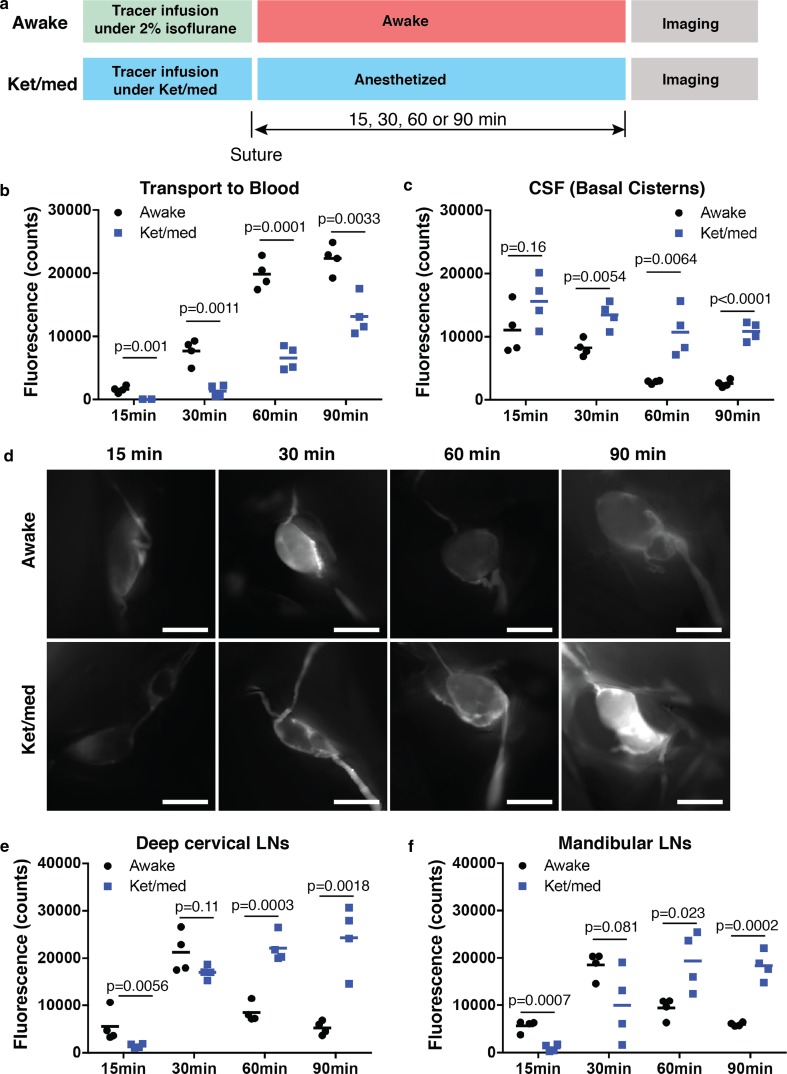
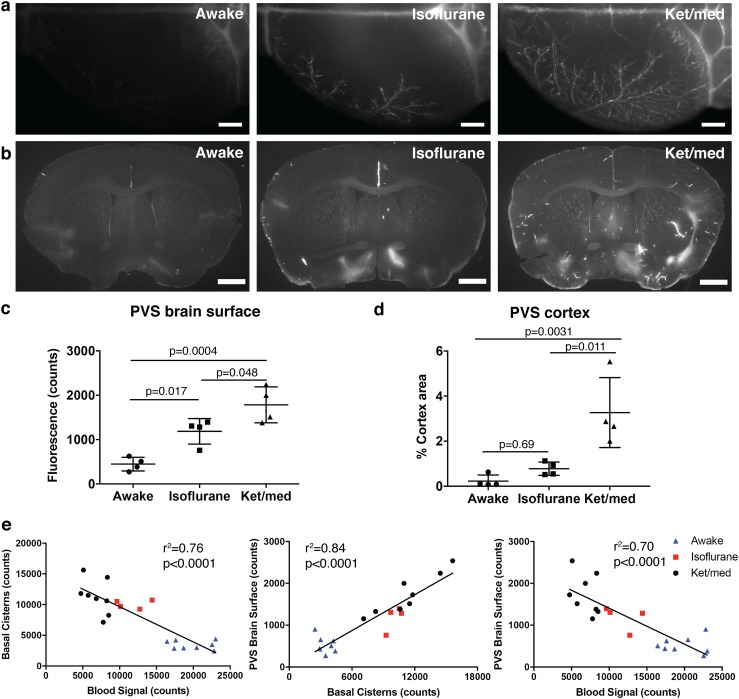
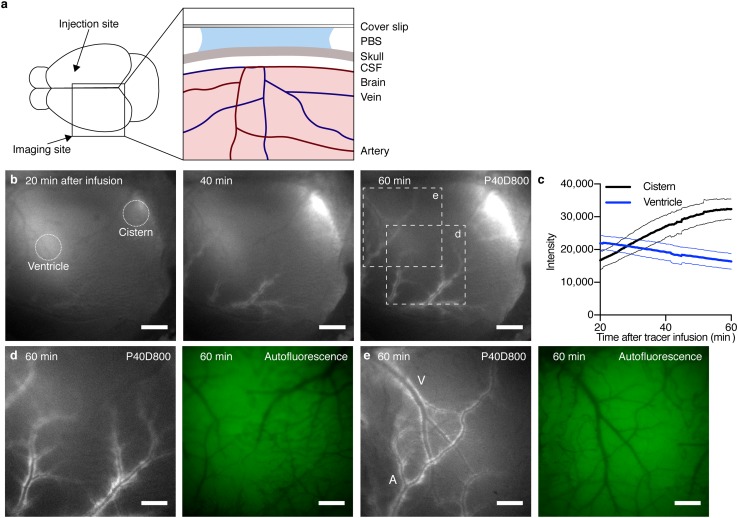
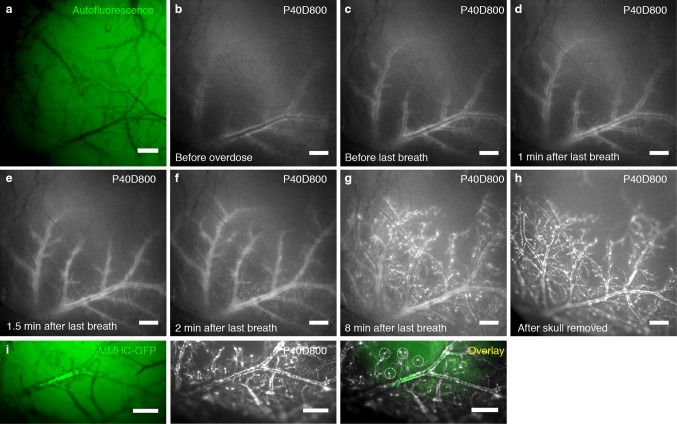
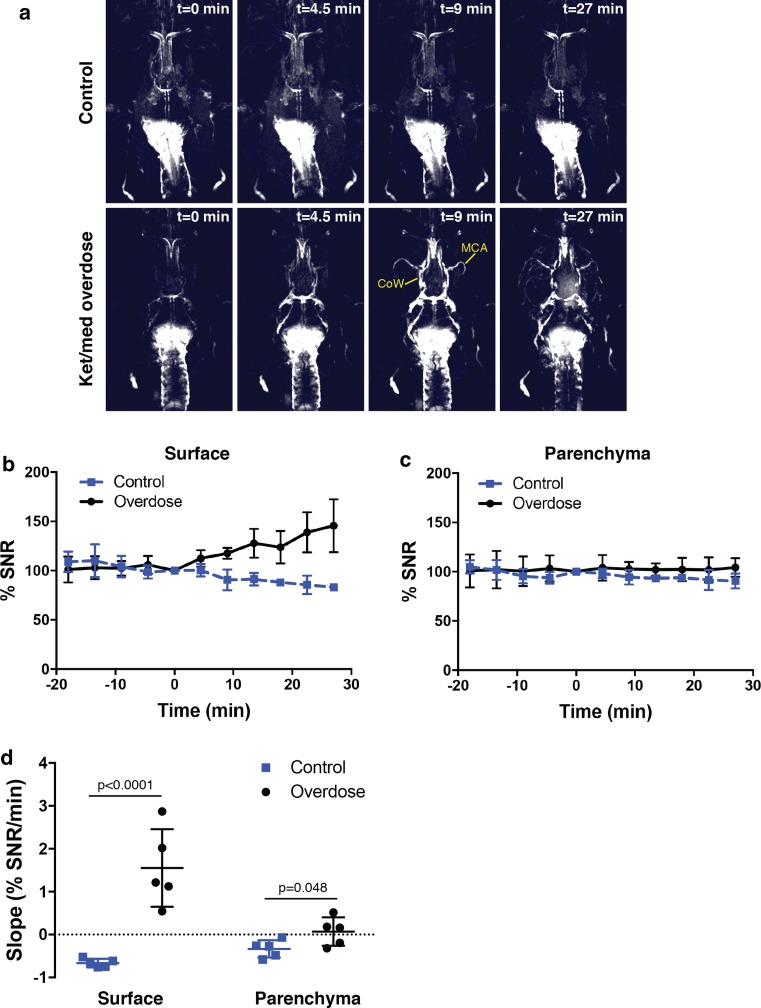
The relationships between cerebrospinal fluid (CSF) and brain interstitial fluid are still being elucidated. It has been proposed that CSF within the subarachnoid space will enter paravascular spaces along arteries to flush through the parenchyma of the brain. However, CSF also directly exits the subarachnoid space through the cribriform plate and other perineural routes to reach the lymphatic system. In this study, we aimed to elucidate the functional relationship between CSF efflux through lymphatics and the potential influx into the brain by assessment of the distribution of CSF-infused tracers in awake and anesthetized mice. Using near-infrared fluorescence imaging, we showed that tracers quickly exited the subarachnoid space by transport through the lymphatic system to the systemic circulation in awake mice, significantly limiting their spread to the paravascular spaces of the brain. Magnetic resonance imaging and fluorescence microscopy through the skull under anesthetized conditions indicated that tracers remained confined to paravascular spaces on the surface of the brain. Immediately after death, a substantial influx of tracers occurred along paravascular spaces extending into the brain parenchyma. We conclude that under normal conditions a rapid CSF turnover through lymphatics precludes significant bulk flow into the brain.

Keywords: Anesthesia; Cerebrospinal fluid; Lymphatic vessel; Paravascular space.


Conflict of interest statement

The authors declare no competing financial interests.

Figures

Fig. 1
Fig. 1
CSF outflow is increased during awake conditions. a Scheme of experimental design for quantification of CSF outflow during awake or anesthesia conditions. Before imaging at the saphenous vein, mice from awake and isoflurane group were given 80 mg/kg ketamine, 0.2 mg/kg medetomidine intraperitoneally. After imaging, all mice were overdosed with 400 mg/kg ketamine, 1 mg/kg medetomidine. b Representative images of saphenous bundle of blood vessels at 60 min post-infusion of P40D680 into lateral ventricle. Scale bar: 500 µm. c Quantification of P40D680 signal in the blood 60 min after tracer i.c.v. infusion. d Scheme indicating ROI and ex vivo imaging of the basal aspect of the brain at 60 min post-infusion showing presence of P40D680 tracer at circle of Willis and cisterns. Blue polygon in upper left image represents the analyzed ROI. Scale bar: 2000 µm. e Quantification of P40D680 signal at basal cisterns 60 min after infusion
Fig. 2
Fig. 2
Dynamics of outflow support CSF drainage through lymphatic vessels. a Scheme of experimental design for quantification of the dynamics of CSF outflow during awake or ket/med anesthesia conditions. b Quantification of P40D680 signals in the blood. c Quantification of P40D680 signals at basal cisterns. d Representative in situ images of deep cervical LNs at 15, 30, 60 and 90 min post-infusion of P40D680 into lateral ventricle. Scale bars: 1000 µm. e Quantification of P40D680 signals in the deep cervical lymph nodes (LNs). f Quantification of P40D680 signals in the mandibular LNs
Fig. 3
Fig. 3
Spread to paravascular space (PVS) is inversely correlated to CSF outflow. a Representative images of tracer-filled PVS on the brain surface of the dorsal hemisphere contralateral to the infusion site. Scale bars: 1000 µm. b Representative images of tracer accumulation in PVS around penetrating vessels on 100 µm brain sections. Scale bars: 1000 µm. c Quantification of P40D680 signal on the brain surface 60 min after infusion. d Quantification of P40D680 signal in the cortex of the 100 µm brain sections 60 min after infusion. e Correlations from all mice examined at 60 min demonstrating relationships between signals at basal cisterns, brain surface and systemic blood. All quantifications are normalized to signals in n = 3 uninjected mice
Fig. 4
Fig. 4
Tracer spread from the CSF is limited to PVS of surface blood vessels in vivo. a Schematic illustration of setup for in vivo near-infrared imaging through the skull. b Representative images of tracer spread along brain surface blood vessels visualized through the skull 20, 40 and 60 min after infusion of 2.5 µL 200 μM P40D800 into the contralateral ventricle. Scale bars: 1000 μm. Dotted circles show 1 mm diameter ROIs used for quantification of tracer signal from lateral ventricle and quadrigeminal cistern. c Quantification of fluorescence signal from the lateral ventricle (blue) and quadrigeminal cistern (black) after tracer infusion as in (b) (n = 5). Data show mean (solid lines) ± SD (dashed lines). d–e Close-ups of region shown in (b) with corresponding autofluorescence images 60 min after tracer infusion indicating tracer spread along large surface arteries (A) and transfer to surface veins (V). Scale bars: 500 μm
Fig. 5
Fig. 5
Extensive post-mortem tracer spread on brain surface and to penetrating blood vessels. ah Images of tracer spread visualized after infusion of 2.5 µL 200 μM P40D800 into the contralateral ventricle. Imaging through the skull (ag) or after skull removal (h). a Autofluorescence image of brain region imaged. b Tracer spread 60 min after infusion of 2.5 µL 200 μM P40D800 into the contralateral ventricle. c Tracer spread after overdose with ket/med i.p. but before last breath. d Tracer spread 1 min after last breath. e Tracer spread 1.5 min after last breath suggesting constriction of arteries initiating from the MCA. f Tracer spread 2 min after last breath showing spreading of arterial constriction to smaller branches of the MCA. g Tracer spread 8 min after last breath showing spreading to penetrating blood vessels. h Imaging of tracer spread after skull removal indicating that signal detection was not significantly obstructed by imaging through the skull. i Images of tracer spread in brain of SMMHC-GFP mouse ex vivo 60 min after infusion of 2.5 µL 200 μM P40D800 into the lateral ventricle. SMMHC-GFP positive vessels (green) mark arteries with contractile smooth muscle cells. Circles indicate location of tracer (white) at penetrating blood vessels. Scale bars: 500 μm
Fig. 6
Fig. 6
Spread of contrast agent to PVS after death as detected with MRI. a Visualization of tracer spread after infusion of 5 µL of a Gadospin D solution at 25 mM gadolinium into the cisterna magna; data acquired with a series of T1-weighted MRI measurements (three-dimensional time of flight gradient recalled echo sequence). MIP images on the upper panel show a mouse that was kept alive under ket/med anesthesia and showed no spread of the tracer towards the PVS. The bottom panel images show a mouse that was overdosed with ket/med; the time of death is indicated as t = 0. Strong enhancements of signal are detectable 9 min after death at the circle of Willis (CoW) and at the middle cerebral artery (MCA). Smaller branches of the MCA are clearly visible 27 min after death. b, c Quantification of signal-to-noise ratio (SNR) after tracer infusion in the cisterna magna in mice kept under ket/med anesthesia (n = 5) or in mice killed by ket/med overdose (n = 5). Regions of interests were defined on the surface of the cortex (b) and the cortical parenchyma (c). SNR values were normalized to the time of death and set to time = 0. Data show mean ± SD. d Comparison of the slopes calculated by linear regression of SNR over time for the surface of the cortex and for cortical parenchyma in the control group and in the group of mice killed by ket/med overdose

References

    1. Abbott NJ, Pizzo ME, Preston JE, Janigro D, Thorne RG. The role of brain barriers in fluid movement in the CNS: is there a ‘glymphatic’ system? Acta Neuropathol. 2018;135:387–407. doi: 10.1007/s00401-018-1812-4. - DOI - PubMed
    1. Albargothy NJ, Johnston DA, MacGregor-Sharp M, Weller RO, Verma A, Hawkes CA, Carare RO. Convective influx/glymphatic system: tracers injected into the CSF enter and leave the brain along separate periarterial basement membrane pathways. Acta Neuropathol. 2018;136:139–152. doi: 10.1007/s00401-018-1862-7. - DOI - PMC - PubMed
    1. Asgari M, de Zelicourt D, Kurtcuoglu V. Glymphatic solute transport does not require bulk flow. Sci Rep. 2016;6:38635. doi: 10.1038/srep38635. - DOI - PMC - PubMed
    1. Aspelund A, Antila S, Proulx ST, Karlsen TV, Karaman S, Detmar M, Wiig H, Alitalo K. A dural lymphatic vascular system that drains brain interstitial fluid and macromolecules. J Exp Med. 2015;212:991–999. doi: 10.1084/jem.20142290. - DOI - PMC - PubMed
    1. Bakker EN, Bacskai BJ, Arbel-Ornath M, Aldea R, Bedussi B, Morris AW, Weller RO, Carare RO. Lymphatic clearance of the brain: perivascular, paravascular and significance for neurodegenerative diseases. Cell Mol Neurobiol. 2016;36:181–194. doi: 10.1007/s10571-015-0273-8. - DOI - PMC - PubMed

Publication types