. 2019 Mar;247(3):293-304.
doi: 10.1002/path.5179. Epub 2019 Jan 16.

Cellular polarity modulates drug resistance in primary colorectal cancers via orientation of the multidrug resistance protein ABCB1

Affiliations

Cellular polarity modulates drug resistance in primary colorectal cancers via orientation of the multidrug resistance protein ABCB1

Neil Ashley et al. J Pathol. 2019 Mar.

Abstract

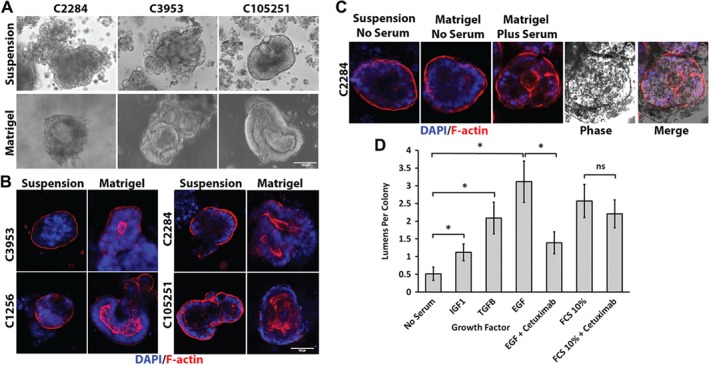
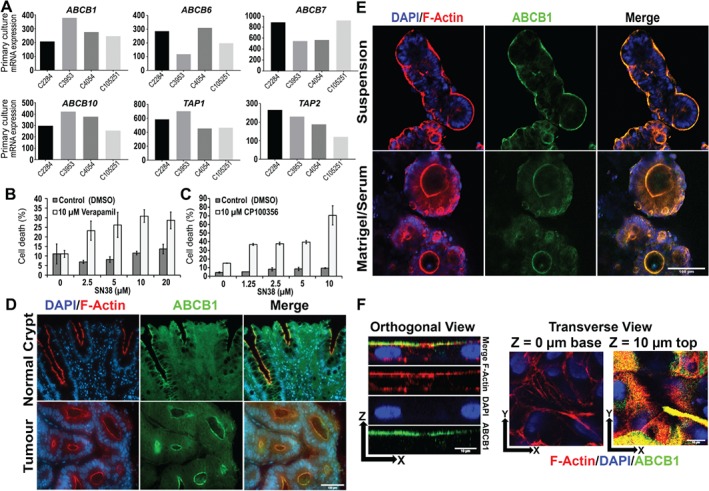
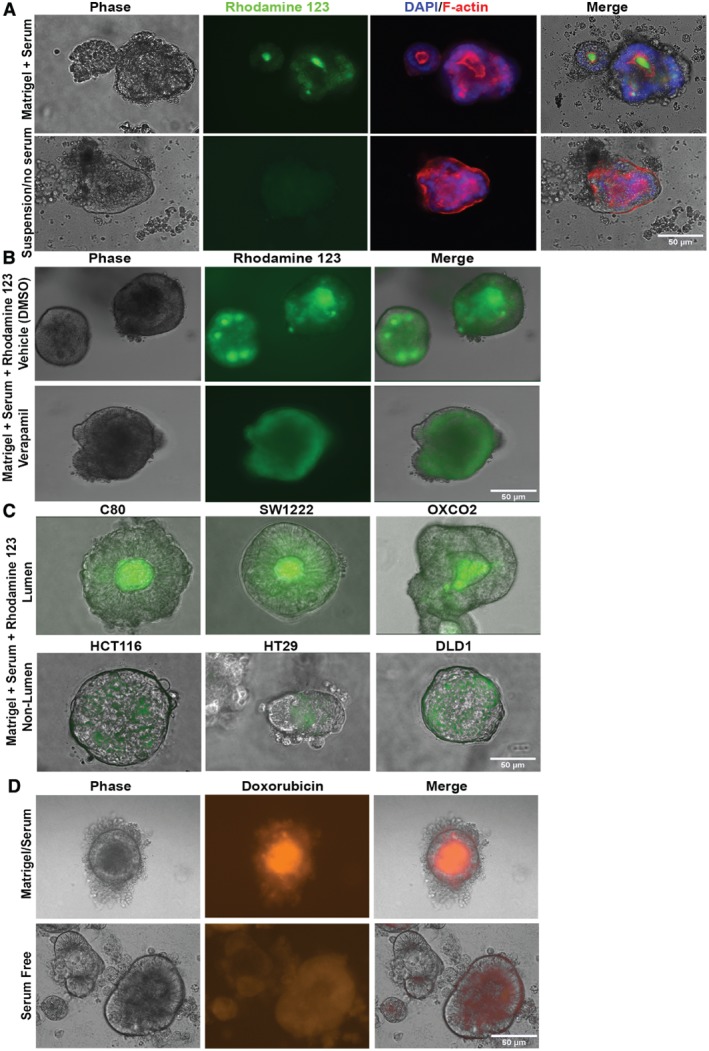
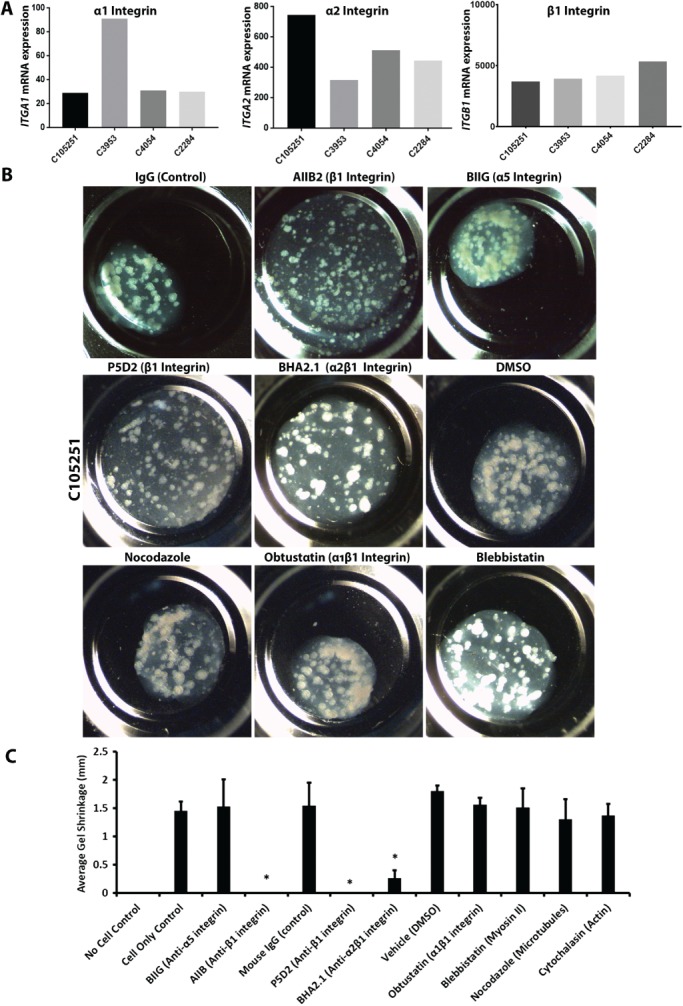
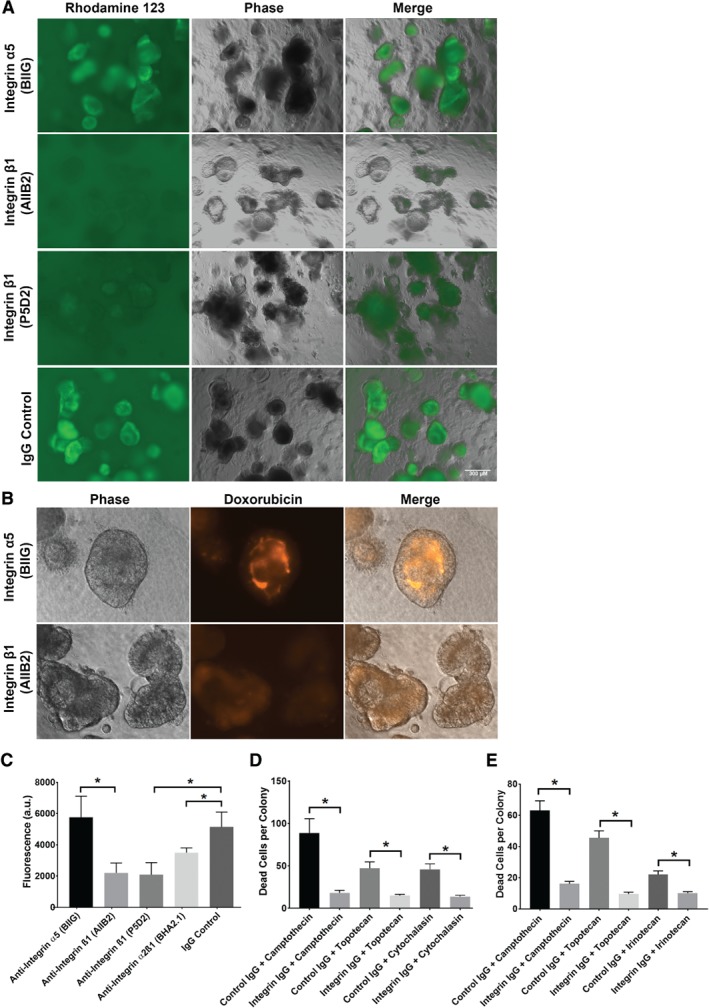
Colonic epithelial cells are highly polarised with a lumen-facing apical membrane, termed the brush border, and a basal membrane in contact with the underlying extracellular matrix (ECM). This polarity is often maintained in cancer tissue in the form of neoplastic glands and has prognostic value. We compared the cellular polarity of several ex vivo spheroid colonic cancer cultures with their parental tumours and found that those grown as non-attached colonies exhibited apical brush border proteins on their outer cellular membranes. Transfer of these cultures to an ECM, such as collagen, re-established the centralised apical polarity observed in vivo. The multidrug resistance protein ABCB1 also became aberrantly polarised to outer colony membranes in suspension cultures, unlike cultures grown in collagen, where it was polarised to central lumens. This polarity switch was dependent on the presence of serum or selected serum components, including epidermal growth factor (EGF), transforming growth factor-β1 (TGF-β1) and insulin-like growth factor-1 (IGF-1). The apical/basal orientation of primary cancer colon cultures cultured in collagen/serum was modulated by α2β1 integrin signalling. The polarisation of ABCB1 in colonies significantly altered drug uptake and sensitivity, as the outward polarisation of ABCB1 in suspension colonies effluxed substrates more effectively than ECM-grown colonies with ABCB1 polarised to central lumens. Thus, serum-free suspension colonies were more resistant to a variety of anti-cancer drugs than ECM-grown colonies. In conclusion, the local stroma, or absence thereof, can have profound effects on the sensitivity of colorectal cultures to drugs that are ABCB1 substrates. © 2018 The Authors. The Journal of Pathology published by John Wiley & Sons Ltd on behalf of Pathological Society of Great Britain and Ireland.

Keywords: ABCB1; colon; drug resistance; polarity; primary culture; spheroid.


Figures

Figure 1
Figure 1
Lumen formation and restoration of in vivo polarity of primary cultures in ECM depends on the presence of serum or the growth factors EGF, TGF‐β1 and IGF‐1. (A) Phase‐contrast images of three primary colorectal cancer cultures cultured for 1 week as either serum‐free suspension cultures (upper panels) or embedded in Matrigel with added serum (lower panels). (B) F‐actin (red)/DAPI (blue) staining of colorectal cancer cultures from four patients cultured as a serum‐free suspension or in Matrigel with serum for 1 week. (C) F‐actin (red)/DAPI (blue) labelling of a C2284 primary culture grown as either a serum‐free suspension (left two panels) or in Matrigel with or without serum added. Phase image is included to demonstrate F‐actin‐lined lumen. (D) Effect of various serum growth factors on lumen formation in primary cultures cultured in Matrigel. C2284 primary serum‐free suspension cultures were embedded in Matrigel and the serum‐free medium was supplemented with either TGF‐1β (10 ng/ml), EGF (10 ng/ml) or IGF‐1 (1 μg/ml). Cetuximab anti‐EGFR monoclonal antibody was used at 20 μg/ml. Lumen formation was measured by F‐actin labelling. Ten per cent serum and no serum medium controls were used as positive and negative controls for lumens, respectively. At least 30 colonies were counted per condition (n = 3). Error bar = standard error of the mean. *p < 0.05 paired t‐test. Paired t‐test of 10% serum + cetuximab was not significantly different from the 10% serum control.
Figure 2
Figure 2
ABCB1 is polarised to apical‐out and apical‐in orientations in suspension or ECM conditions, respectively, and is involved in resistance to cytotoxic drugs. (A) mRNA levels of ABC family transporters in four primary cultures, determined by microarray analysis. (B) Cell death in serum‐free suspension colonies (C105251) exposed to various concentrations of SN38 in the presence or absence of ABCB1 inhibitor verapamil (10 μm) or vehicle control (DMSO). (C) Same experiment as (B) except using the alternative ABCB1 inhibitor CP100356 (10 μm) compared with vehicle controls (DMSO). The SytoxBlue versus PrestoBlue fluorescence was normalised to detergent‐treated controls (see Materials and methods). *p ≤ 0.05 verapamil versus control (Student's t‐test). Error bars = standard error of the mean. (D) F‐actin (red)/DAPI (blue) and anti‐ABCB1 (green) labelling of cross‐sections of normal colonic crypt tissue and well‐differentiated colonic tumour. Scale bar = 100 μm. (E) Co‐labelling for F‐actin (red), ABCB1 (green) with DAPI (blue) in C105251 primary cultures grown as either serum‐free suspension spheroids or as Matrigel‐embedded cultures in the presence of serum. Scale bar = 100 μm. (F) Orthogonal and transverse views of co‐labelling for ABCB1 (green) and F‐actin (red) with DAPI (blue) in a C105251 primary culture grown as a monolayer for 2 weeks in the presence of serum on cell culture‐treated plastic. Scale bar = 10 μm.
Figure 3
Figure 3
Polarised ABCB1 functions as an orientation‐dependent drug effluxer. (A) C3953 colonies cultured in either Matrigel/serum or as serum‐free suspensions for 1 week and labelled with the fluorescent ABCB1 substrate R123 (green) for 1 h. The same colonies were then fixed and labelled for F‐actin (red) with DAPI (blue). Merge shows R123/DAPI/phase contrast/F‐actin. (B) R123 fluorescence of C3953 colonies grown in Matrigel/serum for 1 week in the presence of either DMSO (vehicle) or 50 μm verapamil. (C) R123 labelling of live Matrigel/serum‐grown lumen‐forming colorectal cell lines (C80, SW1222, OXCO2) and non‐lumen‐forming cell lines (HCT116, HT29 and DLD1). (D) Doxorubicin auto‐fluorescence of live C105251 colonies cultured in either Matrigel/serum for 1 week or as serum‐free suspension cultures and incubated with 10 μm doxorubicin for 1 day. Scale bars = 50 μm.
Figure 4
Figure 4
Integrin α2β1 mediates the interaction of primary cultures with collagen. (A) Microarray gene expression analysis of various integrin subunits in the primary cultures. (B) Phase‐contrast images of collagen I gels in which C105251 primary cultures were incubated with various inhibitors or controls for 3 days. These include isotype control mouse monoclonal IgG, AIIB2 (rat monoclonal against integrin β1 subunit), BIIG (control rat monoclonal against integrin α5 subunit), P5D2 (mouse monoclonal against integrin β1 subunit), BHA2.1 (mouse monoclonal against α2β1 integrin heterodimer). Each antibody was used at 10 μg/ml. Other inhibitors tested included obtustatin (α1β1 inhibitor, 5 nm), blebbistatin (myosin II inhibitor, 100 μm). (C) Graph showing quantification of C105251‐mediated gel contraction, of the same experiment as (B) with the additional inhibitors nocodazole and cytochalasin B (microtubule and actin inhibitors, respectively, 1 μm each). DMSO was the vehicle control. *p < 0.05 versus appropriate control, Dunnett's multiple comparisons test. Error bar = standard deviation.
Figure 5
Figure 5
β1 and α2β1 integrin function‐blocking antibodies prevent switching of apical‐out polarity to apical‐in polarity in primary cultures grown in collagen I gels with serum. (A–C) F‐actin/DAPI labelling of C3953, C2284 and C105251 cultures grown for 5 days in collagen I/serum gels with either isotype control antibodies (IgG or BIIG) or the β1 integrin‐blocking antibody AIIB2 or α1β2‐blocking antibody BHA2.1. (D) Quantification of F‐actin foci larger than 3 μm of the same experiment as presented in (A–C). Thirty colonies for each condition were counted (three experiments). Antibodies were used at 10 μg/ml each.
Figure 6
Figure 6
β1 integrin inhibition of collagen/serum‐grown primary cultures reduces their uptake of ABCB1 substrates and decreases their drug sensitivity. (A) R123 labelling (1 mm, 1 h) of live C105251 cultures grown in collagen with serum for 5 days in the presence of either isotype control antibodies (mouse IgG or rat anti‐integrin α5 [BIIG] IgG) or β1 integrin‐blocking antibodies (AIIB2 or P5D2 IgG, 10 μg/ml each). (B) Doxorubicin (10 μm for 6 h) fluorescence of live C105251 cultures grown in collagen with serum for 5 days in the presence of either control antibodies (BIIG) or β1 integrin function‐blocking antibody (AIIB2). (C) Plate reader measurement of R123 fluorescence in C105251 from the experiment presented in (A). AIIB2‐, P5D2‐ and BHA2.1‐treated cultures showed significantly reduced R123 fluorescence compared with controls (p = 0.015, p = 0.013, p = 0.04, respectively, Student's t‐test). (D) Cell death (normalised to vehicle/IgG controls) in C105251 cultured in collagen with either control antibodies (IgG/BIIG) or β1 integrin‐blocking antibodies (AIIB2 IgG/P5D2 IgG), in the presence of various chemotherapy drugs: camptothecin (20 μm), topotecan (10 μm), cytochalasin B (5 μm). Cell death was measured in situ in each colony by counting the number of SytoxBlue foci (a dye specifically staining dead cells), using a FIJI algorithm of digital images, as detailed in Materials and methods (n = 30–50). (E) Identical experiment to (D) but using C2284 primary cultures and irinotecan (10 μm) instead of cytochalasin B. Antibodies were used at 10 μg/ml each. Error bars = standard error of the mean. *p < 0.05 drug/control IgG versus drug/β1 integrin IgG.

Similar articles

Cited by

References

    1. Crawley SW, Mooseker MS, Tyska MJ. Shaping the intestinal brush border. J Cell Biol 2014; 207: 441–451. - PMC - PubMed
    1. Bonnans C, Chou J, Werb Z. Remodelling the extracellular matrix in development and disease. Nat Rev Mol Cell Biol 2014; 15: 786–801. - PMC - PubMed
    1. Furuta S, Bissell MJ. Pathways involved in formation of mammary organoid architecture have keys to understanding drug resistance and to discovery of druggable targets. Cold Spring Harb Symp Quant Biol 2016; 81: 207–217. - PubMed
    1. Nistico P, Di Modugno F, Spada S, et al beta1 and beta4 integrins: from breast development to clinical practice. Breast Cancer Res 2014; 16: 459. - PMC - PubMed
    1. Manninen A. Epithelial polarity – generating and integrating signals from the ECM with integrins. Exp Cell Res 2015; 334: 337–349. - PubMed

Publication types

MeSH terms