

Aberrant MCT4 and GLUT1 expression is correlated with early recurrence and poor prognosis of hepatocellular carcinoma after hepatectomy
- PMID: 30306706
- PMCID: PMC6246944
- DOI: 10.1002/cam4.1521
Aberrant MCT4 and GLUT1 expression is correlated with early recurrence and poor prognosis of hepatocellular carcinoma after hepatectomy
Abstract
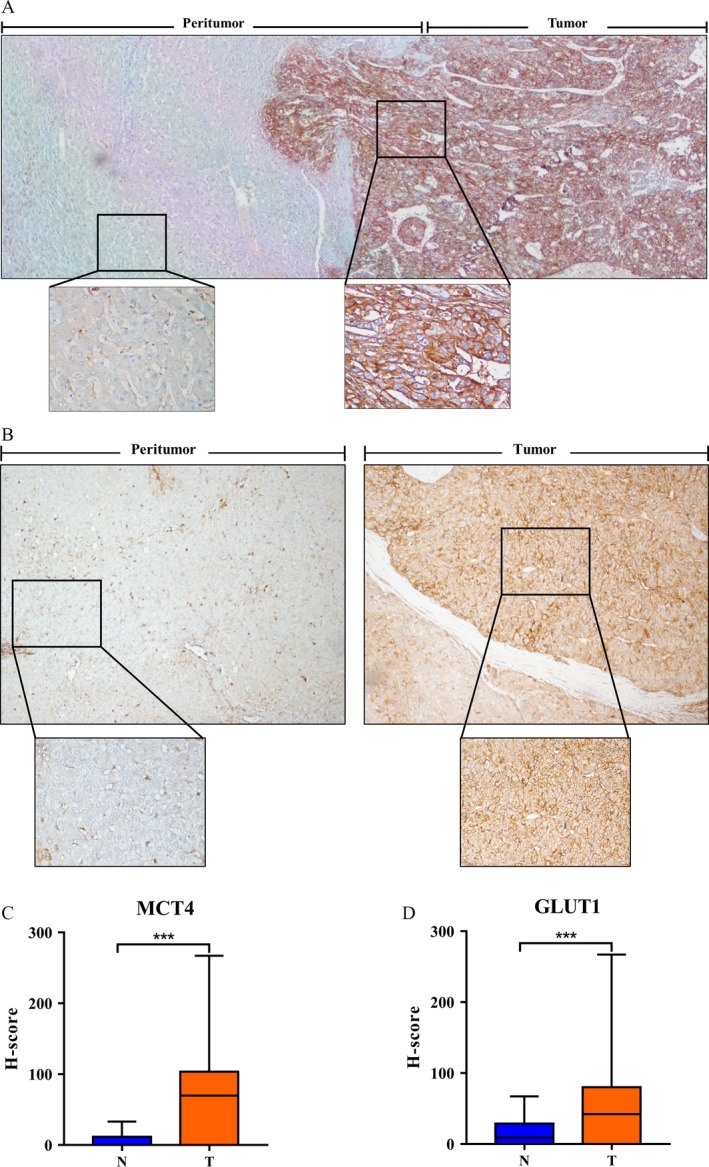
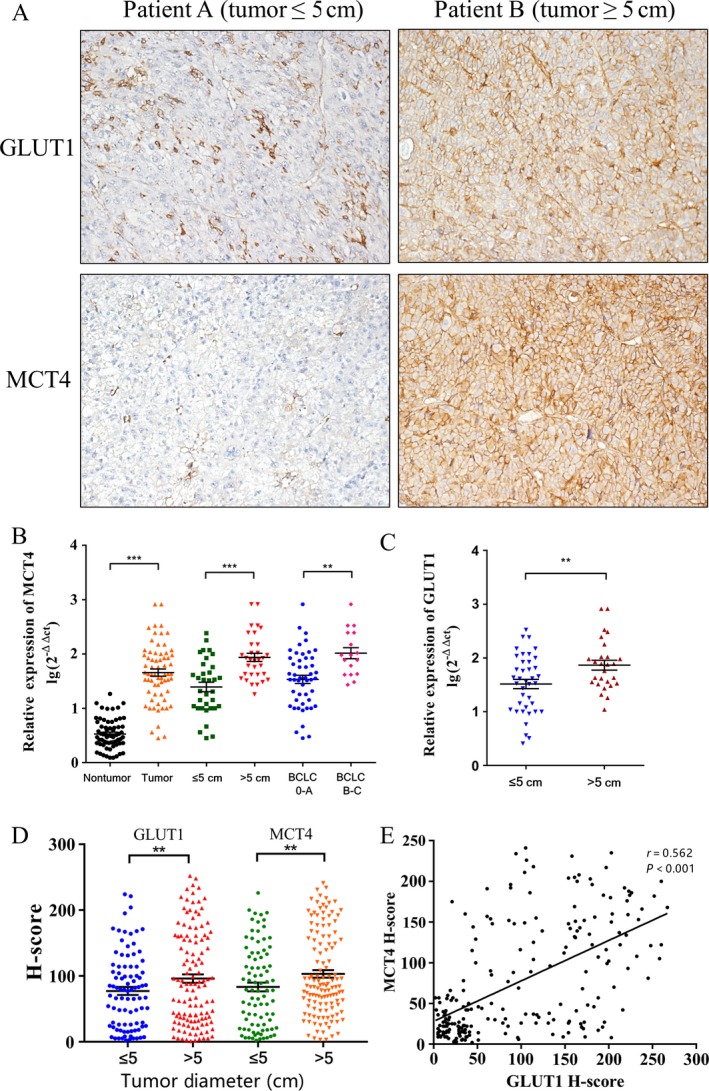
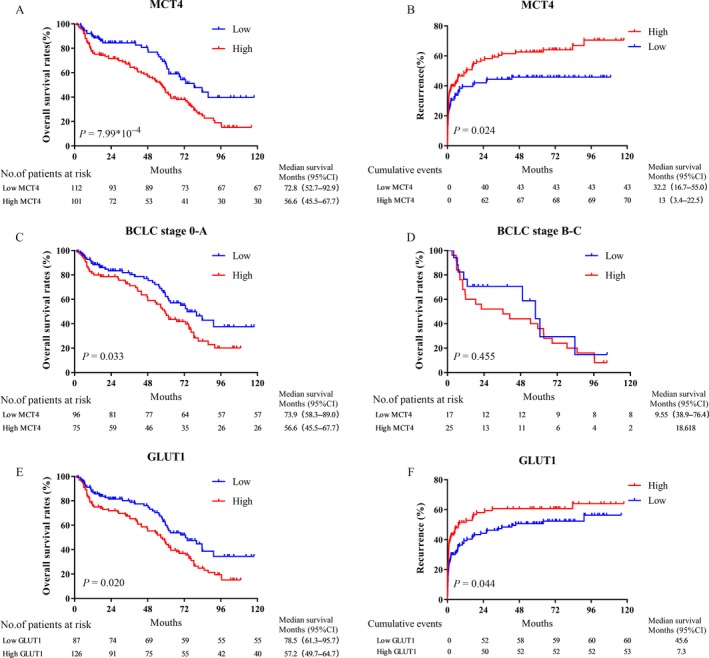
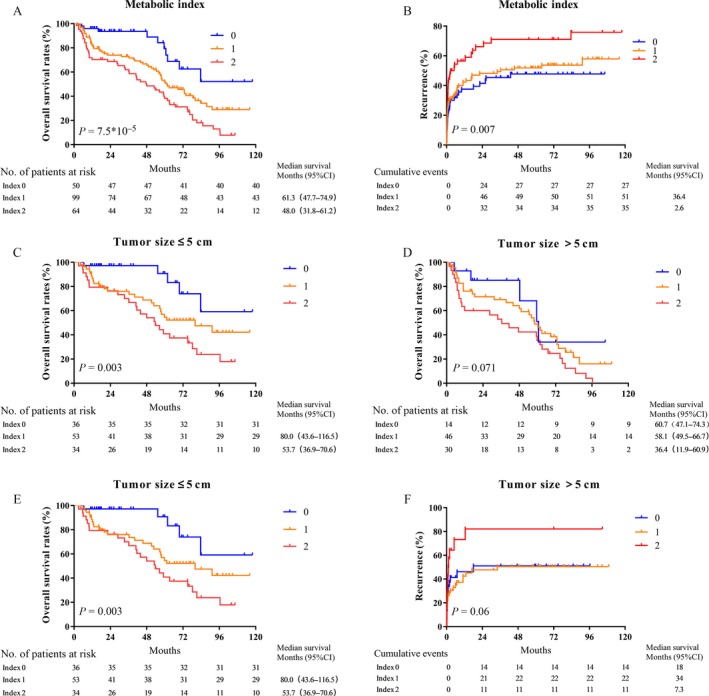
The tumor microenvironment is a key determinant of cancer cell biology. The microenvironment is a complex mixture of tumor cells, stromal cells, and proteins, extracellular matrix, oxygen tension, and pH levels surrounding the cells that regulate the tumor progress. This study identified the prognostic factors associated with hepatocellular carcinoma (HCC) and MCT4 and GLUT1 expression levels in HCC specimens. In this study, we analyzed MCT4 and GLUT1 expression levels in tissue samples from 213 patients with HCC by immunohistochemical analyses and in HCC tumor tissues and matched adjacent nonneoplastic tissues by quantitative real-time PCR. We conducted a prognostic analysis of the overall survival (OS) and time to recurrence (TTR) using immunoreactivity and other common clinical and pathological parameters. All variables with prognostic impact were further analyzed by multivariate analysis. We found that MCT4 and GLUT1 expression levels were significantly higher in tumor tissues than in adjacent nontumor tissues, and they were positively correlated with tumor size. Survival analysis showed that patients with high expression levels of MCT4 or GLUT1 had a poor OS and TTR. In patients with HCC, MCT4 expression was an independent negative prognostic factor for OS (hazard ratio [HR] = 1.617; 95% confidence interval [CI] = 1.102-2.374; P = 0.014), and metabolic indicators were independent prognostic factors for OS (HR = 1.617, 95% CI = 1.102-2.374, P = 0.006) and TTR (HR = 1.348, 95% CI = 1.079-1.685, P = 0.009). Interestingly, patients with positive metabolic indicator expression in tumor cells had a significantly shorter OS and earlier TTR than those with negative metabolic indicator expression in tumor cells in the ≤5 cm and >5 cm subgroups. In summary, using the expression of MCT4 and GLUT1 and their metabolic parameters to determine the metabolic status of tumors is promising for predicting the prognosis of patients with HCC.
Keywords: GLUT1; MCT4; hepatocellular carcinoma; prognosis.
© 2018 The Authors. Cancer Medicine published by John Wiley & Sons Ltd.
Figures
Similar articles
-
Aberrant expression of monocarboxylate transporter 4 in tumour cells predicts an unfavourable outcome in patients with hepatocellular carcinoma.Liver Int. 2014 Jul;34(6):942-52. doi: 10.1111/liv.12466. Epub 2014 Feb 7. Liver Int. 2014. PMID: 24433439
-
GLUT1 and ASCT2 as Predictors for Prognosis of Hepatocellular Carcinoma.PLoS One. 2016 Dec 30;11(12):e0168907. doi: 10.1371/journal.pone.0168907. eCollection 2016. PLoS One. 2016. PMID: 28036362 Free PMC article.
-
Differences in metabolism between adeno- and squamous cell non-small cell lung carcinomas: spatial distribution and prognostic value of GLUT1 and MCT4.Lung Cancer. 2012 Jun;76(3):316-23. doi: 10.1016/j.lungcan.2011.11.006. Epub 2011 Dec 6. Lung Cancer. 2012. PMID: 22153830
-
Cancer metabolism, stemness and tumor recurrence: MCT1 and MCT4 are functional biomarkers of metabolic symbiosis in head and neck cancer.Cell Cycle. 2013 May 1;12(9):1371-84. doi: 10.4161/cc.24092. Epub 2013 Apr 10. Cell Cycle. 2013. PMID: 23574725 Free PMC article.
-
Proteomics of hepatocellular carcinoma in Chinese patients.OMICS. 2011 May;15(5):261-6. doi: 10.1089/omi.2010.0099. Epub 2011 Feb 24. OMICS. 2011. PMID: 21348761 Review.
Cited by
-
Expression of hypoxia-inducible factor 1α, glucose transporter 1, and hexokinase 2 in primary central nervous system lymphoma and the correlation with the biological behaviors.Brain Behav. 2020 Aug;10(8):e01718. doi: 10.1002/brb3.1718. Epub 2020 Jun 12. Brain Behav. 2020. PMID: 32533646 Free PMC article.
-
Comprehensive Analysis of the Relationship Between Metabolic Reprogramming and Immune Function in Prostate Cancer.Onco Targets Ther. 2021 May 18;14:3251-3266. doi: 10.2147/OTT.S304298. eCollection 2021. Onco Targets Ther. 2021. PMID: 34040390 Free PMC article.
-
Intratumoral reciprocal expression of monocarboxylate transporter 4 and glypican-3 in hepatocellular carcinomas.BMC Res Notes. 2019 Nov 9;12(1):741. doi: 10.1186/s13104-019-4778-y. BMC Res Notes. 2019. PMID: 31706332 Free PMC article.
-
Ferroptosis-Related Hub Genes in Hepatocellular Carcinoma: Prognostic Signature, Immune-Related, and Drug Resistance Analysis.Front Genet. 2022 Jul 22;13:907331. doi: 10.3389/fgene.2022.907331. eCollection 2022. Front Genet. 2022. PMID: 35938001 Free PMC article.
-
Correlationship between Ki67, VEGF, and p53 and Hepatocellular Carcinoma Recurrence in Liver Transplant Patients.Biomed Res Int. 2021 Apr 15;2021:6651397. doi: 10.1155/2021/6651397. eCollection 2021. Biomed Res Int. 2021. PMID: 33954191 Free PMC article.
References
-
- Torre, L. A. , Bray F., Siegel R. L., Ferlay J., Lortet‐Tieulent J., and Jemal A.. 2015. Global cancer statistics, 2012. CA Cancer J. Clin. 65:87–108. - PubMed
-
- Sprinzl, M. F. , and Galle P. R.. 2017. Current progress in immunotherapy of hepatocellular carcinoma. J. Hepatol. 66:482–484. - PubMed
-
- Villanueva, A. , Hernandez‐Gea V., and Llovet J. M.. 2013. Medical therapies for hepatocellular carcinoma: a critical view of the evidence. Nat. Rev. Gastroenterol. Hepatol. 10:34–42. - PubMed
-
- Cabrera, R. , and Nelson D. R.. 2010. Review article: the management of hepatocellular carcinoma. Aliment. Pharmacol. Ther. 31:461–476. - PubMed
Publication types
MeSH terms
Substances
LinkOut - more resources
Full Text Sources
Other Literature Sources
Medical
Research Materials
Miscellaneous
