

The histone deacetylase inhibitor Suberoylanilide Hydroxamic Acid (SAHA) as a therapeutic agent in rhabdomyosarcoma
- PMID: 30307360
- PMCID: PMC6370390
- DOI: 10.1080/15384047.2018.1529093
The histone deacetylase inhibitor Suberoylanilide Hydroxamic Acid (SAHA) as a therapeutic agent in rhabdomyosarcoma
Abstract
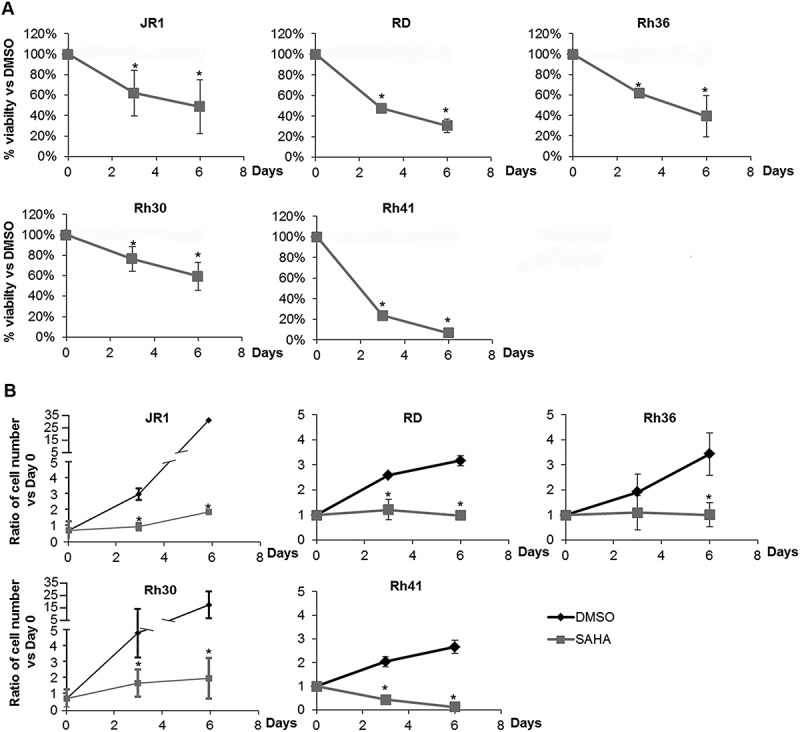
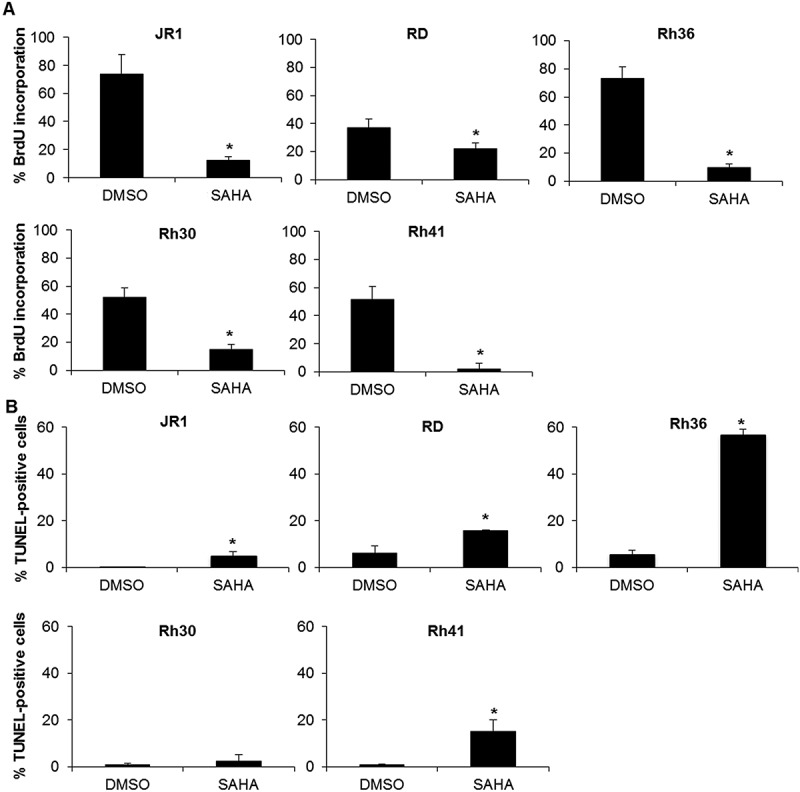
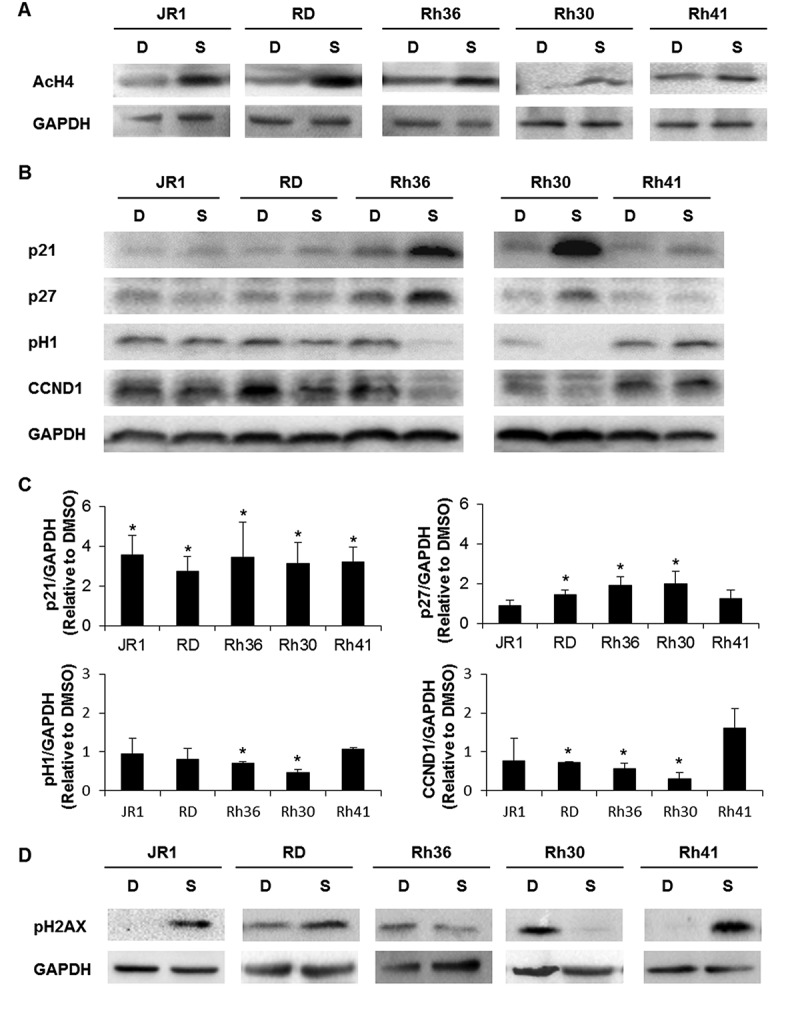
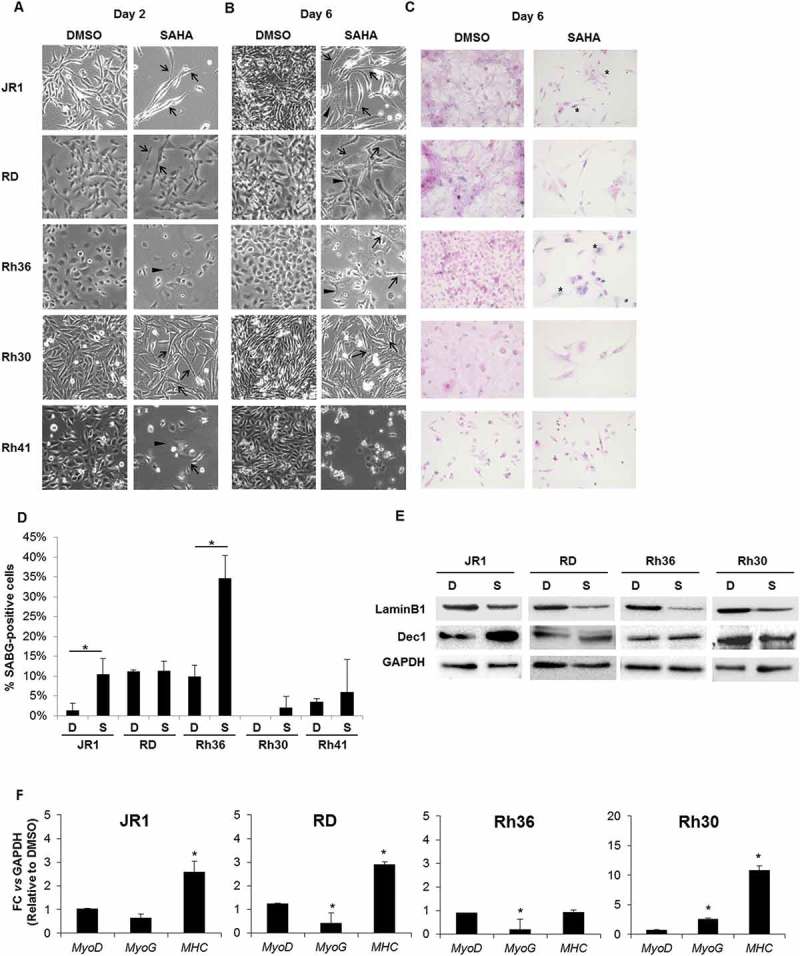
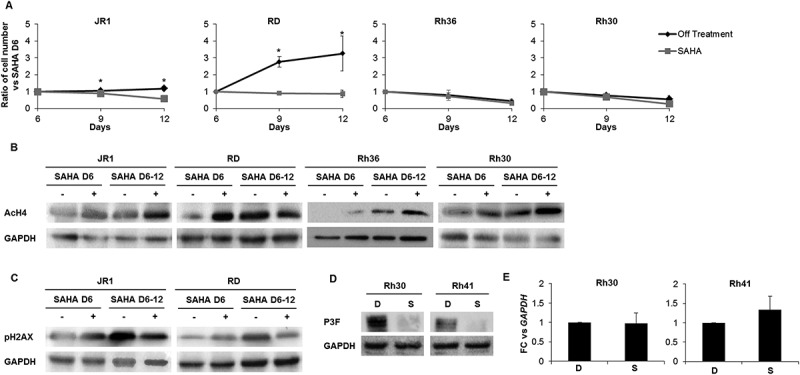
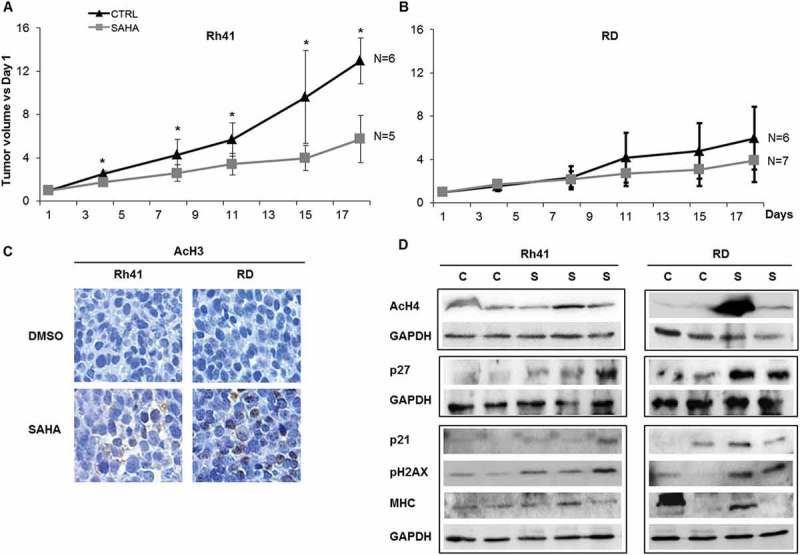
Rhabdomyosarcoma (RMS) is an aggressive childhood sarcoma with two distinct subtypes, embryonal (ERMS) and alveolar (ARMS) histologies. More effective treatment is needed to improve outcomes, beyond conventional cytotoxic chemotherapy. The pan-histone deacetylase inhibitor, Suberoylanilide Hydroxamic Acid (SAHA), has shown promising efficacy in limited preclinical studies. We used a panel of human ERMS and ARMS cell lines and xenografts to evaluate the effects of SAHA as a therapeutic agent in both RMS subtypes. SAHA decreased cell viability by inhibiting S-phase progression in all cell lines tested, and induced apoptosis in all but one cell line. Molecularly, SAHA-treated cells showed activation of a DNA damage response, induction of the cell cycle inhibitors p21Cip1 and p27Kip1 and downregulation of Cyclin D1. In a subset of RMS cell lines, SAHA promoted features of cellular senescence and myogenic differentiation. Interestingly, SAHA treatment profoundly decreased protein levels of the driver fusion oncoprotein PAX3-FOXO1 in ARMS cells at a post-translational level. In vivo, SAHA-treated xenografts showed increased histone acetylation and induction of a DNA damage response, along with variable upregulation of p21Cip1 and p27Kip1. However, while the ARMS Rh41 xenograft tumor growth was significantly inhibited, there was no significant inhibition of the ERMS tumor xenograft RD. Thus, our work shows that, while SAHA is effective against ERMS and ARMS tumor cells in vitro, it has divergent in vivo effects . Together with the observed effects on the PAX3-FOXO1 fusion protein, these data suggest SAHA as a possible therapeutic agent for clinical testing in patients with fusion protein-positive RMS.
Keywords: HDAC inhibitor; PAX3-FOXO; Rhabdomyosarcoma; SAHA; xenograft.
Figures
Similar articles
-
Chemosensitization of rhabdomyosarcoma cells by the histone deacetylase inhibitor SAHA.Cancer Lett. 2014 Aug 28;351(1):50-8. doi: 10.1016/j.canlet.2014.04.021. Epub 2014 May 6. Cancer Lett. 2014. PMID: 24814395
-
Enhancement of radiation response in osteosarcoma and rhabdomyosarcoma cell lines by histone deacetylase inhibition.Int J Radiat Oncol Biol Phys. 2010 Sep 1;78(1):237-45. doi: 10.1016/j.ijrobp.2010.03.010. Epub 2010 Jun 18. Int J Radiat Oncol Biol Phys. 2010. PMID: 20646843
-
Histone deacetylase inhibitor, suberoylanilide hydroxamic acid (SAHA), enhances anti-tumor effects of the poly (ADP-ribose) polymerase (PARP) inhibitor olaparib in triple-negative breast cancer cells.Breast Cancer Res. 2015 Mar 7;17:33. doi: 10.1186/s13058-015-0534-y. Breast Cancer Res. 2015. PMID: 25888415 Free PMC article.
-
Combinatorial strategies to potentiate the efficacy of HDAC inhibitors in fusion-positive sarcomas.Biochem Pharmacol. 2022 Apr;198:114944. doi: 10.1016/j.bcp.2022.114944. Epub 2022 Feb 7. Biochem Pharmacol. 2022. PMID: 35152144 Review.
-
Mechanisms of impaired differentiation in rhabdomyosarcoma.FEBS J. 2013 Sep;280(17):4323-34. doi: 10.1111/febs.12421. Epub 2013 Jul 31. FEBS J. 2013. PMID: 23822136 Free PMC article. Review.
Cited by
-
MS-275 (Entinostat) Promotes Radio-Sensitivity in PAX3-FOXO1 Rhabdomyosarcoma Cells.Int J Mol Sci. 2021 Oct 1;22(19):10671. doi: 10.3390/ijms221910671. Int J Mol Sci. 2021. PMID: 34639012 Free PMC article.
-
Panobinostat enhances NK cell cytotoxicity in soft tissue sarcoma.Clin Exp Immunol. 2022 Aug 19;209(2):127-139. doi: 10.1093/cei/uxac068. Clin Exp Immunol. 2022. PMID: 35867577 Free PMC article.
-
Histone Deacetylase Expressions in Hepatocellular Carcinoma and Functional Effects of Histone Deacetylase Inhibitors on Liver Cancer Cells In Vitro.Cancers (Basel). 2019 Oct 18;11(10):1587. doi: 10.3390/cancers11101587. Cancers (Basel). 2019. PMID: 31635225 Free PMC article.
-
The PAX Genes: Roles in Development, Cancer, and Other Diseases.Cancers (Basel). 2024 Feb 29;16(5):1022. doi: 10.3390/cancers16051022. Cancers (Basel). 2024. PMID: 38473380 Free PMC article. Review.
-
HDAC2 and 7 down-regulation induces senescence in dermal fibroblasts.Aging (Albany NY). 2021 Jul 12;13(14):17978-18005. doi: 10.18632/aging.203304. Epub 2021 Jul 12. Aging (Albany NY). 2021. PMID: 34253688 Free PMC article.
References
-
- Tombolan L, Poli E, Martini P, Zin A, Millino C, Pacchioni B, Celegato B, Bisogno G, Romualdi C, Rosolen A. Global DNA methylation profiling uncovers distinct methylation patterns of protocadherin alpha4 in metastatic and non-metastatic rhabdomyosarcoma. BMC Cancer. 2016;16:886. doi:10.1186/s12885-016-2936-3. - DOI - PMC - PubMed
Publication types
MeSH terms
Substances
LinkOut - more resources
Full Text Sources
Research Materials
Miscellaneous