Meta-Analysis
. 2018 Nov 10;218(suppl_4):S255-S267.
doi: 10.1093/infdis/jiy471.

The Relationship Between Blood Sample Volume and Diagnostic Sensitivity of Blood Culture for Typhoid and Paratyphoid Fever: A Systematic Review and Meta-Analysis

Affiliations
Meta-Analysis

The Relationship Between Blood Sample Volume and Diagnostic Sensitivity of Blood Culture for Typhoid and Paratyphoid Fever: A Systematic Review and Meta-Analysis

Marina Antillon et al. J Infect Dis. .

Abstract

Background: Blood culture is the standard diagnostic method for typhoid and paratyphoid (enteric) fever in surveillance studies and clinical trials, but sensitivity is widely acknowledged to be suboptimal. We conducted a systematic review and meta-analysis to examine sources of heterogeneity across studies and quantified the effect of blood volume.

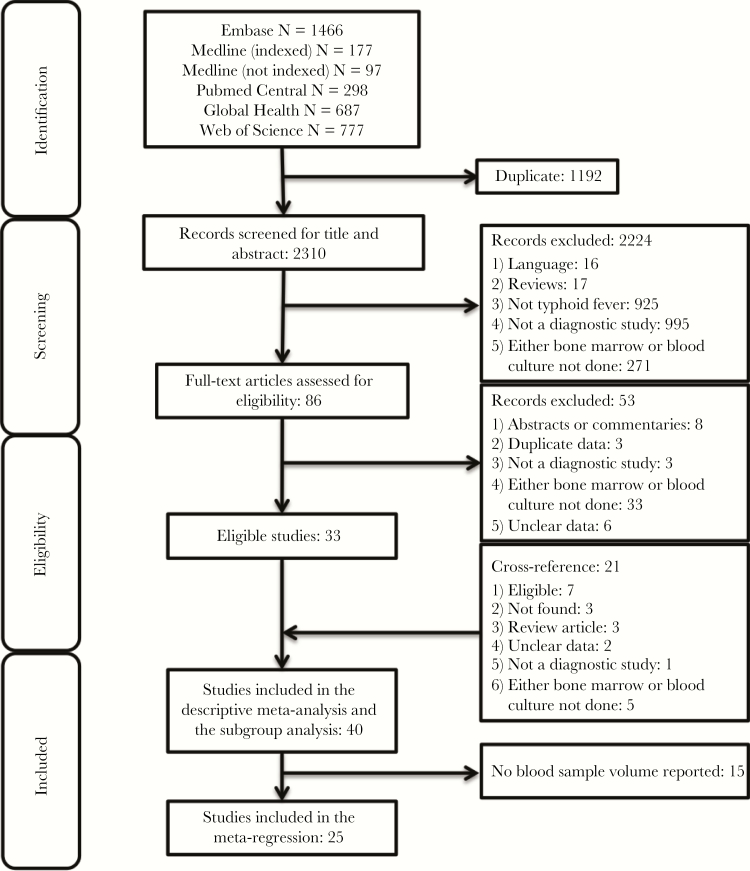
Methods: We searched the literature to identify all studies that performed blood culture alongside bone marrow culture (a gold standard) to detect cases of enteric fever. We performed a meta-regression analysis to quantify the relationship between blood sample volume and diagnostic sensitivity. Furthermore, we evaluated the impact of patient age, antimicrobial use, and symptom duration on sensitivity.

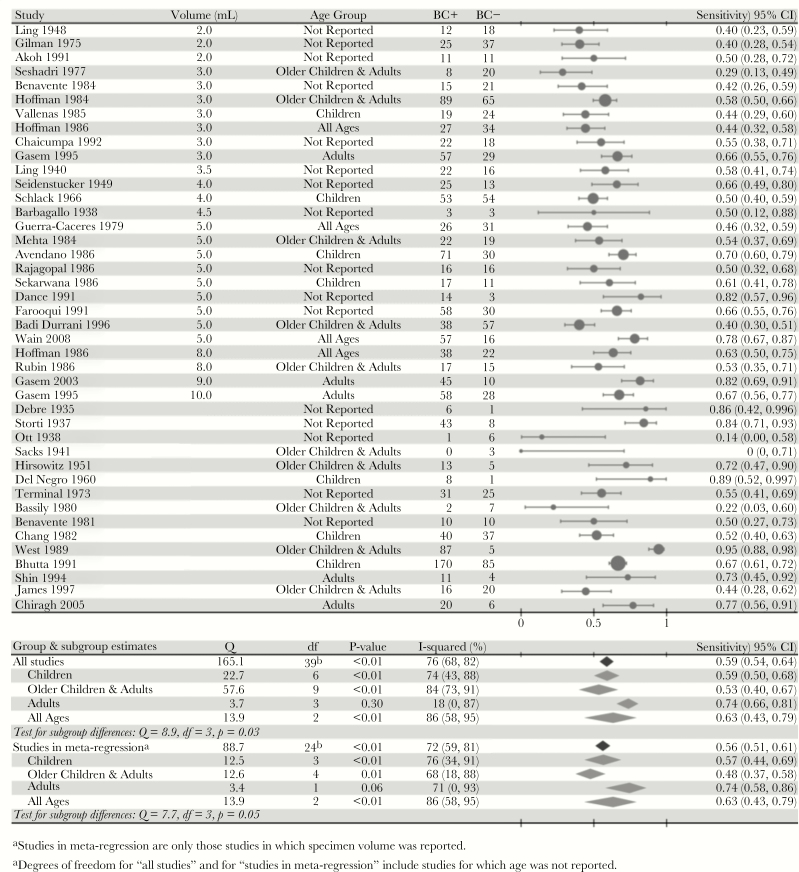
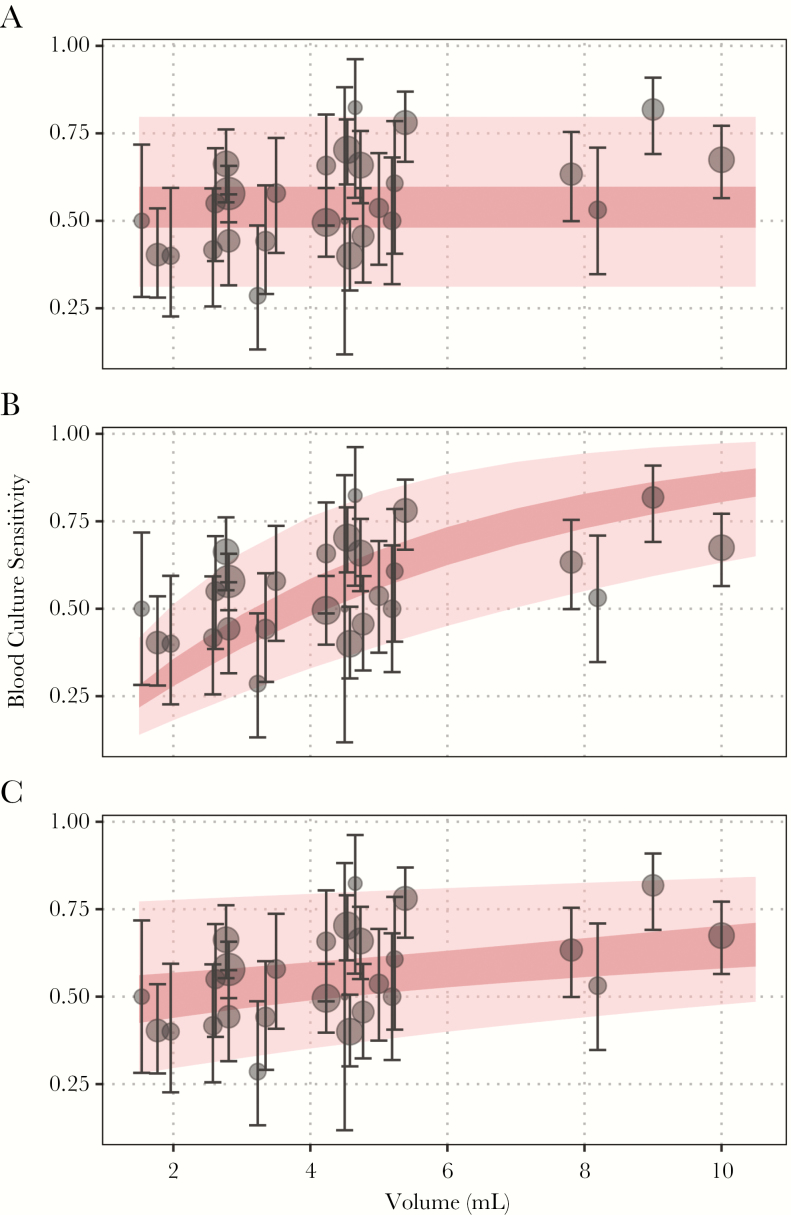
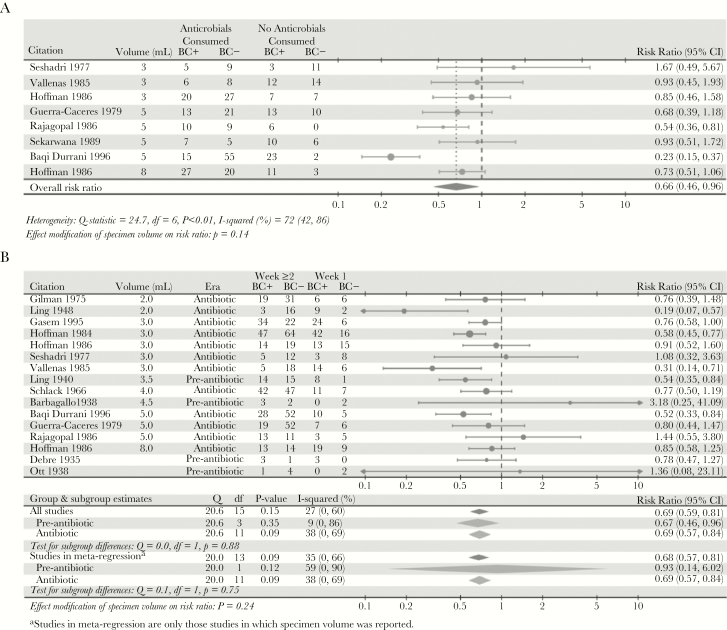
Results: We estimated blood culture diagnostic sensitivity was 0.59 (95% confidence interval [CI], 0.54-0.64) with significant between-study heterogeneity (I2, 76% [95% CI, 68%-82%]; P < .01). Sensitivity ranged from 0.51 (95% CI, 0.44-0.57) for a 2-mL blood specimen to 0.65 (95% CI, 0.58-0.70) for a 10-mL blood specimen, indicative of a relationship between specimen volume and sensitivity. Subgroup analysis showed significant heterogeneity by patient age and a weak trend towards higher sensitivity among more recent studies. Sensitivity was 34% lower (95% CI, 4%-54%) among patients with prior antimicrobial use and 31% lower after the first week of symptoms (95% CI, 19%-41%). There was no evidence of confounding by patient age, antimicrobial use, symptom duration, or study date on the relationship between specimen volume and sensitivity.

Conclusions: The relationship between the blood sample volume and culture sensitivity should be accounted for in incidence and next-generation diagnostic studies.


Figures

Figure 1.
Figure 1.
Preferred Reporting Items for Systematic Reviews and Meta-Analyses (PRISMA) diagram for systematic review. A systematic search in 6 databases yielded 3502 articles, or 2310 unique articles, 86 of which were eligible for full-text review. A total of 40 studies were included in the descriptive synthesis, and 25 studies had blood volume information and were included in our meta-regression analysis of the relationship between blood sample volume and blood culture sensitivity.
Figure 2.
Figure 2.
Sensitivity of blood culture to detect typhoid fever. The sensitivity of blood culture is expressed as the proportion of patients who tested positive by blood culture among patients who had at least 1 positive culture (bone marrow, blood, rose spots, stools, or urine) for Salmonella Typhi or Salmonella Paratyphi. The size of the markers is proportional to the number of patients in the study. We reported the midpoint volume of the blood sample for studies that reported specimen volume as a range. We tested for heterogeneity and age-related subgroup differences via the Q-statistic, which is assumed to have a χ2 distribution with degrees of freedom equal to the number of studies minus 1 with noncentrality parameter equal to 0. Hoffman (1986) and Gasem (1995) (Supplemental Material) reported sensitivity on the same patient population using specimens of 2 different volumes per patient, so we have taken only the results from the larger specimen in each study for the subgroup analysis by age to avoid double-counting. Abbreviations: BC+, blood culture-positive; BC−, blood culture-negative; CI, confidence interval.
Figure 3.
Figure 3.
Relationship between sample volume and model estimates of blood culture sensitivity. The observed blood culture sensitivity among all culture-positive cases is plotted in black (with corresponding 95% confidence intervals), whereas the mean model-predicted blood culture sensitivity is plotted in dark pink. The lighter pink regions correspond to the model-predicted population response. (A) The model assumes no correlation with blood volume; (B) the model assumes sensitivity increases with increasing sample volume and is constrained to be zero for a hypothetical 0-mL sample; (C) the model assumes sensitivity could vary with sample volume and estimates an intercept for a hypothetical 0-mL sample. All models account for heterogeneity between studies using random effects (see Supplement S4.1).
Figure 4.
Figure 4.
The relative probability of a positive blood culture according to patient history. (A) Relative probability of a positive blood culture for enteric fever patients who took antimicrobials versus patients who did not take antimicrobials before specimen collection. (B) Relative probability of a positive blood culture for enteric fever patients who had blood samples taken for culture in the second week of illness or later versus patients who had blood samples taken for culture in the first week of illness. To assess the possible impact of antibiotics on the relationship between duration of symptoms and sensitivity, we tested for a difference in risk ratio of the duration of illness stratified by studies carried out in the pre-antibiotic era and in the antibiotic era. All studies published before 1945 were considered to report the results of sensitivity in the absence of antimicrobial use, and studies published after 1945 were considered to report results that could show an interaction with antimicrobial use.
Figure 5.
Figure 5.
Summary findings of the risk of bias assessment using a modified QUADAS-II tool. We evaluated the risk of bias for the 7 domains of the QUADAS-II tool. The modified QUADAS-II tool was integrated into our data extraction form, found in Supplement S3. Detailed findings on the risk of bias assessment are found in Supplementary Table S6 and discussed in Supplement S5.

References

    1. Antillón M, Warren JL, Crawford FW, et al. . The burden of typhoid fever in low- and middle-income countries: a meta-regression approach. PLoS Negl Trop Dis 2017; 11:e0005376. - PMC - PubMed
    1. GBD 2015 Disease and Injury Incidence and Prevalence Collaborators. Global, regional, and national incidence, prevalence, and years lived with disability for 310 diseases and injuries, 1990–2015: a systematic analysis for the Global Burden of Disease Study 2015. Lancet 2016; 388:1545–602. - PMC - PubMed
    1. Crump JA. Typhoid fever and the challenge of nonmalaria febrile illness in sub-Saharan Africa. Clin Infect Dis 2012; 54:1107–9. - PubMed
    1. World Health Organization. Background document: the diagnosis, treatment and prevention of typhoid fever. 2003. http://www.who.int/iris/handle/10665/68122. Accessed January 2018.
    1. Gilman RH, Terminel M, Levine MM, Hernandez-Mendoza P, Hornick RB. Relative efficacy of blood, urine, rectal swab, bone-marrow, and rose-spot cultures for recovery of Salmonella typhi in typhoid fever. Lancet 1975; 1:1211–3. - PubMed

Publication types