Comparative Study
. 2018 Oct 11;12(10):e0006863.
doi: 10.1371/journal.pntd.0006863. eCollection 2018 Oct.

A gene expression comparison of Trypanosoma brucei and Trypanosoma congolense in the bloodstream of the mammalian host reveals species-specific adaptations to density-dependent development

Affiliations
Comparative Study

A gene expression comparison of Trypanosoma brucei and Trypanosoma congolense in the bloodstream of the mammalian host reveals species-specific adaptations to density-dependent development

Eleanor Silvester et al. PLoS Negl Trop Dis. .

Abstract

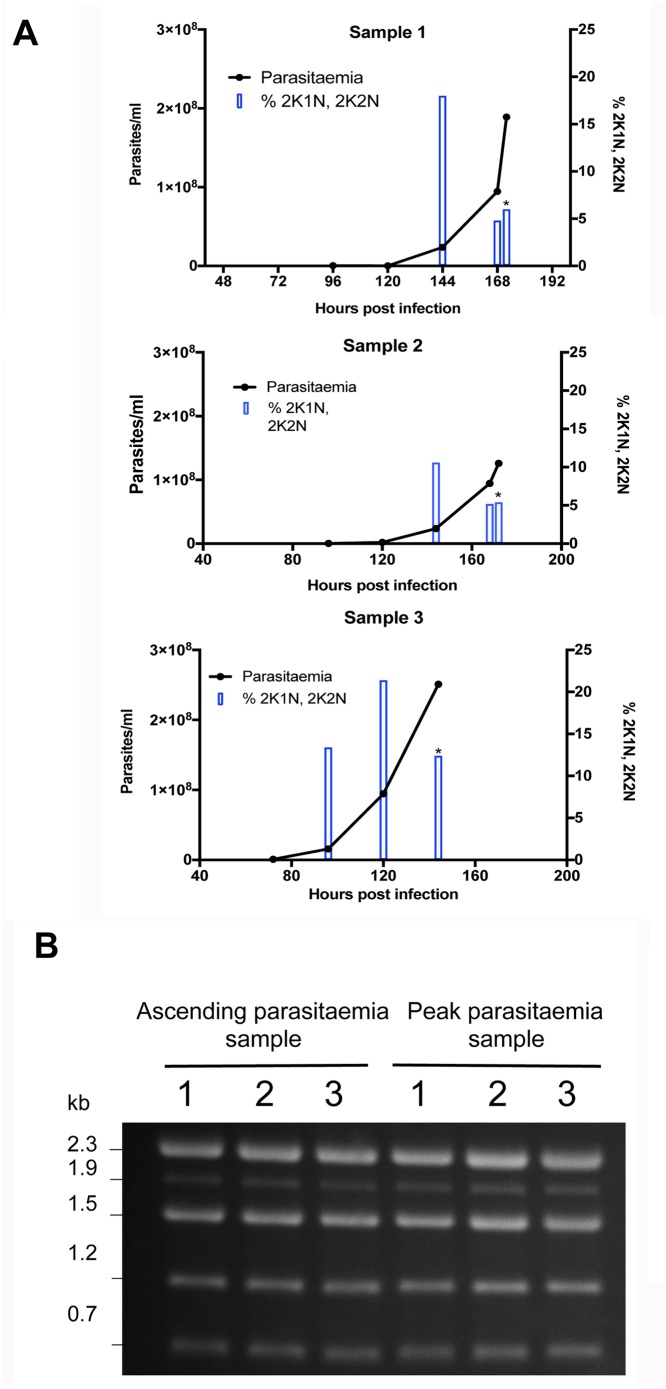
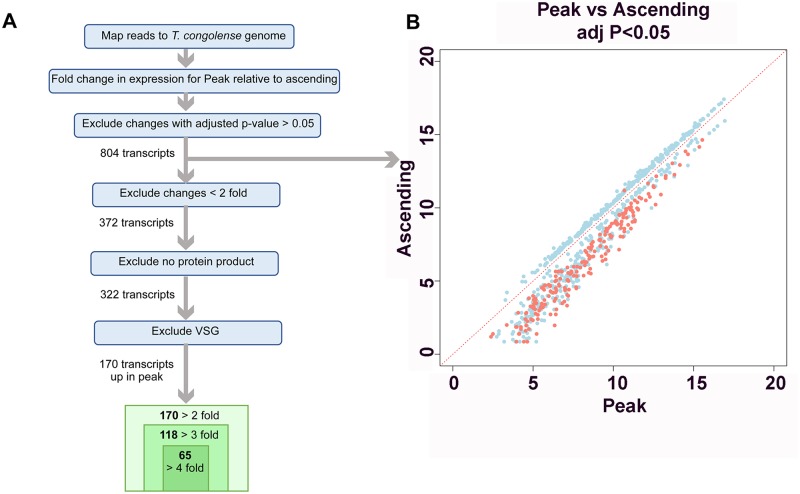
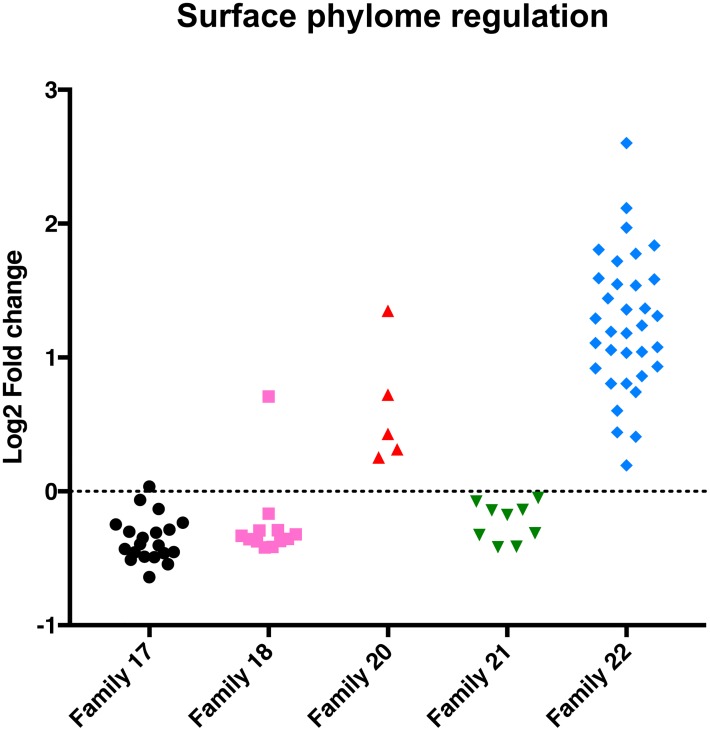
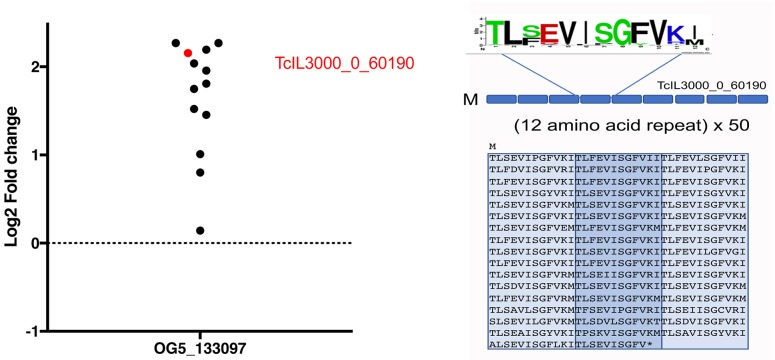
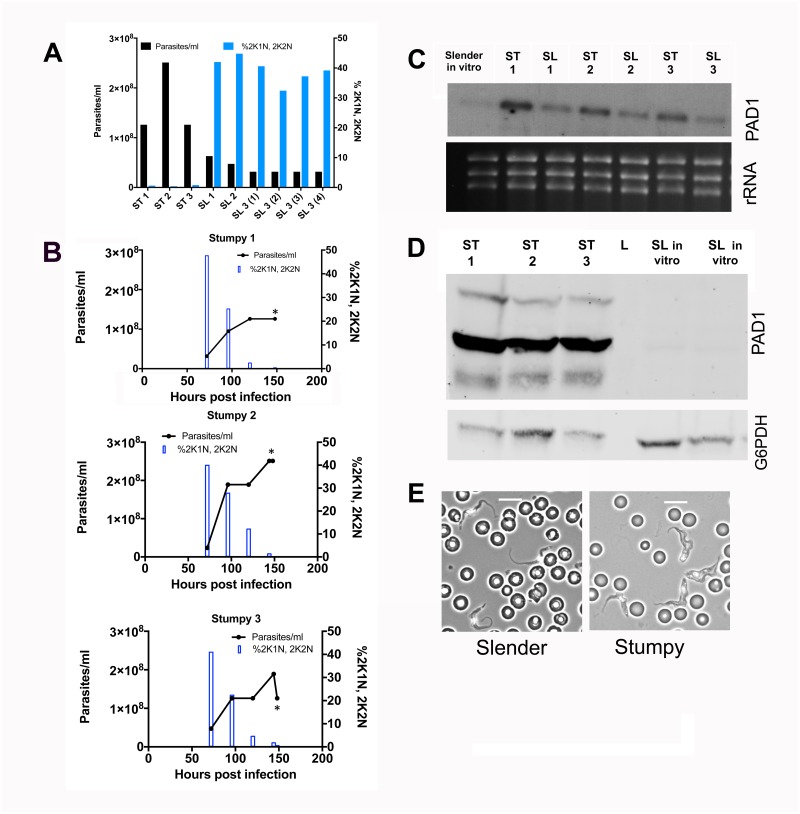
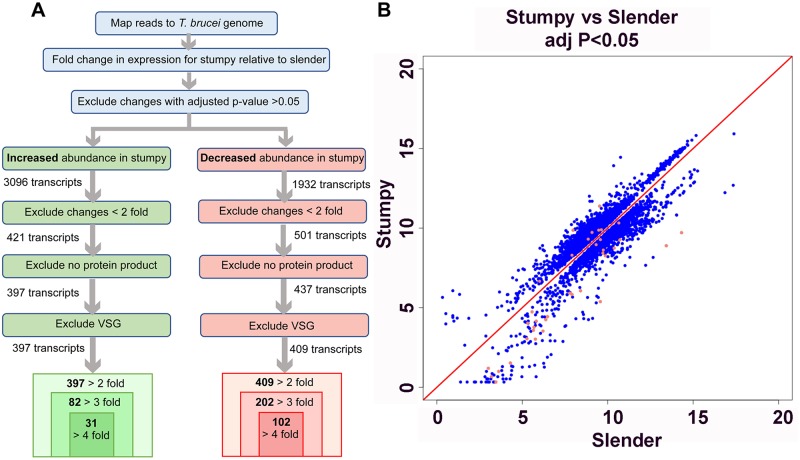
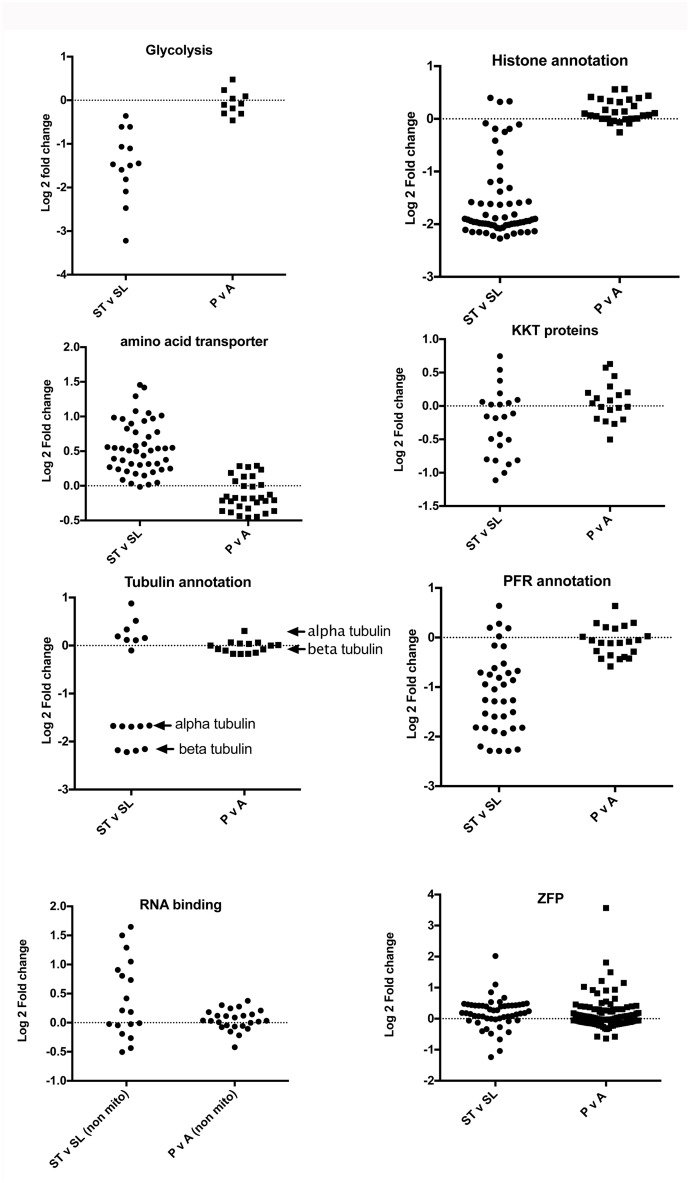
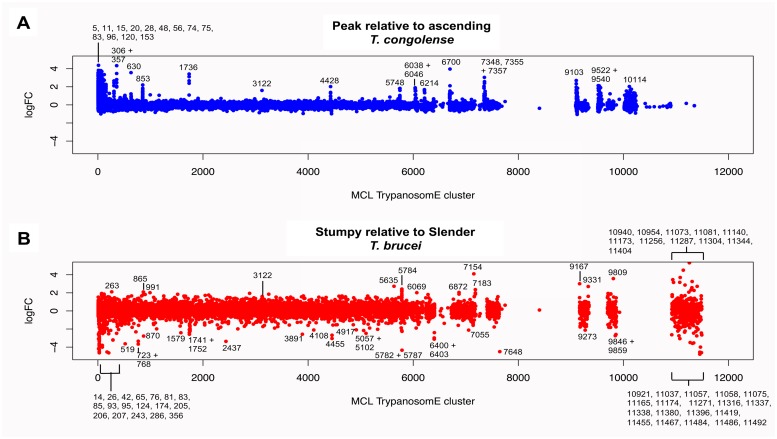
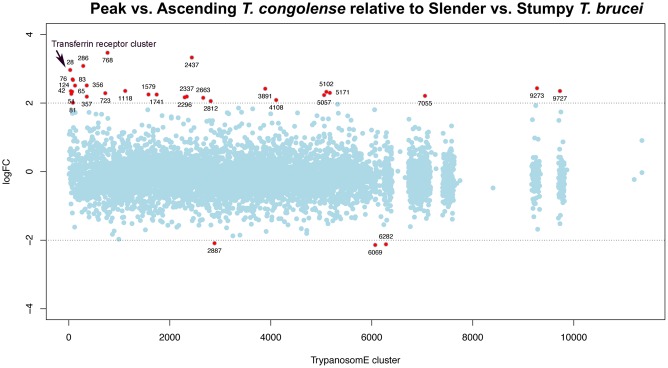
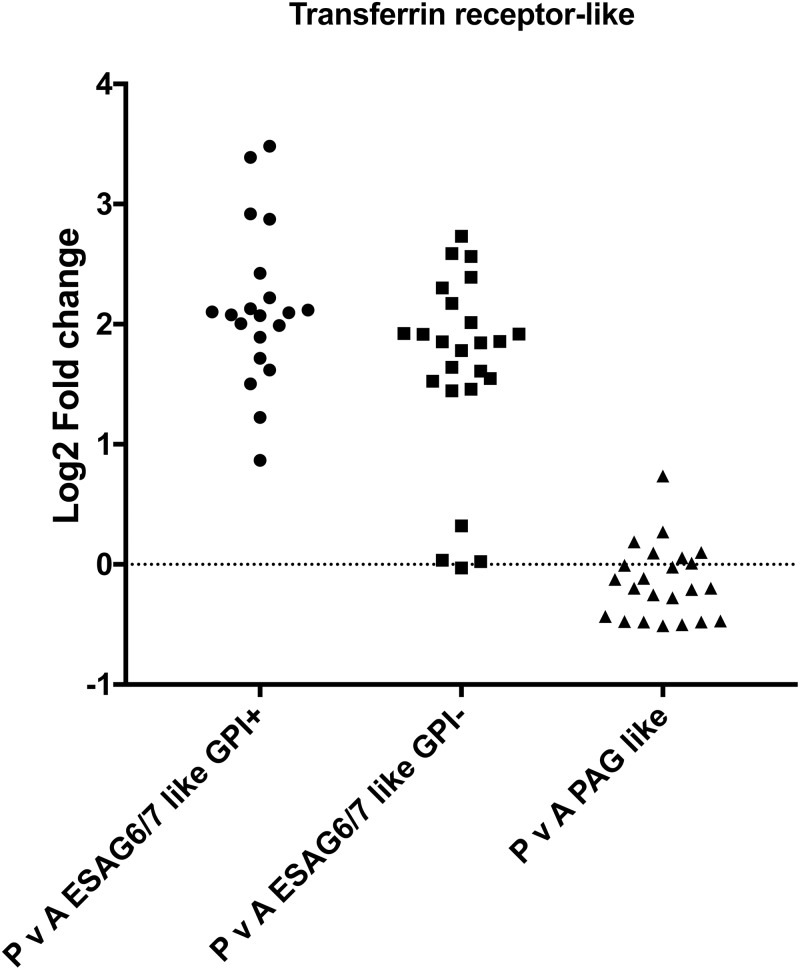
In the bloodstream of mammalian hosts Trypanosoma brucei undergoes well-characterised density-dependent growth control and developmental adaptation for transmission. This involves the differentiation from proliferative, morphologically 'slender' forms to quiescent 'stumpy' forms that preferentially infect the tsetse fly vector. Another important livestock trypanosome, Trypanosoma congolense, also undergoes density-dependent cell-cycle arrest although this is not linked to obvious morphological transformation. Here we have compared the gene expression profile of T. brucei and T. congolense during the ascending phase of the parasitaemia and at peak parasitaemia in mice, analysing species and developmental differences between proliferating and cell-cycle arrested forms. Despite underlying conservation of their quorum sensing signalling pathway, each species exhibits distinct profiles of gene regulation when analysed by orthogroup and cell surface phylome profiling. This analysis of peak parasitaemia T. congolense provides the first molecular signatures of potential developmental competence, assisting life cycle developmental studies in these important livestock parasites. Furthermore, comparison with T. brucei identifies candidate molecules from each species that may be important for their survival in the mammalian host, transmission or distinct tropism in the tsetse vector.


Conflict of interest statement

The authors have declared that no competing interests exist.

Figures

Fig 1
Fig 1. Biological characterisation of T. congolense material for expression analysis.
(A) Parasitaemia (lines) and cell cycle status (bars) of T. congolense IL3000 in murine infections used to generate samples for ‘peak parasitaemia’ transcriptome analysis. The proportion of parasites presenting 2 kinetoplast, 1 nucleus (2K1N), or 2 kinetoplast 2 nuclei (2K2N) configurations was assessed in 500 cells at each time point, providing a measure of proliferating cells in the population. As the parasitaemias progressed beyond 1x10⁸ parasites/ml the proportion of proliferating parasites declined indicative of cell cycle arrest. Asterisks indicate when the sample was harvested. (B) Ethidium bromide stained total RNA of T. congolense ‘ascending’ and ‘peak’ parasitaemia samples. Note that T. congolense presents 5 major rRNA bands, contrasting with 3 in T. brucei.
Fig 2
Fig 2. Expression differences between ascending and peak parasitaemia T. congolense.
(A.) Strategy for the comparison of mRNA expression between ascending and peak parasitaemia T. congolense. (B.)Scatterplot depicting transcripts that show significant (adjusted p value <0.05) expression difference between ascending and peak parasitaemia. Transcripts annotated as VSG are coloured red, these being significantly upregulated in the peak parasitaemia samples.
Fig 3
Fig 3. T. congolense-specific cell surface phylome regulation.
Log2 fold change (FC) for T. congolense-specific cell surface phylome families. Members of Family 20 and Family 22 are upregulated at peak parasitaemia whereas other cell surface phylome families are not upregulated. Note that the fold change in expression levels of all family members are shown irrespective of their statistical significance.
Fig 4
Fig 4. Regulatory profile of Orthogroup OG5_133097 in T. congolense.
Members of orthogroup OG5_133097 encompass predicted proteins comprised of 12 amino acid repeats. Many members of this T. congolense enriched orthogroup are upregulated at peak parasitaemia, with TcIL3000_0_60190 being 4.5 fold up regulated at peak parasitaemia (adj p = 0.033). This predicted protein comprises 50 copies of an imperfect 12 amino acid repeat.
Fig 5
Fig 5. Biological characterisation of T. brucei material for expression analysis.
(A.) Parasitaemia (black bars) and proliferation status (blue bars) for each sample used for transcriptome analysis of T. brucei slender and stumpy forms. The proportion of parasites presenting 2 kinetoplast, 1 nucleus (2K1N), or 2 kinetoplast 2 nuclei (2K2N) configurations was assessed in 500 cells at each time point, providing a measure of proliferating cells in the population. (B.) The progression of the parasitaemia and proliferation status throughout the parasitaemia of each of the infections used to prepare stumpy form mRNA, highlighting the cell cycle arrest of parasites as they develop toward stumpy forms. Samples were harvested for RNA on day 6 (indicated by an asterisk) (C.) Northern blot of each mRNA sample used for transcriptome analysis hybridised to a riboprobe for the stumpy specific marker, PAD1. Stumpy samples express more PAD1 mRNA than slender samples. (D.) PAD1 protein expression for the stumpy samples used for transcriptome analysis. In vitro cultured slender samples provide a negative control. Loading is indicated by detection of G6PDH (E.) Morphological analysis of the slender form samples (left hand side) or stumpy forms (right hand side) in blood. Scale bar represents 10μm.
Fig 6
Fig 6. Expression differences between slender and stumpy form T. brucei.
(A.)Strategy for the comparison of mRNA expression between slender and stumpy form T. brucei. (B.)Scatterplot showing transcripts that show significant (adjusted p value <0.05) expression difference between slender and stumpy samples. Transcripts annotated as VSG are coloured red.
Fig 7
Fig 7. Differential expression of components of different biological processes in T. congolense and T. brucei.
Log2 fold change of transcripts associated with different functional processes in peak versus ascending parasitaemia T. congolense, or stumpy versus slender T. brucei. For glycolysis, the relevant pathway enzymes were analysed (and their orthologues in T. congolense). For the other comparisons, annotation-based criteria (‘histone’, ‘amino acid transporter’, ‘KKT protein’, ‘tubulin’, ‘paraflagellar rod’, ‘RNA binding’ or ‘zinc finger protein’) were used to analyse each functional class. In the case of ‘histones’ this also included histone modifying enzymes; for the ‘RNA binding’ group this included pumillio class proteins as well as non-mitochondrial RNA binding proteins.
Fig 8
Fig 8. Differential orthogroup expression in T. congolense and T. brucei.
(A.) Log2 fold change between peak and ascending parasitaemia T. congolense of all transcripts aligned according to their MCL TrypanosomE orthologous grouping. Groups that show Log2FC of 2 or more in at least one member are annotated. (B.) Log2 fold change between stumpy and slender form T. brucei of all transcripts aligned according to their MCL TrypanosomE orthologous grouping. Groups that show Log2FC of 2 or more in at least one member are annotated.
Fig 9
Fig 9. Comparative orthogroup regulation in T. congolense and T. brucei differences between mean Log2FC values for orthologous group expression in peak versus ascending parasitaemia T. congolense and stumpy versus slender T. brucei.
A positive LogFC value indicates an orthologous group for which the fold change was greater for T. congolense ascending to peak parasitaemia than for T. brucei slender to stumpy differentiation, with a negative LogFC value indicating that the fold change was greater in the T. brucei samples. MCL TrypanosomE orthogroups showing at least 4-fold difference between species are shown in red.
Fig 10
Fig 10. Transferrin family regulation in T. congolense in ascending or peak parasitaemia.
Log2 fold change between peak and ascending parasitaemia of T. congolense members of the cell surface phylome family 15 (ESAG6-like transferrin binding, with or without a predicted GPI anchor) and family 14 (PAG-like transferrin binding).

Similar articles

Cited by

References

    1. Buscher P, Cecchi G, Jamonneau V, Priotto G. Human African trypanosomiasis. Lancet. 2017. 10.1016/S0140-6736(17)31510-6 . - DOI - PubMed
    1. Vanhollebeke B, Pays E. The trypanolytic factor of human serum: many ways to enter the parasite, a single way to kill. Mol Microbiol. 2010;76(4):806–14. Epub 2010/04/20. 10.1111/j.1365-2958.2010.07156.x . - DOI - PubMed
    1. Giordani F, Morrison LJ, Rowan TG, HP DEK, Barrett MP. The animal trypanosomiases and their chemotherapy: a review. Parasitology. 2016;143(14):1862–89. 10.1017/S0031182016001268 . - DOI - PMC - PubMed
    1. Morrison LJ, Vezza L, Rowan T, Hope JC. Animal African Trypanosomiasis: Time to Increase Focus on Clinically Relevant Parasite and Host Species. Trends Parasitol. 2016;32(8):599–607. 10.1016/j.pt.2016.04.012 . - DOI - PubMed
    1. Dyer NA, Rose C, Ejeh NO, Acosta-Serrano A. Flying tryps: survival and maturation of trypanosomes in tsetse flies. Trends Parasitol. 2013;29(4):188–96. 10.1016/j.pt.2013.02.003 . - DOI - PubMed

Publication types

MeSH terms